Postnatal Growth Monitoring of Preterm Infants
- 1. Department of Pediatrics, Ochsner LSU Health, USA
ABSTRACT
This brief report describes the methods to monitor postnatal growth in the preterm infants. The report is divided into two sections. Section 1 would address the definitions of extrauterine growth restriction (EUGR), while section 2 would discuss the growth monitoring in small for gestational age (SGA) infants.
KEYWORDS
• Postnatal Growth; Preterm Infants; Extrauterine growth restriction; Gestational age
CITATION
Sampognaro L, Manzar S. Postnatal Growth Monitoring of Preterm Infants. Ann Pediatr Child Health 2022; 10(3): 1273.
ABBREVIATIONS
NICU: Neonatal Intensive Care Unit; SGA: Small for Gestation Age; GV: Growth Velocity; WGR: Weight Gain Ratio; PGF: Postnatal Growth Failure; EUGR: Extra Uterine Growth Restriction; ZSD: z-score Difference
INTRODUCTION
Adequate growth is very important for the wellbeing of children, starting from birth. Growth monitoring is an essential part of pediatric training and practice. Infants born prematurely are at higher risk for growth delays. It is therefore, very important to monitor the growth of these babies very closely. Growth is traditionally monitored by plotting the weight, height and head circumference on the established growth charts, corrected for the gestational age and gender. While length/height and head circumference are important components of growth, this paper focuses on the adequate weight gain as a surrogate for adequate growth.
Most of the studies on growth monitoring use Z-score as the best system for analysis and presentation of anthropometric data, and subsequently as the most appropriate descriptor of malnutrition [1]. Rochow et al. [2], have shown that inclusion of weight gain ratio (WGR), in addition to delta z-score (? Z) or difference between z-score (ZSD), as a better way to monitor postnatal growth. In day-to-day practice, while the infant is still in the hospital, growth velocity (GV) is the most common indicator used to monitor growth [3]. In another study, Riddle et al. [4], described using z-score in addition to GV to monitor postnatal growth. Here, we present a more comprehensive method of assessing growth in preterm infants by combining the three factors: GV, WGR and ZSD, as a better way of assessing growth in preterm infant. The GV, WGR and ZSD were adapted from previous studies (Table 1) [2,3].
|
Table 1: Methods Used to Assess Postnatal Growth in SGA Infants [2,3]. |
|
|
Method |
Formula |
|
Growth velocity (g/kg/d) |
Current weight − Previous weight / Average weight x 1000 |
|
Weight Gain Ratio (WGR) |
Current weight − Previous weight / 50% Weight difference |
|
Z-score |
Current Z score − Previous Z score |
|
Average weight = Current weight + Previous weight / 2 50% Weight difference = 50% weight at current weight − 50% weight at previous weight Z-Score: From electronic chart or https://peditools.org/fenton2013/ |
|
A GV of 10-15 g/kg/d, a WGR of near 1 and a positive (or less negative) z-score difference (ZSD) was considered appropriate based on the literature [2,3,5].
SECTION 1
Extrauterine growth restriction (EUGR) is defined as the z-score for weight below the 10th percentile (z-score <−1.28) at discharge or around 36-40 weeks’ postmenstrual age (PMA) [5]. In this definition, one has to wait until 36-40 week PMA to entertain the diagnosis of EUGR, which should be detected and remediated early. Peila et al. [6], described a cross-sectional definition of EUGR as the weight at any given time below the 10th percentile. The problem with this definition is that it does not account for the growth velocity. A preterm infant could be below 10th percentile but if he /she was 7th percentile before, he/she is improving. The other way to define EUGR is to see how much deviation from the 50th percentile occurs on the growth chart using weight gain ration (WGR). It is therefore very important to use a combination of the growth velocity (GV), WGR and ? Z to define and diagnose EUGR early.
We present an example to further illustrate the importance of using all three parameters. In the example, a preterm infant was followed from birth to discharge. The growth was assessed at 26 weeks postmenstrual age (PMA), 30 weeks PMA, 36 weeks PMA and at discharge. The information needed to calculate all three parameters were current and previous weight, current 50th percentile and previous 50th percentile weight, and current and previous z-scores. Using the Microsoft Excel Spreadsheet, the GV, WGR, and Z were calculated (supplementary file provided). In example, at day 20, the GV was 10.74 g/kg/d, WGR was 0.43 and ? Z was -0.69 (Figure 1).
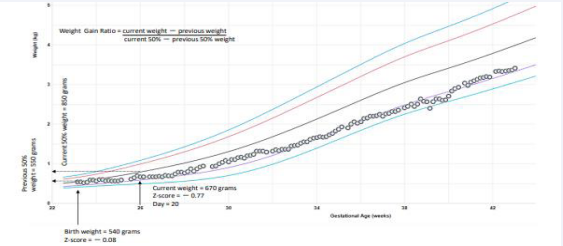
Figure 1 It shows the growth assessed at 26 weeks postmenstrual age.
At day 48, the GV was13.28 g/kg/d, WGR was 0.63 and ? Z was -0.76 (Figure 2).
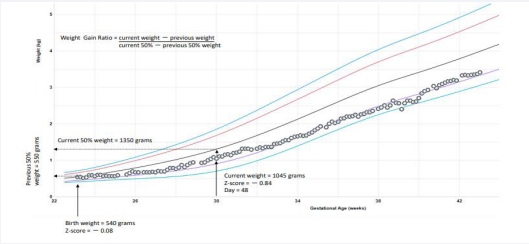
Figure 2 It shows the growth assessed at day 48.
At day 90, the GV was 12.97 g/kg/d, WGR was 0.73 and ? Z was -1.23 (Figure 3).
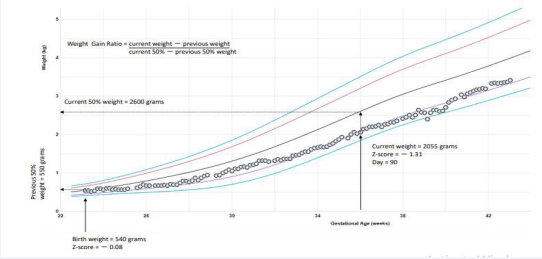
Figure 3 It shows the growth assessed at day 90.
At day 139, the GV was10.46 g/kg/d, WGR was 0.83 and ? Z was – 1.02 (Figure 4).
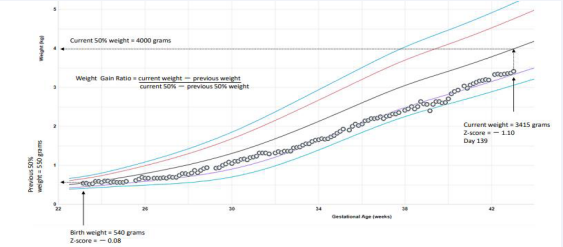
Figure 4 It shows the growth assessed at day 139.
The GV at all these points were within the expected range of 10-15 g/kg/d as described by Patel el al. [3]. Similarly, infant z-scores remained greater than the definition of EUGR (the z-score < – 1.28). And finally, using the Rochow et al. [2], WGR, the postnatal growth was getting close to 1 (0.43-0.83). Thus, the infant could be excluded as a case of EUGR.
In conclusion, we suggest that a triple value EUGR assessment model using GV, WGR, and Z as a better way to assess postnatal growth and to define EUGR in preterm infants.
SECTION 2
Small for gestational age (SGA), is defined as a birth weight of less than the 10th percentile for gestational age [7]. SGA infants’ growth points fall below the standard growth charts; it is therefore difficult to attain a visual sense of growth. It is prudent to find ways of following growth and explaining it to parents. We describe here four examples of SGA infants using again a combination of GV, WGR and ZSD in efforts to better portray a picture of growth.
The four examples are displayed in Table 2 and Figures 5-8.
|
Table 2 |
||
|
Example 1 (day 20) |
||
|
Parameter |
Current |
Previous |
|
Weight |
670 |
540 |
|
50% Weight |
850 |
550 |
|
Z-score |
-0.77 |
-0.08 |
|
Example 2 (day 48) |
||
|
Parameter |
Current |
Previous |
|
Weight |
1045 |
540 |
|
50% Weight |
1350 |
550 |
|
Z-score |
-0.84 |
-0.08 |
|
Example 3 (day 90) |
||
|
Parameter |
Current |
Previous |
|
Weight |
2055 |
540 |
|
50% Weight |
2600 |
550 |
|
Z-score |
-1.31 |
-0.08 |
|
Example 4 (day 139) |
||
|
Parameter |
Current |
Previous |
|
Weight |
3415 |
540 |
|
50% Weight |
4000 |
550 |
|
Z-score |
-1.10 |
-0.08 |
|
Example 5 (day 7) |
||
|
Parameter |
Current |
Previous |
|
Weight |
680 |
600 |
|
50% Weight |
880 |
800 |
|
Z-score |
-1.8 |
-2.2 |
|
Example 6 (day 7) |
||
|
Parameter |
Current |
Previous |
|
Weight |
1720 |
1600 |
|
50% Weight |
2800 |
2000 |
|
Z-score |
-0.8 |
-1.2 |
|
Example 7 (day 76) |
||
|
Parameter |
Current |
Previous |
|
Weight |
1360 |
335 |
|
50% Weight |
2600 |
750 |
|
Z-score |
-3.11 |
-2.95 |
|
Example 8 (day 47) |
||
|
Parameter |
Current |
Previous |
|
Weight |
2090 |
1150 |
|
50% Weight |
3400 |
1700 |
|
Z-score |
-1.56 |
-2.68 |
In example 5, the growth points are up and down on a daily basis, giving a poor visual impression of growth, but when we calculate but when we calculate the GV, WGR and ZSD, we note a reassuring pattern, GV 17 g/kg/d, WGR of 1 and a positive ZSD (Figure 5).
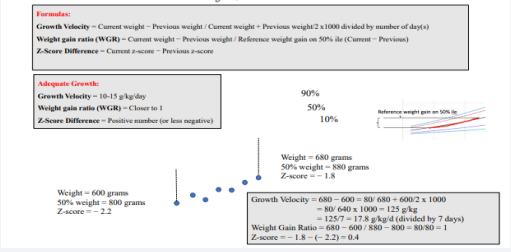
Figure 5 Figure shows SGA infants using a combination of GV, WGR and ZSD that portrayed a better picture of growth.
In example 6, again the individual growth points are up and down, but the GV and ZSD are reassuring with values of 10.2 g/kg/d and a positive ZSD, meanwhile, the WGR is low, with a value of 0.15 (Figure 6).
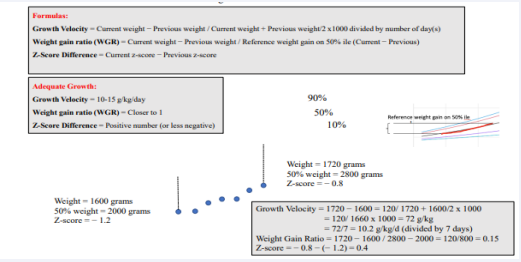
Figure 6 Figure shows SGA infants using a combination of GV, WGR and ZSD that portrayed a better picture of growth.
As two of the parameters are within the range, we can reassure the parents and continue to follow the growth. Similarly, in example 7 and 8, the GV, WGR and ZSD were all calculated by using the formulae (Figure 7 and 8),
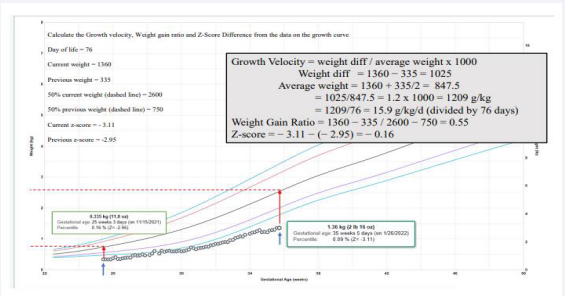
Figure 7 Figure shows SGA infants using a combination of GV, WGR and ZSD that portrayed a better picture of growth.
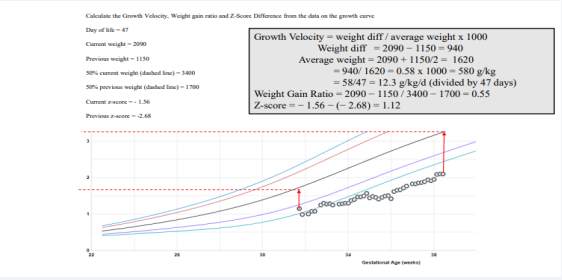
Figure 8 Figure shows SGA infants using a combination of GV, WGR and ZSD that portrayed a better picture of growth.
with reassuring resulting values. As seen in the above examples by using a combination of GV, WGR and ZSD a better assessment of growth could be made in SGA infants.
The main limitation of the study is the validation on a larger number of infants. The calculation does require some mathematical skill, but by using the Microsoft Excel Spreadsheet (provided in supplementary file), it could be easily done. We expect that the electronic health system could incorporate these formulas so that values could be easily displayed on growth charts. It is important to note that in addition to weight, the linear growth and head growth should be followed by measuring weekly length and head circumference. in addition to following the weight.
In conclusion, using a combination of GV, WGR and ZSD to monitor growth among SGA infants would help provider and parents better understand the postnatal growth.
AUTHOR CONTRIBUTION
Dr. Manzar conceptualized the study with Dr Sampognaro. Dr Manzar and Dr. Sampognaro reviewed the manuscript and provided expert opinion.
ETHICAL APPROVAL
This is a description report on growth analysis on small for gestational age infants. No patient identifier was used. In compliance with HIPPA. No intervention was done on any patients. The IRB did not require consent.
REFERENCES
- de Onis M, Blössner M. The World Health Organization Global Database on Child Growth and Malnutrition: methodology and applications. Int J Epidemiol. 2003; 32: 518-526.
- Rochow N, Landau-Crangle E, So HY, Pelc A, Fusch G, Dabritz J, et al. Z-score differences based on cross-sectional growth charts do not reflect the growth rate of very low birth weight infants. PLoS One. 2019; 14: e0216048.
- Patel AL, Engstrom JL, Meier PP, Jegier BJ, Kimura RE. Calculating postnatal growth velocity in very low birth weight (VLBW) premature infants. J Perinatol. 2009; 29: 618-622
- Riddle WR, DonLevy SC, Qi XF, Giuse DA, Rosenbloom ST. Equations to support predictive automated postnatal growth curves for premature infants. J Perinatol. 2006; 26: 354-358.
- Fenton TR, Chan HT, Madhu A, Griffin IJ, Hoyos A, Ziegler EE, et al. Preterm Infant Growth Velocity Calculations: A Systematic Review. Pediatrics. 2017; 139: e20162045.
Peila C, Spada E, Giuliani F, Maiocco G, Raia M, Cresi F, et al. Extrauterine Growth Restriction: Definitions and Predictability of Outcomes in a Cohort of Very Low Birth Weight Infants or Preterm Neonates. Nutrients. 2020; 12: 1224.- Fenton TR, Kim JH. A systematic review and meta-analysis to revise the Fenton growth chart for preterm infants. BMC Pediatr. 2013; 13: 59.


