Urinary Fluoride Excretion among Children in Qatar
- 1. Hamad Dental Centre, Hamad Medical Corporation, Qatar
- 2. Translational Research Institute, Hamad Medical Corporation, Qatar
- 3. Australian Research Centre for Population Oral Health, Adelaide Dental School, The University of Adelaide, Australia
- 4. Faculty of Health Sciences, The University of Queensland, Australia
- 5. Department of Public Health, Ministry of Public Health, Qatar
- 6. Department of Dentistry, Primary Health Care Corporation, Qatar
ABSTRACT
Aim: The aim of this study was to assess the daily urinary fluoride excretion of children in Qatar.
Methods: The sampling frame was children who participated in the Qatar Child Oral Health Survey 2017 (QCOHS 2017). A sub-group of QCOHS 2017 were invited to participate in the study which was conducted in early 2019. Some 223 children in 25 schools in Doha, Al Khor and Al Rayyan were recruited. All were in areas served by the desalinated, low fluoride water supply. The child’s age, sex, height (cm) and weight (kg) were collected and time of day of the collection, brushing their teeth with toothpaste and/ or having breakfast that morning noted. The concentration of fluoride was determined using a specific fluoride ion electrode, after adding TISAB III in a 10:1 (v/v) ratio. Urinary creatinine concentration was measured by the enzymic creatinine assay based on colorimetric method for hydrogen peroxide measurement.
Results: The mean fluoride concentration was 0.36 mgF/L, the F:Cr ratio was 0.41 mgF:gCr/L, the fluoride excretion per day was 0.19 mg/day and 0.0061 mg/kgbw/day. Fluoride excretion was similar across all ages, sexes and for Qatari and non-Qatari children. Children who ate breakfast and who brushed their teeth on the morning before the collection of the sample had significantly higher fluoride excretion. On the basis that between 1/3rd and 1/2th the fluoride intake is excreted, fluoride intake in the children would be between 0.38 to 0.57 mgF/day and 0.012 to 0.018 mgF/kgbw/day. The range of 0.05- 0.07 mgF/kgbw/day has been suggested as a lower and upper bound of optimal fluoride intake.
Conclusion: The level of fluoride excretion leaves considerable scope to consider increasing children’s exposure to fluoride for the prevention of caries.
KEYWORDS
• Child
• Fluorides
• Creatinine
• Health surveys
• Qatar
CITATION
Gibreel S, Prabhu KS, Khan SU, Spencer AJ, Ha D, et al. Urinary Fluoride Excretion among Children in Qatar. Ann Pediatr Child Health 2021; 9(5): 1239.
ABBREVIATIONS
DMFT: Decayed, Missing and filled Permanent Teeth; WHO: World Health Organization; QCOHS 2017: Qatar Child Oral Health Survey 2017; iTRI: interim Translational Research Institute laboratory, Qatar; IOM: Institute of Medicine, USA
INTRODUCTION
Children in Qatar have a high prevalence (>72%), and severity of dental caries (decayed, missing and filled primary teeth), dmft of >4.2 teeth at 6-years and prevalence of >85% and severity of caries (decayed, missing and filled permanent teeth), DMFT at 12-years of 4.6 teeth [1-3]. This is equivalent to the highest levels reported in OECD countries 40 years ago and is well above WHO global targets set for the year 2000. The caries experienced is very largely untreated (filled primary and permanent teeth represent a small proportion of all teeth with caries experience) [2]. This severity of caries experience is a challenge for the current dental system. This leads to distress for children and their families and is costly to the healthcare system, yet largely avoidable.
There is a need to improve child dental health in Qatar both for the welfare of children and as an investment in the oral health of adults of the future.
There are a number of possible directions Qatar could take to improve child oral health: increase access to dental services for kindergarten and school children; initiate outreach or targeted preventive services for kindergarten and school children; introduce oral health promotion for life stages and directed at settings that prioritize ‘susceptible groups’ like pregnant women and mothers of pre-school children; conduct programs which aim to change risk behaviours like reductions in consumption of sugar sweetened beverages in the diet and increase the frequency of tooth brushing with fluoridated toothpaste; and implement a fluoridation program [4].
These last two directions involve changing children’s exposure to fluoride. Children’s exposure to fluoride could be changed by programs to alter tooth brushing behaviour with a fluoridated toothpaste. Qatari children begin tooth brushing with a fluoridated toothpaste late and many have an inadequate frequency of tooth brushing. Less than 2/3rds of 4–8- year-old children had started brushing by age 4-years. Only just over half of all children were brushing twice a day [2]. So, there is scope to increase children’s exposure to fluoride through improved tooth brushing practice with a fluoridated toothpaste.
Another direction is some form of fluoridation program. Some 99% of Qatar’s reticulated water supply is provided by desalination plants [5]. Desalination eliminates the naturally occurring fluoride in sea water so almost all tap water in Qatar has no fluoride. Some 34% of children reportedly use tap water as drinking water on a usual day. Most children (82%) drink some bottled or packaged water on a usual day. Overall tap water made up only 19% of water drunk on a usual day [2]. However, the source water for the leading local brands of bottled water is the reticulated water supply. Hence, locally produced bottled waters also have negligible fluoride. Some imported waters have naturally occurring fluoride, but their share by volume drunk is limited [2]. Proposals to increase children’s exposure to fluoride through drinking water have been raised, varying from fluoridation of all tap water or school drinking water alone to fluoridating all locally produced bottled water or bottled water for children in the school environment [6].
Historically countries like Qatar were dependent on bores/ wells for drinking water. Such water was generally high in fluoride, i.e., more than 5 mgF/L. This high fluoride drinking water was associated with the presence of dental fluorosis. A study of patients at a health care facility across 2000-2003 described the prevalence of fluorosis among 8–14-year- olds as 23% [7]. Fluorosis among adults was particularly high, but this reflected exposure decades earlier. The movement to almost entirely desalinated tap water with negligible fluoride has occurred over several decades. More contemporary data from 2011 found a lower prevalence among 12– and 15–year-old children of 15 and 17% respectively [1], and data from 2017 found a prevalence of fluorosis of 10% among 7–8- year-olds, but only half, 5%, were confirmed later through a secondary photographic analysis. These were of very mild to mild severity [2]. While the recent data indicate a low prevalence of fluorosis, there is still a residual concern with historical exposure to fluoride and fluorosis levels.
The World Health Organization (WHO), recommends that public health authorities be aware of fluoride exposure levels in a population before introducing any additional fluoride program for prevention of dental caries [8]. Recent reviews conclude that 24– hour urine is a useful biomarker of contemporary fluoride exposure [9]. A review by Rugg-Gunn et al in 2011 on contemporary biological markers of exposure to fluoride stated that that daily urinary fluoride excretion is suitable for predicting fluoride intake for groups of people, but not individuals [10]. This means that fluoride excretion in urine can assist in setting the optimal fluoride level in a population’s water supply but should not be used to try to adjust an individual’s fluoride intake. While 24–hour urinary fluoride excretion is the gold standard, daily urinary fluoride excretion can be approximated by a spot urine sample of fluoride utilizing the ratio of fluoride to creatinine and estimated total creatinine excretion in a day which is associated with body weight [11].
Therefore, the aim of this study was to assess the daily urinary fluoride excretion of children in Qatar as a background to consideration of fluoride programs as a way of improving child oral health.
MATERIALS AND METHODS
Sampling
The sampling frame was children who participated in the Qatar Child Oral Health Survey 2017 (QCOHS 2017) (2). QCOHS 2017 was a national study of the oral health of 4–8- year-old children in Qatar. The survey followed a complex sampling strategy built around clusters of children selected in 20 kindergartens and 40 schools and weighted the resulting data collected so that the findings accurately represent the Qatar child population. Detailed information was collected through an extensive parental dual- language questionnaire and an oral epidemiological (clinical) examination conducted by calibrated dentist examiners.
A total of 2,400 children were invited to take part in the Survey and 1,154 children had complete data, i.e., both the parental questionnaire and the oral epidemiological examination giving a participation rate of 48%.
A sub-group of QCOHS 2017 that consisted of children of 4–8 years-age as at September 2017 attending schools in Doha, Al Khor and Al Rayyan in Qatar from different nationalities (Qatari and Non-Qatari), were invited to participate in the nested Urinary Fluoride Study which was conducted in March through to June 2019. Parents were asked to give consent to a school nurse obtaining a urine sample during the early part of the school day. The time of collection was similar for all children, from 7:30 am to 12:30pm.
Data and urine sample collection
The child’s Survey ID, age, sex and height (cm) and weight (kg) were collected and time of day of the collection of the urine sample noted. Further, children were asked if they brushed their teeth with toothpaste and had breakfast that morning before the sample collection. A polythene 100 ml ‘sample’ bottle was used to collect the urine sample.
Laboratory analysis
The samples were stored in a cooled box and transferred to the interim Translational Research Institute (iTRI) laboratory, Doha. The laboratory froze samples until such time that all samples were available for analysis. Samples were thawed, shaken, and several 1 ml aliquots taken for F analysis and for Cr analysis.
Fluoride determination in urine samples: The concentration of fluoride was determined electrochemically using the Orion Star™ A214 pH/ISE Benchtop Meter, with a USEP fluoride ion selective electrode (Thermo Scientific), after adding TISAB III in a 10:1 (v/v) ratio. Four standards were used 0.01, 0.1, 1.0 and 10.0 ppm fluoride for the calibration of the electrode before starting any run of analyses on the urine samples. All the four standard solutions and the samples were tested at the same temperature (between 20°C and 25°C). The fluoride concentration was recorded after a stable reading was obtained. The electrode was rinsed with deionized water and blotted dry, then the same steps are repeated for duplicate aliquots. Duplicate fluoride concentration measurements were available to test reliability and were averaged for further statistical analysis.
Creatinine determination in urine samples: Urinary creatinine concentration (g/L) of an aliquot of the spot urine samples was measured the enzymic creatinine assay based on colorimetric method for hydrogen peroxide measurement [12] using RX Daytona Plus kit (CR 8317) (Randox Rx Daytona Plus Fully Automated Bio Chemistry Analyzer, Randox Laboratories U.K.).
Analysis
Fluoride excretion/kg body weight/day: The fluoride/ creatinine ratio (mgF/gCr), was calculated from the concentrations of urinary fluoride mgF/L and urinary creatinine gCr/L. The child’s 24-hour urinary fluoride excretion was calculated by multiplying the ratio by the standard creatinine value (15 mg/kg body weight/day [13]) by the child’s body weight [11]. Urinary fluoride excretion on a body weight basis (mg/kg body weight/day) was then calculated by dividing each child’s 24-hour urinary fluoride excretion by their weight.
RESULTS
Some 223 children in 25 schools were recruited into the Urinary Fluoride Study. Thirteen schools were community / independent or public schools where 139 children attended and 12 were private schools where 84 attended. Some 24 children either provided little or no urine at the time of collection and therefore their data were incomplete. Table 1 presents the background characteristics of the participating children.
Table 1: Characteristics of Qatar children who participated in the Urinary Fluoride Study.
|
Characteristic of population |
n |
Percent (95% CI) |
Mean (95% CI) |
|
Age |
199 |
|
8.9 (8.7-9.1) |
|
6 |
20 |
10.0 (6.2-15.1) |
|
|
7 |
13 |
6.5 (3.5-10.9) |
|
|
8 |
26 |
13.1 (8.7-18.6) |
|
|
9 |
68 |
34.2 (27.6-41.2) |
|
|
10+ |
72 |
36.2 (29.5-43.3) |
|
|
Gender |
|
||
|
Boys |
102 |
51.3 (44.1-58.4) |
|
|
Girls |
97 |
48.7 (41.8-55.7) |
|
|
Nationality |
|
|
|
|
Qatari |
39 |
19.6 (14.3-25.8) |
|
|
Non-Qatari |
160 |
80.4 (74.2-85.9) |
|
|
Height |
199 |
|
131.8 (130.6-133.1) |
|
Weight |
199 |
33.2 (31.6-34.9) |
|
|
Breakfast before sampling |
199 |
|
|
|
No |
69 |
34.7 (28.1-41.7) |
|
|
Yes |
130 |
65.3 (58.3-71.9) |
|
|
Toothbrushing before sampling |
|
||
|
No |
71 |
35.7 (29.0-42.7) |
|
|
Yes |
128 |
64.3 (57.2-70.9) |
|
They were unevenly distributed across the 6 -10 age with more in the 9 and 10+ ages, just more than half were boys and just less than 20% were Qatari. Just over one third had no breakfast on the morning of the urine sample collection and a little more than a third had not brushed their teeth that morning (Table 1).
Of the 199 children with complete data, the mean fluoride concentration of the duplicate urine aliquots was 0.36 mgF/L. There was a strong correlation between the duplicate fluoride measurements, with r= 0.98, p<0.001.
Table 2 presents the background physical measurements of height and weight.
Table 2: Height (cm) and weight (kg) of Qatar children (n=199) who participated in the Urinary Fluoride Study.
|
|
Height |
Weight |
|
All |
131.8 (130.6-133.1) |
33.2 (31.6-34.9) |
|
Age |
|
|
|
6 |
118.6 (116.5-120.7) |
24.2 (21.6-26.7) |
|
7 |
123.4 (119.2-127.5) |
25.8 (23.6-28.1) |
|
8 |
129.9 (127.7-132.2) |
32.5 (28.8-36.1) |
|
9 |
132.4 (130.7-134.1) |
33.1 (30.4-35.9) |
|
10+ |
137.2 (135.3-139.0) |
37.5 (34.3-40.6) |
|
Gender |
|
|
|
Boys |
131.6 (129.7-133.4) |
33.4 (31.0-35.8) |
|
Girls |
132.1 (130.3-133.8) |
33.0 (30.7-35.4) |
|
Nationality |
|
|
|
Qatari |
131.1 (128.3-133.9) |
35.8 (30.8-40.9) |
|
Non-Qatari |
132.0 (130.6-133.4) |
32.6 (30.9-34.3) |
|
Breakfast before sampling |
|
|
|
No |
132.3 (130.2-134.5) |
33.6 (30.8-36.4) |
|
Yes |
131.5 (129.9-133.1) |
33.0 (30.9-35.1) |
|
Toothbrushing before sampling |
|
|
|
No |
130.3 (128.3-132.4) |
32.1 (29.5-34.7) |
|
Yes |
132.6 (131.0-134.3) |
33.8 (31.7-36.0) |
Height and weight increased across ages. There was no difference in height or weight between boys and girls, Qatari and non-Qatari children, or breakfast or tooth brushing behaviour on the morning of the collection of the urine sample.
The key fluoride in urine measurements by child characteristics are presented in Table 3.
Table 3: Urinary fluoride measurements (mean and 95% CI) by child characteristics.
|
|
F:Cr mg F/g Cr |
F mg F/day |
mg F /kg bw/day |
|
All |
0.41 (0.36-0.46) |
0.19 (0.17-0.21) |
0.0061 (0.0054-0.0068) |
|
Age |
|
||
|
6 |
0.60 (0.43-0.77) |
0.21 (0.15-0.27) |
0.0090 (0.0064-0.0116) |
|
7 |
0.54 (0.17-0.90) |
0.19 (0.07-0.32) |
0.0081 (0.0027-0.0136) |
|
8 |
0.35 (0.29-0.40) |
0.16 (0.14-0.19) |
0.0053 (0.0041-0.0064) |
|
9 |
0.35 (0.29-0.40) |
0.16 (0.14-0.19) |
0.0052 (0.0044-0.0061) |
|
10+ |
0.41 (0.32-0.50) |
0.22 (0.17-0.26) |
0.0062 (0.0048-0.0075) |
|
Gender |
|
||
|
Boys |
0.39 (0.33-0.44) |
0.18 (0.15-0.20) |
0.0058 (0.0049-0.0067) |
|
Girls |
0.43 (0.36-0.51) |
0.20 (0.17-0.23) |
0.0065 (0.0054-0.0076) |
|
Nationality |
|
||
|
Qatari |
0.37 (0.28-0.45) |
0.18 (0.14-0.22) |
0.0055 (0.0042-0.0068) |
|
Non-Qatari |
0.42 (0.36-0.47) |
0.19 (0.17-0.21) |
0.0063 (0.0054-0.0071) |
|
Breakfast before sampling |
|
||
|
No |
0.29 (0.25-0.33) |
0.14 (0.12-0.16) |
0.0043 (0.0037-0.0049) |
|
Yes |
0.47 (0.40-0.54) |
0.21 (0.19-0.24) |
0.0071 (0.0061-0.0081) |
|
Toothbrushing before sampling |
|
||
|
No |
0.33 (0.28-0.38) |
0.15 (0.13-0.17) |
0.0049 (0.0042-0.0057) |
|
Yes |
0.45 (0.38-0.52) |
0.21 (0.18-0.24) |
0.0068 (0.0058-0.0078) |
The F:Cr ratio was 0.41mgF/gCr (95%CI 0.36-0.46). No significant difference was found by age, sex or nationality. However, those children who eat breakfast or who brushed their teeth on the morning before the collection of the urine sample had significantly higher F:Cr ratios. The estimated fluoride excretion per day was 0.19 mgF/day (0.17-0.21. Fluoride excretion per day increased across the ages, but there was no significant difference by sex or by nationality. Fluoride excretion per day was significantly higher among those children who eat breakfast or who brushed their teeth on the morning before the collection of the urine sample. The fluoride excretion per kg body weight per day was 0.0061 mgF/kgbw/ day (0.0054-0.0068). There was no significant difference across ages, sex or nationality. However, fluoride excretion per kg body weight per day was significantly higher among those children who ate breakfast or who brushed their teeth on the morning before the collection of the urine sample (Table 3).
Eating breakfast and brushing teeth on the morning before the collection of the urine sample were associated and the unadjusted fluoride excretion per kg body weight per day with each behaviour confounded. Table 4 presents fluoride excretion per day and fluoride excretion per kg body weight per day by all possible combinations of these two behaviours.
Table 4: Urinary fluoride excretion per kg body weight per day by breakfast and toothbrushing behaviour, F mg/ kg bw/ day.
|
|
Toothbrushing before sampling |
|||
|
No |
Yes |
|||
|
n |
Mean (95%CI) |
n |
Mean (95%CI) |
|
|
Breakfast before sampling |
|
|||
|
No |
36 |
0.0048 (0.0039-0.0058) |
33 |
0.0038 (0.0031-0.0045) |
|
Yes |
35 |
0.0051 (0.0040-0.0061) |
95 |
0.0078 (0.0063-0.0091) |
Fluoride excretion (mg) per kg body weight per day was significantly greater when both behaviours were present when compared with the other possible combinations of behaviour. Fluoride excretion per kg body weight per day did not significantly differ across the other possible combination of behaviour. However, the number of children in these combinations was lower and the confidence intervals greater.
Figure 1 presents the cumulative frequency distribution for fluoride excretion per kg body weight per day.
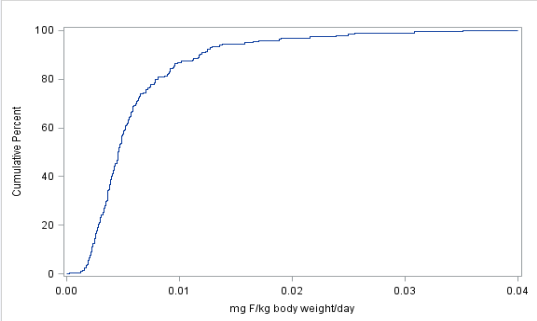
Figure 1 Cummulative distribution of fluoride excretion mgF/kg body weight/day.
Most children had very low fluoride excretion with 80% of children with less than 0.001 mgF/kgbw /day. Also indicated are the interquartile range (25th to 75th percentile), and the 90th percentile for fluoride excretion per kg body weight per day. The interquartile range was 0.0032 to 0.0070 mgF/kgbw/day. At the 90th percentile fluoride excretion per kg body weight per day was 0.0118 mgF / kgbw/day. The 90th percentile level is still very low.
DISCUSSION
Spot urine samples were collected from children at selected schools. The mean fluoride concentration was 0.36 mgF/L, the F:Cr ratio was 0.41 mgF/gCr, the fluoride excretion per day was 0.19 mgF/day and the F excretion on a body weight basis was 0.0061 mg/kg bw/day. Fluoride excretion per day was similar across the ages, sexes and for Qatari and non-Qatari children. The estimate of 0.19 mgF/day excreted was within the range reported by Akpata et al. (2014), for children in 7–9-year-olds in Kuwait of 0.13-0.22 mgF/day [14].
Both the present study and that by Akpata et al. (2014), used spot urine sampling. Fluoride excretion based on morning spot urine samples and applying the mgF:gCr ratio have been found correlate well with 24-hour urine fluoride excretion estimates [11]. Ideally these samples should be first morning samples. This was not possible to ensure in the present study. The results of the present study show that the spot urine fluoride excretion estimates were associated with behaviours in the hours immediately before the urine sample was obtained. There were also some apparent outliers, but these have not been removed from the analysis.
While some information on diet and water consumption was available on these Qatari children, it had been collected nearly two years ahead of the urine collection. Therefore, no attempt has been made to associate individual fluoride excretion to diet or drinking water consumption. Instead, there has been an effort to link urinary fluoride excretion to breakfast and tooth brushing behaviour. Fluoride excretion per kg body weight per day was significantly higher for those who had eaten breakfast and brushed their teeth that morning.
There is a strong correlation between fluoride excretion and fluoride intake. Zohoori et al. (2006), cited a correlation of 0.83 [11]. They also indicated that some 43% of the fluoride intake is retained, i.e., not excreted. Almost all excretion is in urine. On the basis that between 1/3rd and 1/2th the fluoride intake is excreted in urine, fluoride intake of the children in the present study would be between 0.4 to 0.6 mgF/day and 0.012 to 0.018 mgF/kg bw/day.
There are three main sources of fluoride for daily intake. These are water, diet (foods and beverages), and toothpaste. A recent US EPA report on a relative source contribution analysis for fluoride provides some background [15]. Fluoride intake among children is dominated by water (if the water is fluoridated) with the percentage varying from a high of 70% in the first year of life to 50-60 % across the ages to 11 years of age. Diet supplies between 33 and 44% of fluoride intake, being higher in older children. Toothpaste is the source of approximately 20%, but this reflects once a day brushing.
Current daily fluoride intake for children in Qatar would have little intake from water as both tap and most bottled waters drunk have negligible fluoride. Fluoride from diet in Qatar maybe low as some produce may be grown in low fluoride water supply environments and foods cooked in the home are cooked in water with no fluoride. Not all children brush at least once a day with a fluoridated toothpaste Nearly 30% of Qatari 6– 15-year-old children report that they brushed less than or equal to once a day [16].
Most recommendations on an Adequate Intake of fluoride have been based on work by the Institute of Medicine in the USA published in 1997 [17]. The IOM established an Adequate Intake of fluoride as 0.05 mgF/kgbw/day. This is basically the fluoride intake expected when a child lives in an area with a water supply at 1.0 mgF/L in a temperate climate. More recent estimates for an Adequate Intake have also settled on 0.05 mgF/kgbw/day for children of early school age [18,19]. The fluoride excretion of Qatari children of 0.006 mgF/kg bw/day was very low. Daily fluoride intake might be predicted to be between 0.012 to 0.018 mgF/kg bw/day, well below the above levels for an Adequate Intake.
Elsewhere in oral health research levels of 0.05-0.07 mgF/kg bw/day have been suggested as a lower and upper bound of an optimal intake [20,21]. This leaves considerable scope for Qatar to consider increasing children’s exposure to fluoride for the prevention of caries in children.
This could come about from the promotion of an earlier start and more frequent tooth brushing with fluoridated toothpaste. Such an approach requires community wide behavioural change which is generally slow and difficult. Qatar could also pursue a fluoridation program, either of tap water and/or bottle/packaged waters. Such approaches could be for the whole community or targeted to a particular age such as school children. These approaches are synergistic. Both need to be positioned within an overall policy on the safe and effective use of fluorides and preventive strategies for dental caries.
CONCLUSION
The fluoride excretion of Qatari children of 0.006 mgF/kg bw/day was very low. This leaves considerable scope for Qatar to consider increasing children’s exposure to fluoride for the prevention of caries in children.
ACKNOWLEDGEMENTS
We would first like to thank all the parents and children for their cooperation and support. Special thanks to The Ministry of Public Health and The Ministry of Education and Higher Education for paving the way for our national survey. We especially want to acknowledge all the school principals’ work in the public and private sectors; nurses who participated in the national survey and gave many hours of their time communicating and assisting the survey team. We would also like to thank Dr. Michal Kulinski for his support and Molecular Pthophysiology laboratory, Translational Research Institute, for carrying out fluoride analysis. Finally, I would also like to thank Dr. Hala Al Qatati at the Ministry of Public Health, Dr. Najat AlYafei and Dr. Musab Al-Fadny at the Primary Healthcare Corporation, who played a vital role in the sample and data collection throughout the fieldwork. Our sincere thanks go to Ms. Nabyha Al Hamadi for her commitment, Sincerity and hard work even after the official working hours.
REFERENCES
- Supreme Council of Health. National Oral Health Survey 2011; the oral health status of children and adolescents in Qatar. A report prepared by the WHO Collaborating Centre for Community Oral Health Programs and Research, University of Copenhagen. Doha; Supreme Council of Health, no date. 2018.
- Australian Research Centre for Population Oral Health, The University of Adelaide. Qatar Child Oral Health Survey – 2017. Final report. Adelaide: ARCPOH, The University of Adelaide, 2018.
- Al-Darwish M, El Ansari W, Bener A. Prevalence of dental caries among 12– 14-year-old children in Qatar. Saudi Dent J. 2014; 26: 115-125.
- National Oral Health Committee, Ministry of Public Health. Qatar National Oral Health; A Road Map. Improved oral health and enhanced dental care in Qatar, 2014– 2020. Doha: National Oral Health Committee, 2017.
- Abdul Rahman Al Naamaa. Overview on Kahramaa drinking water quality requirements. Doha; Kahramaa. 2014.
- Spencer AJ. Water fluoridation for Qatar: a population - level public health measure to reduce dental caries in children and adolescents in Qatar. Adelaide: The University of Adelaide. 2016.
- Khalid A. The presence of dental fluorosis in the permanent dentition in Doha. East Mediterranean Health J. 2004; 10: 425-428.
- Marthaler TM (ed), WHO, Oral Health Programme. Monitoring of renal fluoride excretion in community preventive programmes on oral health. WHO/NCS/OHR/99.1. Geneva: WHO. 1999.
- WHO. Basic methods for assessment of renal fluoride excretion in community prevention programmes for oral health. Geneva: WHO. 2014.
- Rugg-Gunn AJ, Villa AE, Buzalaf MR. Contemporary biological markers of exposure to fluoride. Monogr Oral Sci. 2011; 22: 37-51.
- Zohoori FV, Swinbank CM, Maguire A, Moynihan PJ. Is the fluoride / creatinine ratio of spot urine sample indictive of 24-h urinary fluoride. Community Dent Oral Epidemiol. 2006; 34; 130-138.
- Fossati P, Prencipe L, Berti G. Enzymic creatinine assay: a new colorimetric method based on hydrogen peroxide measurement. Clin Chem. 1983; 29: 1494-1496.
- Remer T, Neubert A, Maser-Gluth C. Anthropometry-based reference values for 24- h urinary creatinine excretion during growth and their use in endocrine and nutritional research. Am J Clin Nutr. 2002; 75: 561-569.
- Akpata ES, Behbehani J, Akbar J, Thalib L, Mojiminiyi O. Fluoride intake from fluids and urinary excretion by young children in Kuwait: a non-fluoridated community. Community Dent Oral Epidemiol. 2014; 42: 224-233.
- US Environmental Protection Agency (EPA). Fluoride: exposure and relative source contribution analysis. Washington, DC: US EPA. 2010; 98-99.
- Bener AA, Al-Darwish MS, Tewfik I, Hoffmann JF. The impact of dietary and lifestyle factors on the risk of dental caries among children in Qatar. J Egypt Public Health Assoc. 2013; 85: 67-73.
- Institute of Medicine (IOM). Dietary reference intakes for calcium, phosphorus, magnesium, vitamin D and fluoride, Food and Nutrition Board, IOM. Washington, DC, USA: National Academy Press. 1997; 288-313.
- US Environmental Protection Agency (EPA). Fluoride: Dose-response analysis for non-cancer effects. Washington, DC: Office of Water, Health and Ecological Criteria Division, EPA. 2010.
- Australian Government Department of Health and the New Zealand Ministry of Health. Australian and New Zealand Nutrient Reference Values for Fluoride. Canberra: Department of Health, Commonwealth of Australia. 2017.
- Villa A, Anabalon M, Zohoori V, Maguire A, Franco AM, Rugg-Gunn A. Relationships between fluoride intake, urinary fluoride excretion and fluoride retention in children and adults: An analysis of available data. Caries Res. 2010; 44: 60-68.
- Zohoori FV, Maguire A. Determining an upper reference value for the urinary fluoride -creatinine ration in healthy younger children than 7 years old. Caries Res. 2017; 51: 283-289.


