Correlation of Blend Sign with Risk Factors of Intra-Cerebral Hemorrhage
- 1. Department of Radio-Diagnosis and Nuclear Medicine, First Hospital of Dalian Medical University, China
Abstract
Intra-cerebral hemorrhage is one of the most disabling forms of stroke even though it accounts for only 15% of all strokes
Citation
Brayin Pokkantakath RR, Padikkalakandy Cheriyath SS (2022) Correlation of Blend Sign with Risk Factors of Intra-Cerebral Hemorrhage. Ann Vasc Med Res 9(1): 1180.
BACKGROUND
Intra-cerebral hemorrhage is one of the most disabling forms of stroke even though it accounts for only 15% of all strokes [1,2]. According to researches and reports, only 20 % gain functional independence while 33% patients with intracerebral hemorrhage do not survive [3]. Thus new modalities of investigation for medical and surgical interventions have to be studied and implemented upon to prevent high rate of morbidity and mortality.
In this study we tried to evaluate the correlation of Blend signwith the risk factors of ICH. Blend sign is a novel predictor of early hematoma growth. Early hematoma growth indirectly relates to poor functional outcome. In non-enhanced cranial CT the blend sign is defined as blending of a hypo-attenuating area and a hyper-attenuating region with a well-defined margin [1]. The course of time of the bleeding directly influences the CT attenuation of blood. The individual components of the hematoma especially the hemoglobin is the most important factor determining CT attenuation. The hyperattenuation area of hematoma shows that the blood is clotted and a hypoattenuation non-enhanced CT image reveals actively bleeding hematoma. Thus, as rightly proved by a study by Qi Li et al. [1], blend sign occurs because of presence of primary active bleeding and secondary liquid blood.
The relationship of blend sign with the various risk factors of intra-cerebral hemorrhage will provide us with an early understanding of which patients having these risk factors are more likely to show blend sign and thus indirectly be more responsive of early hematoma growth which leads to increased morbidity and mortality.
The researches on various factors directly or inversely related to ICH have provided us with some fruitful facts listed as follows:
1} Age shows linear relationship with ICH proved by various studies conducted earlier [4,5]
2}80% of primary hemorrhages are caused by hypertensive arteriosclerosis and cerebral amyloid angiopathy (CAA) [6]. Hypertension shows direct association with ICH [7].
3} Positive evidences support acutely elevated, predominantly stress-related hyperglycemia is associated with poor outcomes such as dependent state or intra-cerebral hemorrhage [8]. While some reports conducted in china show diabetes as a poor predictor of worse outcome in ICH [9].
4} Potential factors related to ICH growth included body weight or body mass index, prior anti-platelet use, elevated glucose, serum cholesterol, and serum creatinine [10].
5} High cholesterol is associated with a lower risk of ICH [11]. Total cholesterol level and LDL is inversely associated with risk of hemorrhagic stroke. High-density lipoprotein cholesterol level seems to be positively associated with risk of intra-cerebral hemorrhage.
6} A study of large cohort of elderly men and women revealed low triglycerides levels associated with an increased risk of hemorrhagic stroke and a decreased risk of ischemic vascular events. In men, in subjects with high blood pressure and in those with low cholesterol levels, association between triglycerides and hemorrhagic stroke was particularly strong [12].
7} Total plasma homocysteine correlates with both ischemic and hemorrhagic stroke, suggesting direct relationship between homocysteine levels and ICH [13].
8} The strongest predictor of outcome in intra-cerebral hemorrhage (ICH) is most arguably hematoma volume [14,15].
8} Enlarged perivascular spaces (EPVS) are an important neuroimaging marker of small vessel disease like CAA which is an important cause of spontaneous ICH [16].
9} Lacunar stroke (LS) and intra-cerebral hemorrhage (ICH) are two diverse manifestations of small vessel disease. LS and ICH are related and share hypertension, as a common risk factor [17,18].
10} Leuakariosis also has direct relation with ICH and leads to poor outcome [19,20].
Based on these reports above, we have tried to study blend sign and investigate the role it plays in ICH risk factors such as age, gender, hypertension, systolic blood pressure, diastolic blood pressure, diabetes, hba1c, fasting blood glucose, total cholesterol, high density lipoprotein, low density lipoprotein, homocysteine, volume, enlarged perivascular spaces, lacunar infarction and leukariosis.
MATERIALS AND METHODS
A retrospective study was carried out at the First affiliated hospital of DMU. A Non-contrast CT study of ICH cases dated from September 2015 to November 2016. A total of 100 ICH cases were taken.
Firstly, presence and absence of blend sign were evaluated on non-contrast CT on the basis of blending of hypo-attenuating and hyper-attenuating areas with a well-defined margin and blend-sign mimic cases were neglected.
| Anatomical area | Rating | Description |
|---|---|---|
| Basal ganglia and centrum semiovale | 0 | 0 (No EPVS) |
| 1 | 1-10 (Mild EPVS) | |
| 2 | 11-20 (moderate EPVS) | |
| 3 | 20-40 (frequent EPVS) | |
| 4 | Greater than 40 (Severe EPVS) |
The ICH volumes of all these cases were then measured using ADW 4.4. Workstation and recorded. The volume value of all the slices containing ICH in each case were added, then they were multiplied by the slice thickness (4.5mm-6mm) and the final results were reported (volume per slice was taken by measuring the length and breadth of the haemorrhage). ICH hematoma volume was measured on the head CT scanin accordance with the ABC/2 method, in which A is the greatest diameter on the largest hemorrhage slice, B is the diameter perpendicular to A, and C is the approximate number of axial slices with hemorrhage multiplied by the slice thickness [21].
Table 1 For EPVS rating, there are three primary areas to be considered: basal ganglia, centrum semiovale and midbrain. In our study here, Centrum Semi ovale is considered.
EPVS are seen in the centrum semiovale along the paths of the perforating medullary arteries as they enter the cortical gray matter over the high convexities and extend into the white matter
Leukariosis was also graded using ‘TheFazeka scale’ method [22] (grade0=absent, grade 1= “caps” or pencil-thin lining, grade 2 = smooth “halo”, grade 3 = irregular periventricular signal extending into the deep white matter)
The various scale methods used for grading leukariosis severity are as follows:
1) van Swieten scale is simple and divide the appearances into only two grades of severity
2) Fazekas scale is more complex and discriminates “punctate”, “early confluent” and “confluent” white matter lesions
3) Sheltens scale adopts a 0-6 scale in multiple anatomical regions (including periventricular and nonperiventricular white matter lesions - WML; periventricular hyperintensities are further separated into frontal, occipital, and lateral aspects) (O’ Sullivan, 2008; Scheltens et al., 1993, as cited by Bohnen et al., 2009).
4) Other rating scales of WML are the Brant-Zawadzki Scale and the Cardiovascular Health Study Scale both of which place relatively more emphasis on periventricular WML (Bohnen et al., 2009).
Presence and absence of lacunar infarction were denoted as well.
The locations of ICH were divided into the following categories: putamen, midbrain, occipital lobe, thalamus, basal ganglia, temporal lobe, frontal-lobe, parietal lobe, fronto-parietal lobe, fronto-temporal lobe, temporo-parietal lobe, parieto-occipital lobe, cerebellar hemisphere, hippocampus and cerebral hemisphere and number of cases in each category were reported.
Clinical data such as age, time from onset of hemorrhage, history of hypertension, diabetes, LDL, HDL, total cholesterol, triglycerides, HbA1c, homocysteine and systolic and diastolic blood pressure levels were reported from the patient files.
Out of these 100 cases, 14 cases were excluded as they did not have the required data of the following parameters: hypertension, diabetes, homocysteine, triglycerides, total cholesterol, HbA1c, High-density lipo-protein (HDL), low-density lipoprotein (LDL) and fasting blood glucose.(FBG)
SPSS 20.0 was used to collect the statistical analysis of the collected data. Descriptive statistics were employed to describe the demographic variables. All the variables were checked for normality and age, systolic blood pressure, diastolic blood pressure and LDL showed parametric distribution while age, hbA1c, FBG, HDL, total cholesterol, triglycerides, homocysteine, time from onset of hemorrhage and ICH volume were of non-parametric distribution. A comparative study between blend sign and categorical data such as gender, hypertension, diabetes, EPVS, leukariosis, lacunar infarction and location were evaluated using cross tabs and chi-square tests. The comparison of two groups with and without blend sign with regards to numerical data such as age, systolic blood pressure, diastolic blood pressure, hbA1c, FBG, LDL, HDL, total cholesterol, triglycerides, homocysteine, time from onset of hemorrhage and ICH volume were evaluated using 2 independent (mann-whitney u) for non-parametric data and independent sample t- test for parametric distribution. A logistic regression test was carried out for all the data to derive association between these data and blend sign and to discuss their significant contribution to prediction. Bar chart and pie chart shown were statistically computed. A P value of less than 0.05 was considered statistically significant (Figure 1).
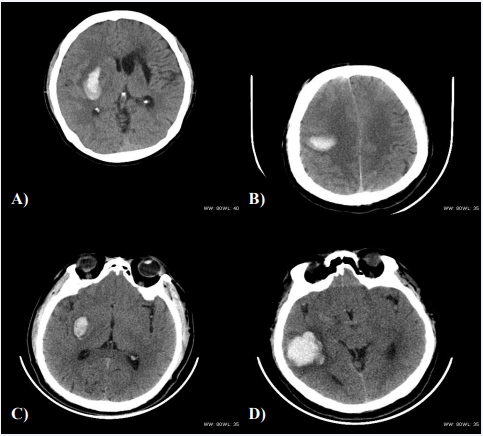
Figure 1: a) Axial CT scan of a 50 year old hypertensive female with positive blend sign in right basal ganglia
b) Axial CT scan of a 55 year old hypertensive male with positive blend sign in right basal ganglia
c) Axial CT scan of a 54year old hypertensive male with blend sign mimics in right basal ganglia
d) Axial CT of a 56 year old hypertensive and diabetic male with blend sign mimic in right temporal lobe
RESULTS
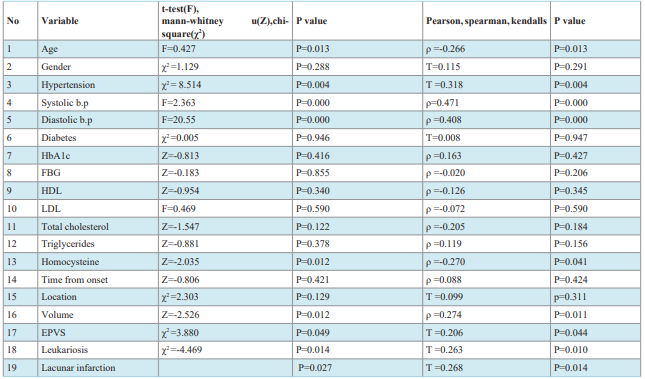
Comparison and correlation tests:
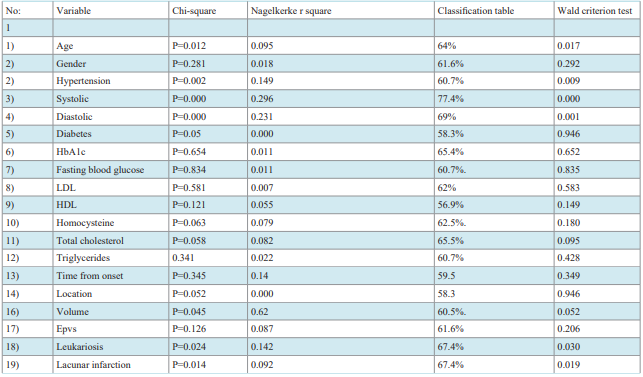
Logistic Regression Tests:
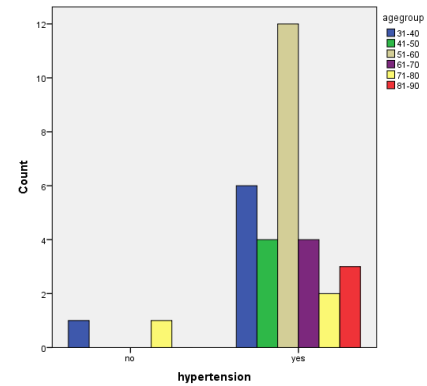
Bar chart describing percentage of hypertension present in different age groups for blend sign positive patients.
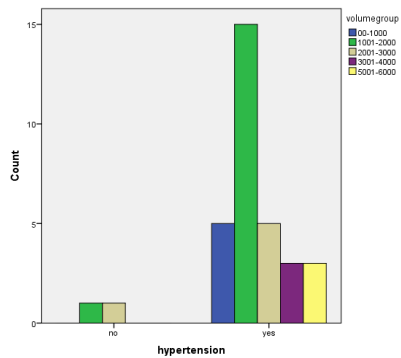
Bar chart describing percentage of hypertension present in different volume groups for blend sign positive patients only
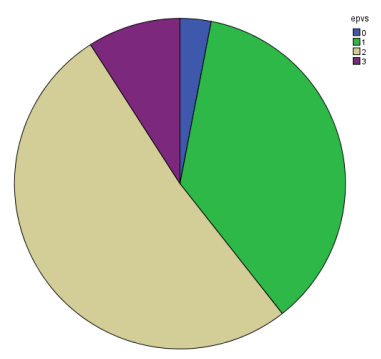
Pie-chart describing percentage of blend sign positive cases in each grade of EPVS..
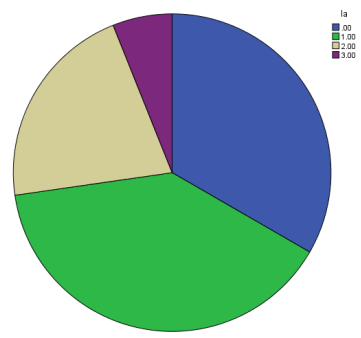
Pie-chart describing percentage of positive blend sign cases in each grade of leukariosis
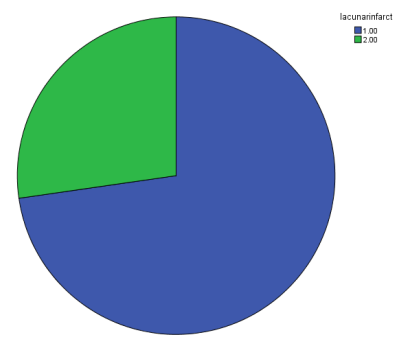
Pie-chart describing percentage of positive blend sign cases in negative and positive lacunar infarct cases. (1=positive and 2= negative for lacunar infarct)
DISCUSSION
Intracerebral hemorrhage is considered as one of the most devastating neurological disorders with limited advances in treatment and management. High associations with morbidity and mortality contribute it to being the least treatable form of stroke. And one of the representatives of poor functional outcome is early hematoma growth. Identification of potential and novel predictors for hematoma growth such as blend sign has helped us extensively in the early diagnosis and management [1].
Blend sign is defined as blending of a hypoattenuation area and a hyperattenuation region with a well-defined margin which reflects blood of different age. The course of time of the bleeding directly influences the CT attenuation of blood. The individual components of the hematoma especially the hemoglobin is the most important factor determining CT attenuation. The hyperattenuated area of hematoma shows that the blood is clotted and a hypoattenuated non-enhanced CT image reveals actively bleeding hematoma. Thus, as rightly proved in a study by Qi Li et al. [1], blend sign occurs because of presence of primary active bleeding and secondary liquid blood.
• correlation between age and blend sign:
The evidence of relation between ICH and age is proved by various researches such as the one titled ‘the role of age in ICH’ by Camacho E et al., in their study they concluded age as a strong risk factor as it also affects the cardiovascular and central nervous systems that is involved with the multiple risk factors for ICH3 . Treatment and future clinical trials can be guided by understanding the role of age in risk and outcomes of ICH. Thus, a possible early diagnosis and treatment of aged patients with blend sign due to a distinct correlation between blend sign and age as proved in this study will prevent increased fatal possibilities.
• correlation between hypertension and blend sign [4]
From our study, we have come across results showing strong relationship between hypertension, systolic, diastolic blood pressure and blend sign. Further, it proves significant difference between positive and negative blend sign with and without hypertension. This can be explained with the fact that hypertension is a great risk factor for ICH and early hematomas and lowering blood pressure treatments tremendously reduces hematoma growth in ICH [6,7]. Thus, blend sign being a positive predictor of hematoma growth shows evidence of correlation with hypertension, systolic b.p and diastolic b.p.
• correlation between diabetes and blend sign :
Facts that earlier established diabetes as a poor predictor of worse outcome in ICH by previous studies like the one written by Wang Q et al., In their study they highlighted that diabetes was not an independent predictor of mortality and patients with and without diabetes shared similar functional outcome in the follow-up. Similarly so, our study too reveals no correlation between blend sign,
(a novel imaging marker of early hematoma growth which is a predictor of ICH outcome) and diabetes. But some other reports are contradictory too that show some direct associations between diabetes and ICH like the one titled ‘hyperglycemia in acute stroke [8,9].
• correlation between cholesterol and blend sign :
Total Cholesterol, LDL have shown inverse relationship as expected with blend sign since previous reports conducted by other groups have shown indirect relationship between total cholesterol, LDL and blend sign [11] but HDL in this study shows negative correlation as opposed to studies showing positive association [11].
• correlation between triglycerides and blend sign:
Some authors found that higher levels of triglycerides correlate with higher risk for ICH and some consider low triglyceride values associated with an increased risk of ICH and this could be due to the reason that the pathophysiological mechanism underlying hypercholesterolemia and ICH is probably different from that of hypocholesterolemia and ICH as assumed by Woo et al., Studies by Bonaventure et al., and Psaty et al., show an inverse relationship between triglyceride concentrations and hemorrhagic stroke. The reason being that stroke is a heterogeneous condition; it is possible that plasma triglyceride concentrations correlate differently to various subtypes. According to our study, we demonstrated inverse relationship between blend sign and triglyceride levels as expected in accordance with similar results obtained by Audrey Bonaventure et al [12].
• Correlation between homocysteine and blend sign.
Elevated homocysteine levels too have a role to play in the outcome of ICH as described by the article written by Zhaohui Li et al wherein it suggested potential initiation of homcysteinelowering therapy as total plasma homocysteine levels showed significant correlation with both ischemic and hemorrhagic stroke [13]. This implies that blend sign too correlates with elevated homocysteine levels as displayed by our study
• Hematoma volume is the strongest predictor of outcome in intracerebral hemorrhage (ICH) [14] In turn, Hematoma volume at presentation is associated with hematoma expansion, another important determinant of poor outcome in this condition [15], and thus it rightly explains why blend sign is correlated with intracerebral hemorrhage volume in our study.
• Correlation between EPVS and blend sign :
The article titled ‘Enlarged perivascular spaces as a marker of underlying arteriopathy in intracerebral haemorrhage’ describes Perivascular spaces (also known as Virchow–Robin spaces) in detail. EPVS are interstitial fluid-filled cavities surrounding the small penetrating vessels. They function as the brain drainage system and have proved as a potential neuroimaging marker of small vessel disease [16]. EPVS are visible as well circumscribed fluid density spaces with no enhancement and calcification on CT and small, high-signal areas in the basal ganglia and centrum semiovale on T2-weighted cerebral MRI. In this article written by Andreas Charimidou et al., severe centrum semiovale EPVS was indicative of CAA proving as a new neuroimaging marker and basal ganglia EPVS severity was indicative of hypertensive arteriopathy. Both CAA and hypertensive arteriopathy are important causes of spontaneous ICH. And blend sign is a marker of early hematoma growth. Thus, correlation between blend sign and EPVS is well established in our study in accordance to this explanation.
Correlation between lacunar infarction and blend sign
Significant relation between lacunar infarction and blend sign and evidence based difference between blend sign groups with regards to lacunar infarction is basically because both ICH and lacunar infarction are commonly sharing hypertension as its risk factor [17].In 5–20% of cases with lacunar syndromes are mainly due to small intracerebral hemorrhages or largenon-lacunar ischemic brain infarctions [18].
Thus, blend sign being related to hypertension becomes well related to lacunar infacrtion as well.
• Correlation between leukariosis and blend sign :
Relation between blend sign and leukariosis is proved significant with comparison between groups and is explained by the facts of worse outcomes after spontaneous intracerebral hemorrhage in presence of leukariosis [19,20].
The importance of my study is explained by the above results. It gives us a detailed description of correlation of blend sign with the risk factors of ICH. With the help of these results, it will be easier to conclude that blend sign positive cases of patients with increased age, ICH volume and blood pressure are at a higher risk of hematoma growth, subsequently poor functional outcome. Also, co-occurrence of EPVS, leukariosis and lacunar infraction increases a potential fatal result.
CONCLUSION
1) The study reveals that there is significant difference between the positive and negative blend sign groups regards to age, hypertension, systolic blood pressure, diastolic blood pressure, homocysteine, volume, epvs, leuakariosis and lacunar infarction.
2) It is concluded that there is significant correlation between blend sign and age, hypertension, systolic and diastolic blood pressure, homocysteine, volume, epvs, leukariosis and lacunar infarction.
3) Age, hypertensioin, systolic and diastolic b.p., leukariosis and lacunar infarction have significant contributions to prediction.
4) Blend sign (a novel predictor of early hematoma growth that has poor functional outcome) when related to these factors as proved from this study helps us to infer that aged patients with hypertension, epvs, lacunar infarction, leuakriosis& increased homocysteine levels suffering from ICH are more vulnerable to poor outcome of ICH and therefore, they need to be treated with immediate medical attention and treatment plans to prevent fatal results.
REFERENCES
8. Perttu J. Lindsberg, Risto O. Roine. Hyperglycemia in Acute Stroke. Stroke. 2004; 35: 363–364.
16. Andreas Charidimou, Rukshan Meegahage, Zoe Fox, Andre Peeters, YvesVandermeeren, Patrice Laloux, et al. Enlarged perivascular spaces as a marker of underlying arteriopathy in intracerebralhaemorrhage: a multicentre MRI cohort study. J Neurol Neurosurg Psychiatry. 2013; 84: 624-9.
22. Frank Gaillard. Fazekas scale for white matter lesions. 2020.


