Increased QRS Complex Voltage or ECG Signs of Left Ventricular Hypertrophy in Acute Myocardial Ischemia
- 1. International Laser Center CVTI, Ilkovicova 3, 84104 Bratislava, Slovak Republic
Abstract
ECG criteria for left ventricular hypertrophy and ECG criteria for acute ischemia/ myocardial infarction represent two distinct categories. ECG signs of left ventricular hypertrophy (ECG-LVH) are based on so-called voltage criteria, i.e. the increased amplitude of QRS complex. On the other hand, the standard ECG diagnosis of MI is based on the presence of pathological Q waves and ST segment deviations and additionally on the so-called STEMI equivalents. However, animal, as well as clinical studies bring evidence on the occurrence of the increased QRS voltage /ECG-LVH signs in acute ischemia. This paper is focused on the pathophysiological mechanisms that are common for both hypertrophied and ischemic myocardium and thus can lead to identical QRS patterns. Recognizing the underlying mechanisms of the ECG-LVH patterns in myocardial ischemia has a strong clinical implication. The ECG-LVH signs/ the increased QRS voltage need to be recognized as a predictive electrophysiological marker independent of LV anatomy. Its misinterpretation in patients with acute coronary syndrome can lead to reperfusion delays and worst outcomes.
Citation
Bacharova L (2022) Increased QRS Complex Voltage/ ECG Signs of Left Ventricular Hypertrophy in Acute Myocardial Ischemia. Ann Vasc Med Res 9(3): 1151.
INTRODUCTION
Electrocardiography (ECG) is the basic initial noninvasive test for diagnosing acute myocardial ischemia and myocardial infarction (MI). The recognition of the ECG manifestation of acute myocardial ischemia is of an utmost clinical importance, since it usually determines the subsequent diagnostic and therapeutic interventions. The basic standard ECG diagnosis of MI is based on the presence of ST segment deviations and pathological Q waves. Regarding the QRS complex evaluation, it includes also the poor progression of R wave in leads V2-V4, absence R wave V1-V2, or tall R waves V1-V4 [1,2]. However, it is documented that a relatively high proportion of patients with acute MI / coronary syndrome that should be justified for a rapid coronary intervention are not recognized using current strict ECG criteria [3-5]. Additional “STEMI equivalents” have been therefore identified, such as Wellens’ syndrome, de Winter sign, hyperacute T waves, left bundle branch block-including paced rhythm-and right bundle branch block [6,7]. This paper is focused on another QRS pattern, which represents a different ECG diagnostic category - the increased QRS voltage consistent with ECG criteria for left ventricular hypertrophy (ECG-LVH criteria). The increased QRS voltage in acute ischemia has been documented in both animals, as well as in clinical studies [8-11]. The increased QRS complex voltage/ ECG-LVH are here discussed as a possible manifestation of acute myocardial ischemia.
ECG signs of left ventricular hypertrophy
At first, I need to express clearly my position in the ECG-LVH diagnosis. The classical diagnosis of ECG-LVH is based on the increased QRS voltage and postulates that bigger / hypertrophied left ventricle producing a stronger electric field is associated with the increased QRS voltage. However, it has been repeatedly documented that the sensitivity of ECG-LVH criteria is very low; it means in other words that the association between increased QRS voltage and the increased LV mass is poor [12]. Also, it has been shown that the increased QRS voltage is a significant independent cardiovascular risk factor, i.e. independent on the increased left ventricular mass [13,14]. It is generally assumed that ECG-LVH criteria have high specificity and really, a number of papers document their high specificity. However, the systematic review published in 2007 showed that the specificity is actually ranging from 53 to 100 %12. It means that the increased QRS voltage is also seen in other cardiac pathology. It is thus obvious that the increased QRS voltage reflects a cardiac pathology, not necessarily associated with the increased LV mass. The suggested shift in paradigm of ECH-LVH defines the altered electrical properties of myocardium as the major determinant of the increased QRS voltage [15].
Experimental acute ischemia – animal studies
Holland and Brooks [16] documented the effect of acute ischemia on the QRS complex changes in a porcine model of myocardial infarction. During the initial phase of ischemia they observed a transient decrease in the R wave voltage, followed by marked increase in R wave voltage associated with marked decrease in conduction time indicating a decrease in conduction velocity. Similar synchronous biphasic association between ventricular activation pattens and R wave changes were found also in a canine model of myocardial ischemia [17], these changes in QRS amplitude were not related to ventricular dimensions. They concluded that in acute ischemia, the major factor affecting the QRS voltage is the ventricular activation time rather than the changes in ventricular dimensions. It was also shown that this increase in the R wave amplitude is predictive of malignant ventricular arrhythmias [8]. Barnhill et al. [18], compared the QRS amplitude changes during transient myocardial ischemia in patients with variant angina pectoris and in a canine preparation. The QRS complex changes in the dog preparation were practically identical to those in the patients and strongly correlated with a decrease in myocardial conduction velocity. They attributed the QRS changes during variant angina to the altered excitation pattern due to conduction delay in the ischemic zone.
Acute ischemia: stress test
The increased QRS amplitude has been observed in patients with coronary artery disease during the stress test. Bonoris et al. 1978 [19], showed that considering the increase in R wave additionally to the ST segment depression during the stress test the sensitivity and specificity of stress testing can be significantly improved. Similarly, Christison et al. [20], considered no change or an increase in R-wave amplitude during the stress test as a more reliable indicator of coronary artery disease than ST segment changes. The increased R wave / QRS voltage was described as additional useful information in patients with coronary artery disease [21,22]. Based on the exercise-induced changes in QRS amplitude the Athens score was developed for the diagnosis and assessment of severity of coronary artery disease [22-24]. It has been suggested that these exercise-induced QRS changes reflected in the Athens QRS score are related to exerciseinduced myocardial ischemia. It has been also discussed that the R wave increase during exercise is associated with an increase in the chamber size in patients with coronary artery disease, i.e. to the “Brody effect”. However, it was found in animal, as well as in human studies that the changes in the R wave amplitude do not correlate with the LV volume changes [17,25].
On the other hand, there are also opposite views. Van Tellingen et al. [26], did not find the combined interpretation of ST segment and R wave very efficient although useful. The association between ischemic episodes and often noted R wave amplitude changes during exercise was questioned also by [27,28]. In spite of controversial findings, the increased QRS voltage is frequently observed in patients with CAD during exercise, and cannot be ignored.
Clinical setting
Transient ECG-LVH signs are also observed in patients admitted to the emergency department [9]. Giant R wave have been repeatedly described in unstable angina and acute myocardial infarction [18,29-33].
These findings were not stable during serial measurement and did not correlate with anatomical LVH, and were earmarked as confounding [11]. However, if the increased voltage is not related to the anatomical LVH, and although it appears transiently in the acute phase, another explanation is needed in patients with acute coronary syndrome. It needs to be also stressed that ECG-LVH signs in patients with symptoms suggesting acute cardiac ischemia is a serious finding regarding the short-term mortality. As well, these patients were more likely having additional cardiac conditions associated with myocardial ischemia, such as congestive heart failure and hypertensive heart disease [10,34].
Screening, general population
In this context it is necessary to mention that it has been well-known for years that ECG-LVH is associated with significant cardiac morbidity and mortality, as has been well documented repeatedly [13,14,35-40]. It is listed as the “target organ damage” in hypertension guidelines [41,42]. The importance of the ECG-LVH was stressed already in 1991 by Kannel [13]:“ECGLVH was associated with a 3-15-fold increase of cardiovascular events with greatest risk ratios for cardiac failure and stroke. No other risk factor approaches LVH in potency”. It is therefore not comprehensible why this potent CV risk factor is not included into CV risk scores, even not in the Framingham score [43-45]. Summarizing, the ECG-LVH / increased QRS voltage reflects a cardiac pathology, sometimes transient, not necessarily associated with the increased LV mass, and it is an ominous sign.
Electrophysiological characteristics of ischemic myocardium
Ischemia influences electrophysiological properties of myocardium remarkably. The alterations in conduction velocity are studied extensively especially in relation to arrhythmias, however, they naturally alter the sequence of impulse propagation in ventricles as well, and consequently the QRS complex pattern.
Cardiomyocytes
The extreme ischemic damage of cardiomyocytes leads to necrosis. But, also the cardiomyocytes in surviving tissue are considerable affected. The ischemic alteration includes reduction of the number of gap junctions and their distribution, as well as reduced connexin43 level and expression [46,47]. The cardiomyocytes at the border of healed infarcts differ significantly in the number of gap junctions and their distribution compared to the healthy tissue [48,49]. And even the myocardium distant from infarction in patients with ischemic heart disease has a 47% reduction in gap junction surface area per unit cell volume, and a 30% reduction per cell [46]. Following the myocardial infarction the volume fraction of fibroblasts in myocardium adjacent to the infarcted area increases, and the myocyte volume fraction decreases [49]. Fibroblasts transformed to myofibroblasts also express connexins43 and thus can facilitate heterocellular electrical coupling between myocytes and fibroblasts [50,51].
Fibrosis
An integral part of ischemic rebuilding of myocardium is fibrosis. It could be a diffuse process, or can create localized fibrous tissue depositions, including post-infarction scars [52]. It affects considerably the electrical connection between cardiomyocytes as well as the electrical impulse propagation, these phenomena being extensively described and studied in relation to ventricular arrhythmias, as factors creating substrate for triggering and maintaining ventricular arrhythmia [53]. However, the underlaying structural and electrophysiological changes of myocardium during acute/ chronic ischemia alter significantly the impulse propagation and consequently affect the QRS complex pattern as well.
Simulations
The effect of the diffuse activation slowing in left ventricle, as well as localized conduction velocity slowing was studied using a computer simulation [54,55]. It was shown that the diffuse slowing in conduction velocity in the left ventricle results in the increase in the QRS complex amplitude, consistent with the ECGLVH criteria [54] and that the slowed conduction velocity is the major determinant of the increased QRS amplitude, and not the LV size. The combination of regional slowed conduction and areas of electrically inactive areas (as in the myocardial infarction) resulted in a range of QRS (and ST segment) changes including the increased QRS amplitude [55].
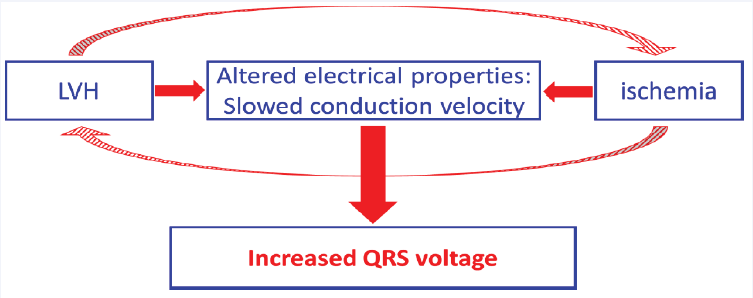
Figure 1: Both left ventricular hypertrophy (LVH) and ischemia alter electrical properties of ventricular myocardium and slow electrical impulse propagation. This can be the common underlying pathophysiological mechanism leading to the increased QRS complex voltage. Additionally, LVH and ischemia are interrelated, and can further enhance this phenomenon.
The standard pathophysiological interpretation of ECG findings in MI
The basic classical electrophysiological mechanisms considered in interpreting the ECG findings in MI include predominantly the ST segment deviations and pathological Q waves. The interpretation of the ST segment deviations in MI refers to the “injury current”, resulting from the voltage difference between the ischemic and non-ischemic myocardium during the resting and plateau phases of the ventricular action potential [56,57]. The pathological Q waves are basically interpreted as an absence of localized electrical activity that can be due to necrosis or a fibrotic scar. However, the whole spectrum of structural and functional/ electrophysiological changes due to acute / chronic ischemia is much more complex and complicated and this is somehow neglected in interpreting the QRS patterns, although these substantially more complicated processes are well-described and studied in details in relation to ventricular arrhythmias.
CONCLUSION
To summarize, the myocardial ischemia alters the structure and electrophysiological properties of myocardium considerably, changing the organization, distribution, and electrophysiological characteristics of cardiomyocytes, as well as of interstitium. Direct measurements, as well as computer simulations document conductivity alteration at cellular and tissue levels, results in altered electrical impulse propagation in the ventricles, subsequently modifying the sequence of depolarization that is reflected in the QRS patterns (Figure 1). Since the mental/ diagnostic association between ECG-LVH signs and LVH diagnosis is strong, the occurrence of ECG-LVH signs is sometimes misinterpreted as “confounding” since it does not reflect the size of the ventricles. However, there is strong evidence that the increased QRS voltage consistent with ECG-LVH criteria can reflect the altered sequence of ventricular depolarization due to ischemia [15]. The understanding of the effect of the disturbances due to ischemia on the electrical impulse propagation in ventricles and subsequently on the resultant QRS pattern has a strong clinical implication. The ECG-LVH signs/ the increased QRS voltage need to be recognized as a predictive electrophysiological marker independent of LV anatomy. Its misinterpretation in patients with acute coronary syndrome can lead to reperfusion delays and worst outcomes.
ACKNOWLEDGEMENT
This paper was partly supported by the grant of the Slovak Research Agency: VEGA 2/0109/22.


