Association of Triglyceride Glucose Index Combined with Obesity Indicators with Left Ventricular Mass Index in Hypertensive Chinese Adults
- *. These authors have contributed equally to this work and share the first authorship
- †. These authors have contributed equally to this work and share the last authorship
- 1. Department of Geriatrics, the Second Medical Centre & National Clinical Research Centre for Geriatric Diseases, Chinese PLA General Hospital, China
- 2. Medical School of Chinese PLA, China
- 3. Outpatient Department of the 51st Retired Cadre Rest Home, Haidian Garrison District, China
Abstract
The left ventricular hypertrophy index (LVMI) is a vital metric for assessing LVH, a major complication of hypertension. The triglyceride-glucose (TyG) index combined with obesity indicators is an emerging marker of insulin resistance (IR), positively associated with cardiovascular disease.In this cross-sectional analysis of 4,551 Chinese adults with hypertension, we evaluated associations between TyG-derived indices (TyG-WC, TyG-BMI, and TyG-WHtR) and LVMI using multivariable linear regression models adjusted for potential confounders, including age, sex, blood pressure, urea, among others. We performed subgroup analyses, incorporating interaction tests, to evaluate the stability of results across demographic and clinical strata.Significant positive associations were found between quartiles of TyG-BMI, TyG-WC, TyG-WHtR, and elevated LVMI. TyG-BMI showed the strongest dose-response relationship, with progressively increasing β coefficients (95% CI) across ascending quartiles (Q2: 3.163 [2.141–4.184], Q3: 4.754 [3.720–5.788], Q4: 8.055 [7.002–9.109]) compared to Q1. Subgroup analyses showed consistent trends (all interaction P-values >0.05), suggesting homogeneous associations across demographic and clinical subgroups. Our findings reveal robust associations between TyG-obesity indices (particularly TyG-BMI) and LVMI in hypertensive individuals with hypertension. The consistency of these associations across clinical subgroups highlights the potential of TyG-obesity indices as composite biomarkers for monitoring cardiac remodeling in hypertension management.
Keywords
• Triglyceride-glucose index
• Hypertension
• Left ventricular mass index
• Insulin resistance
Citation
Cao Q, Chen Y, Zhang N, Zeng B, Sun J, et al. (2026) Association of Triglyceride Glucose Index Combined with Obesity Indicators with Left Ventricular Mass Index in Hypertensive Chinese Adults. JSM Diabetol Manag 7(1): 1010.
INTRODUCTION
The triglyceride glucose (TyG) index has been proposed as a substitute index of insulin resistance (IR) [1-3]. This novel index is characterized by its simplicity and expeditious nature [4]. Epidemiological studies have consistently demonstrated that elevated TyG index is strongly associated with an increased risk of diabetes mellitus (DM) [5], arterial stiffness [6], metabolic syndrome [1], and major adverse cardiovascular events, including acute coronary syndrome [7] and stroke [8]. In addition, in comparison with a solitary TyG index, a composite of TyG index along with body mass index (BMI), waist circumference (WC), and waist-to-height ratio (WHtR) may offer superior evidence [9-11]. Left ventricular hypertrophy (LVH), characterized by thickened ventricular walls and increased myocardial mass, is a recognized precursor to heart failure [12,13]. LVH, strongly linked to hypertension as a target organ injury, is a direct manifestation of cardiac structural remodeling [14,15]. Furthermore, LVH is associated with stroke [16], coronary atherosclerotic heart disease [16], arrhythmia [15], and other diseases. Thus, early identification and screening for LVH is critical. IR has been reported to correlate with LVH [17]. Additionally, the measurement of left ventricular hypertrophy index (LVMI) is a vital metric for assessing LVH [18]. Considering that the relationship between TyG combined with obesity indicators and LVMI in hypertensive populations remains poorly understood. Therefore, this cross-sectional study sought to examine the association between TyG-obesity composite indices (BMI, WC, WHtR) and LVMI in Chinese adults with hypertension, adjusting for covariates including age, sex, SBP, DBP, LDL-C, Urea, DM, cardiovascular history, and stroke history.
METHODS
Study participants
This cross-sectional study was conducted in Xinyang County, Henan Province, China. We recruited participants from community-dwelling residents between 2004 and 2005 using a multi-stage cluster sampling strategy. A total of 13,444 individuals (5,270 males and 8,174 females) were initially enrolled, among whom 5,421 were identified with hypertension. Of the hypertensive cohort, 616 individuals were excluded due to incomplete echocardiographic data, followed by an additional 254 exclusions for missing blood biomarker data. A detailed participant selection flowchart is provided in Figure 1.

Figure 1 The flowchart of study population selection.
without heavy clothing and shoes, and waist circumference was measured immediately above the midpoint between the lower edge of the rib cage and the anterior superior iliac spine [19]. Our diagnosis of diabetes was based on an elevated fasting plasma glucose, prior clinical diagnosis, or current use of glucose-lowering agents. Stroke was determined by the results of a computed tomography scan combined with a previous hospital diagnosis. Coronary heart disease was diagnosed by a history of previous myocardial infarction or based on Computed Tomography Angiography results.
TyG index combined with obesity indicators and LVMI
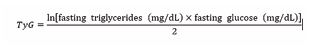
The triglyceride-glucose (TyG) index was calculated using the formula [2].
The TyG-BMI, TyG-WC, and TyG-WHtR were calculated by multiplying TyG by the respective indicator. All indices were categorized into quartiles for analysis. Echocardiographic measurements were performed according to American Society of Echocardiography (ASE) guidelines. Participants were positioned in the left lateral decubitus position with quiet breathing. Systolic and end-diastolic parameters were measured within three consecutive cardiac cycles. Examinations were conducted by two board-certified cardiac sonographers from Fuwai Hospital, with left ventricular mass index (LVMI) calculated using the validated formula:
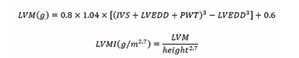
Where IVS is interventricular septal thickness, LVEDD is left ventricular end-diastolic diameter and PWT is posterior wall thickness.
Statistical analyses
All calculations and analyses in this study were performed using R (version 4.4.2). Continuous variables were presented as mean ± standard deviation (SD), and categorical variables as frequencies (percentages). Group comparisons were conducted using one-way ANOVA for continuous variables and chi-square tests for categorical variables. Moreover, we used univariable and multivariate linear regression to assess the relationship between TyG and its derivatives and LVMI, and regression coefficients (β) and confidence intervals (95% CI) were calculated. Model corrections were performed to minimize the effect of confounders. Model 1 is the unadjusted crude model. Model 2 adjusts for two variables: sex and age. Model 3 was adjusted by adding SBP, DBP, LDL-C, Urea, DM, cardiovascular history, and stroke history to Model 2. Subgroup analyses were performed across sex (male/ female), age groups (<65/≥65 years), and DM status (yes/ no), with interaction terms tested using likelihood ratio tests. All statistical tests were two-tailed, with p-values <0.05 considered significant.
RESULTS
Study population characteristics
The final cohort comprised 4,551 participants aged 27-99 years (mean ± SD: 58.12 ± 8.62; 33.6% males). Baseline characteristics stratified by TyG-BMI quartiles are presented in Table 1. Compared to the lowest quartile (Q1), participants in the highest TyG-BMI quartile (Q4) had significantly elevated SBP, DBP, BMI, weight, WC, HC, TG, TC, glucose, LDL-C, UA, DM prevalence, and CAD prevalence, alongside reduced HDL-C and urea. Additionally, echocardiographic parameters (IVS, LVEDD, PWT) also increased progressively with higher TyG-BMI categories. The aforementioned conclusions were largely consistent across TyG, TyG-BMI, TyG-WC, and TyG-WHtR. However, in the TyG-WC and TyG-WHtR models, urea showed only a downward tren, and in the TyG model, DBP exhibited only an upward trend. Detailed information is presented in Additional file Table S1-3.
Table 1: Characteristics of the population stratified by TyG-BMI quartiles.
|
Characteristics |
TyG-BMI index |
|
P value |
|||
|
Q1 |
Q2 |
Q3 |
Q4 |
overall |
||
|
Demographics |
|
|
|
|
|
|
|
Age (years) |
59.59 ±9.10 |
58.27 ±8.71 |
57.38 ±8.31 |
57.27 ±8.15 |
58.12 ±8.62 |
<0.001 |
|
Male(%) |
478 (42.0) |
380 (33.4) |
375 (33.0) |
298 (26.2) |
1531 (33.6) |
<0.001 |
|
Clinical Parameters |
|
|
|
|
|
|
|
SBP(mmHg) |
161.09 ±24.23 |
163.51 ±24.86 |
163.50 ±23.57 |
165.91 ±25.01 |
163.50 ±24.47 |
<0.001 |
|
DBP(mmHg) |
95.20 ±12.47 |
96.46 ±12.78 |
97.48 ±11.77 |
99.01 ±13.12 |
97.04 ±12.62 |
<0.001 |
|
BMI (kg/m2) |
21.93 ±1.78 |
24.98 ±1.38 |
27.19 ±1.53 |
30.83 ±7.27 |
26.23 ±5.06 |
<0.001 |
|
Height (cm) |
157.78 ±8.16 |
158.02 ±7.82 |
157.95 ±7.87 |
157.05 ±7.87 |
157.70 ±7.94 |
0.013 |
|
Weight (kg) |
54.75 ±7.17 |
62.57 ±7.36 |
68.02 ±7.76 |
76.16 ±20.47 |
65.37 ±14.40 |
<0.001 |
|
WC(cm) |
75.10 ±10.56 |
83.61 ±8.56 |
88.33 ±8.73 |
94.78 ±10.87 |
85.45 ±12.09 |
<0.001 |
|
HC(cm) |
89.85 ±10.30 |
96.87 ±7.95 |
100.37 ±8.45 |
105.90 ±10.21 |
98.25 ±10.96 |
<0.001 |
|
Blood biochemistry |
|
|
|
|
|
|
|
Triglyceride(mmol/L) |
1.03 ±0.42 |
1.38 ±0.62 |
1.74 ±0.85 |
2.57 ±1.88 |
1.68 ±1.24 |
<0.001 |
|
Cholesterol (mmol/L) |
5.22 ±0.96 |
5.46 ±1.05 |
5.61 ±1.12 |
5.84 ±1.16 |
5.53 ±1.10 |
<0.001 |
|
Glucose(mmol/L) |
5.18 ±1.07 |
5.34 ±1.21 |
5.61 ±1.60 |
6.14 ±2.40 |
5.57 ±1.69 |
<0.001 |
|
HDL-C (mmol/L) |
1.72 ±0.36 |
1.58 ±0.32 |
1.49 ±0.31 |
1.42 ±0.29 |
1.55 ±0.34 |
<0.001 |
|
LDL-C (mmol/L) |
2.83 ±0.74 |
3.15 ±0.83 |
3.27 ±0.89 |
3.35 ±0.87 |
3.15 ±0.86 |
<0.001 |
|
Creatinine(umol/L) |
68.79 ±35.35 |
65.96 ±22.84 |
66.57 ±24.62 |
63.67 ±17.74 |
66.25 ±26.00 |
<0.001 |
|
Urea (mmol/L) |
5.79 ±2.09 |
5.46 ±1.71 |
5.37 ±1.68 |
5.26 ±1.67 |
5.47 ±1.81 |
<0.001 |
|
Uric acid (umol/L) |
270.59 ±79.14 |
284.76 ±82.66 |
300.18 ±88.00 |
315.60 ±90.33 |
292.78 ±86.77 |
<0.001 |
|
Lifestyle |
|
|
|
|
|
|
|
Drinker(%) |
62 (5.5) |
49 (4.3) |
55 (4.9) |
45 (4.0) |
211 (4.7) |
0.198 |
|
Smoker(%) |
77 (6.8) |
61 (5.4) |
67 (5.9) |
47 (4.2) |
252 (5.6) |
<0.001 |
|
Anamnesis |
|
|
|
|
|
|
|
Diabetes(%) |
21 (1.9) |
45 (4.0) |
62 (5.5) |
91 (8.0) |
219 (4.8) |
<0.001 |
|
History of stroke(%) |
114 (10.2) |
112 (10.1) |
125 (11.2) |
116 (10.3) |
467 (10.4) |
0.048 |
|
History of CAD |
70 (6.2) |
105 (9.3) |
100 (8.8) |
140 (12.3) |
415 (9.1) |
<0.001 |
|
Echocardiographic data |
|
|
|
|
|
|
|
IVS(cm) |
0.96 ±0.16 |
0.99 ±0.16 |
1.01 ±0.15 |
1.03 ±0.15 |
1.00 ±0.16 |
<0.001 |
|
LVEDD(cm) |
4.45 ±0.52 |
4.54 ±0.50 |
4.57 ±0.51 |
4.65 ±0.50 |
4.55 ±0.51 |
<0.001 |
|
PWT(cm) |
0.95 ±0.14 |
0.97 ±0.14 |
0.97 ±0.13 |
0.99 ±0.13 |
0.97 ±0.14 |
<0.001 |
|
LVM(g) |
144.64 ±44.06 |
153.69 ±41.37 |
157.64 ±42.53 |
166.11 ±42.65 |
155.52 ±43.34 |
<0.001 |
|
LVMI(g/m2.7) |
42.21 ±12.27 |
44.72 ±11.69 |
45.86 ±11.60 |
49.26 ±12.64 |
45.51 ±12.32 |
<0.001 |
SBP systolic blood pressure, DBP diastolic blood pressure, BMI body mass index, WC waist circumference, HC hip circumference, HDL-C high-density lipoprotein cholesterol, LDL-C low-density lipoprotein cholesterol, CAD coronary artery disease, IVS interventricular septum, LVEDD left ventricular end-diastolic dimension, PWT posterior wall thickness, LVM left ventricular mass, LVMI left ventricular mass index.
composite indices and LVMI, we constructed univariable and multivariable linear regression models (Table 2). The results showed independent positive correlations between TyG-BMI, TyG-WC, TyG-WHtR, and LVMI in various models. Almost all results were significant (P 0.05, Figure 2, Additional file Figure S1-3). However, In the multivariate linear regression model for TyG, significant positive associations were observed for both the second (Q2: β = 1.433, P = 0.007) and fourth quartiles (Q4: β = 1.183, P = 0.033) compared to the reference first quartile (Q1). Although Q3 (β = 0.616, 95% CI: −0.451 1.683, P=0.257), did not reach statistical significance the positive β suggested a potential non-linear relationship that warrants further investigation in larger cohorts. In the crude model, compared to the lowest quartile (Q1), participants in the TyG-BMI Q4 group exhibited the largest increase in LVMI (β = 7.05, 95% CI: 6.06–8.04), while the TyG-WHtR Q4 group showed a slightly smaller increase (β = 6.02, 95% CI: 5.02–7.01). After adjusting for the relevant covariates, the largest increases in LVMI per one-unit increment were observed in TyG-BMI (β = 8.055, 95% CI: 7.002–9.109) and TyG-WHtR (β = 6.471, 95% CI: 5.393 7.548). In contrast, TyG (β = 1.183, 95% CI: 0.097–2.268) and TyG-WC (β = 4.831, 95% CI: 3.754–5.907) exhibited substantially smaller effects.
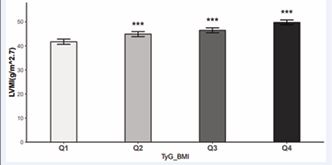
Figure 2 Comparison of the LVMI levels among the TyG-BMI index quartiles Statistical significance compared to the first quartile (Q1): *P < 0.05, **P < 0.01, ***P < 0.001.
Table 2: Linear regression analysis of TyG-related indices and LVMI.
|
|
Model 1 |
|
Model 2 |
|
Model 3 |
|
|
|
β(95%CI) |
P value |
β(95%CI) |
P value |
β(95%CI) |
P value |
|
TyG-BMI |
|
|
|
|
|
|
|
Q1 |
Reference |
|
Reference |
|
Reference |
|
|
Q2 |
2.505(1.514-3.496) |
<0.001 |
3.008(1.988-4.028) |
<0.001 |
3.163(2.141-4.184) |
<0.001 |
|
Q3 |
3.651(2.659-4.642) |
<0.001 |
4.387(3.364-5.410) |
<0.001 |
4.754(3.720-5.788) |
<0.001 |
|
Q4 |
7.048(6.057-8.039) |
<0.001 |
7.685(6.659-8.710) |
<0.001 |
8.055(7.002-9.109) |
<0.001 |
|
TyG-WC |
|
|
|
|
|
|
|
Q1 |
Reference |
|
Reference |
|
Reference |
|
|
Q2 |
1.294(0.288-2.300) |
0.012 |
1.761(0.721-2.802) |
0.001 |
2.008(0.970-3.047) |
<0.001 |
|
Q3 |
2.346(1.341-3.352) |
<0.001 |
2.684(1.647-3.721) |
<0.001 |
2.991(1.937-4.046) |
<0.001 |
|
Q4 |
3.956(2.950-4.962) |
<0.001 |
4.422(3.388-5.457) |
<0.001 |
4.831(3.754-5.907) |
<0.001 |
|
TyG-WHtR |
|
|
|
|
|
|
|
Q1 |
Reference |
|
Reference |
|
Reference |
|
|
Q2 |
1.583(0.586-2.579) |
0.002 |
1.823(0.790-2.856) |
0.001 |
2.127(1.098-3.157) |
<0.001 |
|
Q3 |
3.058(2.062-4.055) |
<0.001 |
3.304(2.273-4.335) |
<0.001 |
3.619(2.571-4.667) |
<0.001 |
|
Q4 |
6.018(5.022-7.014) |
<0.001 |
6.034(4.992-7.075) |
<0.001 |
6.471(5.393-7.548) |
<0.001 |
|
TyG |
|
|
|
|
|
|
|
Q1 |
Reference |
|
Reference |
|
Reference |
|
|
Q2 |
1.439(0.428-2.451) |
0.005 |
1.517(0.470-2.564) |
0.005 |
1.433(0.388-2.478) |
0.007 |
|
Q3 |
0.550(-0.462-1.562) |
0.287 |
0.572(-0.473-1.618) |
0.284 |
0.616(-0.451-1.683) |
0.257 |
|
Q4 |
1.167(0.156-2.179) |
0.024 |
1.352(0.310-2.395) |
0.011 |
1.183(0.097-2.268) |
0.033 |
CI confidence interval, WHtR waist-to-height ratio Model 1: crude model; Model 2: Adjusted for age and sex; Model 3: Adjusted for age, DM, sex, SBP, DBP, CAD, LDL-C, Urea, and the history of stroke.
Subgroup analyses for association between TyG index combined with obesity indicators and LVMI
We assessed the association between the TyG index combined with obesity indicators and LVMI by sex, age (≥65 and 65), and diabetes subgroups. After removing covariates associated with stratified variables from Model3, no significant changes were observed between LVMI and TyG correlation indices (TyG, TyG-WC, TyG-BMI, and TyG-WHtR) in any of the subgroup analyses, since no significant interaction was observed (P for interaction 0.05). In individuals aged ≥65 years or patients with diabetes mellitus, TyG indices showed a trend toward stronger associations with left ventricular mass index (LVMI) compared to non-eligible populations, though this difference did not reach statistical significance. Furthermore, subgroup analyses showed that even in the absence of diabetes mellitus, an elevated TYG-related index still represented a higher LVMI. Figure 3 illustrates subgroup analyses of TyG-BMI, with extended analyses for TyG-WHtR, TyG-WC, and TyG provided in the Additional file Figure S4-6.
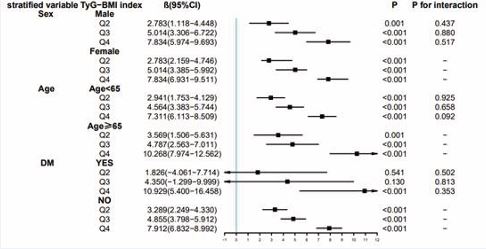
Figure 3 Subgroup analyses for the association between TyG-BMI categories and LVMI.
DISCUSSION
The findings of the present cross-sectional study in the Chinese hypertensive population demonstrated a significant positive correlation between the TyG index combined with obesity indicators and LVMI, except for the TyG index, which exhibited a non-significant Q3 (β:0.616, 95%CI:-0.451-1.683)correlation. Nevertheless, the findings of this study indicated that LVMI showed an upward trend in correlation with increasing quartiles of TyG and related indices. The correlation remains constant even after adjustment for age, sex, SBP, DBP, LDL-C, Urea, DM, CAD, and stroke history. Stratified analyses further confirmed that the positive correlations remained statistically significant in most subgroups. LVMI serves as a critical diagnostic marker for LVH, a major cardiovascular complication of hypertension. Elevated LVMI not only predicts incident cardiovascular morbidity [20] but also directly contributes to LVH diagnosis when exceeding sex- and height-specific thresholds. Notably, while prior research predominantly treats LVH as a dichotomous outcome (present/ absent), LVMI—as a continuous measure of myocardial remodeling—remains underexplored despite prognostic significance. Longitudinal evidence indicates that reduced left ventricular mass index (LVMI) serves as a favorable prognostic indicator in hypertension management, underscoring its clinical relevance for risk stratification [21]. However, the mechanistic links between LVMI (as a quantifiable measure of myocardial remodeling) and metabolic abnormalities remain underexplored. Recent research has identified novel IR markers— TyG [22], and its derivatives—as promising tools for investigating metabolic-cardiac interactions due to their accessibility, cost-effectiveness, and broad applicability. Notably, relying solely on TyG may have limitations: while TyG-related indices have been independently associated with cardiovascular events such as myocardial infarction [23], heart failure [24], cardiovascular disease [25-28], studies suggest that integrating anthropometric parameters (e.g., waist circumference [WC], body mass index [BMI]) may enhance predictive accuracy [9,10]. This insight motivates our systematic comparison of the associations between LVMI and four TyG-derived indices (TyG, TyG-WC, TyG-BMI, TyG-WHtR). Second, while TyG-based metrics have demonstrated predictive value for LVH diagnosis [17,29,30], their dose-response relationship with continuous LVMI as a continuous variable remains unclear. These contradictions underscore the necessity for multidimensional analyses of metabolic-cardiac interactions and provide a theoretical foundation for this study to elucidate the dynamic relationship between IR and myocardial remodeling through composite indices. its Our study demonstrated that not only the high TyG group but also groups stratified by its derivatives exhibited significantly higher prevalence of CAD compared to their respective low-index counterparts. This consistency across TyG-related indices strengthens the evidence that IR, as reflected by these composite metrics, is robustly associated with cardiovascular morbidity. The mechanisms underlying the positive association between IR and left ventricular mass may extend beyond the TyG index itself. Similar to TyG, other IR indicators incorporating anthropometric parameterslikely contribute to cardiac remodeling through two interrelated pathways. Firstly, chronic hyperinsulinemia directly activates insulin-like growth factor 1 (IGF-1) receptor signaling in cardiomyocytes, which is sufficient to induce cellular hypertrophy [31]. Additionally, these composite indices may indirectly promote LVH via systemic interactions involving sympathetic nervous system overactivation, dysregulated renal sodium handling, and vascular smooth muscle cell proliferation—pathophysiological cascades that collectively amplify cardiac remodeling [32]. Critically, the uniform associations observed across TyG variants suggest that combining lipid-glucose metabolism markers with anthropometric data enhances the capacity to capture systemic IR burden, thereby providing a holistic explanation for their shared correlation with elevated LVMI. While standardized data collection across this large hypertensive cohort reduces measurement bias, several limitations should be acknowledged. First, the imbalanced male-to-female ratio (33.6% vs. 66.4%) may introduce selection bias, potentially limiting the generalizability of findings to male populations; future studies should therefore prioritize balanced enrollment to validate sex specific associations. Second, as a cross-sectional study, our findings reflect associations at a single time point but cannot establish temporal relationships. Longitudinal investigations are needed to clarify whether IR-induced metabolic disorders precede and directly contribute to LVH. Finally, although we adjusted for major confounders, residual confounding from unmeasured factors may persist and may thus affect the interpretation of results.
CONCLUSIONS
Our findings demonstrate robust and consistent positive correlations between TyG-derived composite indices (TyG-WC, TyG-BMI, TyG-WHtR) and LVMI, with TyG-BMI exhibiting the strongest association. The stability of these relationships across diverse clinical subgroups—including variations in age, sex, and comorbidities—highlights the potential utility of TyG-obesity indices (particularly TyG BMI) as composite biomarkers for monitoring cardiac remodeling in hypertensive populations. Importantly, these indices integrate routinely measured metabolic and anthropometric parameters (triglycerides, glucose, waist circumference, BMI), offering a cost-effective alternative to resource-intensive imaging modalities for estimating left ventricular mass in clinical practice.
AUTHOR CONTRIBUTIONS
QC proposed the idea, performed data analysis, and draft manuscripts. YC, JS, and NZ conducted project integration. SZ, BQ, JQ, BZ, YW, and ML read the manuscript and provided revisions, and PZ and SW edited and supervised the writing and helped perform the revision with constructive discussions.
FUNDING
This study was supported by the “National Key R&D Program of China” (Funding No.2020YFC2008900) and the “National Key R&D Program of China” (Funding No. 2024YFA1109100, 2024YFA1109105).
Data Availability
The datasets are available from the corresponding author upon reasonable request.
Ethics Approval
This study was conducted in accordance with the Declaration of Helsinki and approved by the Ethics Review Boards of Fuwai Hospital and participating local hospitals. All participants executed a written informed consent form before their involvement.
REFERENCES
- Nayak SS, Kuriyakose D, Polisetty LD, Patil AA, Ameen D, Bonu R, et al. Diagnostic and prognostic value of triglyceride glucose index: a comprehensive evaluation of meta-analysis. Cardiovasc Diabetol. 2024; 23: 310.
- Guerrero-Romero F, Simental-Mendía LE, González-Ortiz M, Martínez-Abundis E, Ramos-Zavala MG, Hernández-González SO, et al. The product of triglycerides and glucose, a simple measure of insulin sensitivity. Comparison with the euglycemic-hyperinsulinemic clamp. J Clin Endocrinol Metab. 2010; 95: 3347-3351.
- Lee SH, Kwon HS, Park YM, Ha H-S, Jeong SH, Yang HK, et al. Predicting the development of diabetes using the product of triglycerides and glucose: The chungju metabolic disease cohort (CMC) study. PLoS ONE. 2014; 9: e90430.
- Chen Y, Zhong Z, Gue Y, Banach M, McDowell G, Mikhailidis DP, et al. LIPIDOGRAM2015 Investigators. Impact of surrogates for insulin resistance on mortality and life expectancy in primary care: a nationwide cross-sectional study with registry linkage (LIPIDOGRAM2015). Lancet Reg Health Eur. 2024; 49: 101182.
- Pranata R, Huang I, Irvan, Lim MA, Vania R. The association between triglyceride-glucose index and the incidence of type 2 diabetes mellitus-a systematic review and dose-response meta-analysis of cohort studies. Endocrine. 2021; 74: 254-262.
- Liu F, Ling Q, Xie S, Xu Y, Liu M, Hu Q, et al. Association between triglyceride glucose index and arterial stiffness and coronary arterycalcification: a systematic review and exposure-effect meta-analysis.Cardiovasc Diabetol. 2023; 22: 111.
- Liang S, Wang C, Zhang J, Liu Z, Bai Y, Chen Z, et al. Triglyceride- glucose index and coronary artery disease: a systematic review and meta-analysis of risk, severity, and prognosis. Cardiovasc Diabetol. 2023; 22: 170.
- Feng X, Yao Y, Wu L, Cheng C, Tang Q, Xu S. Triglyceride-Glucose Index and the Risk of Stroke: A Systematic Review and Dose-Response Meta-Analysis. Horm Metab Res. 2022; 54: 175-186.
- Dang K, Wang X, Hu J, Zhang Y, Cheng L, Qi X, et al. The association between triglyceride-glucose index and its combination with obesity indicators and cardiovascular disease: NHANES 2003-2018. Cardiovascular Diabetology. 2024; 23: 8.
- Lim J, Kim J, Koo SH, Kwon GC. Comparison of triglyceride glucose index, and related parameters to predict insulin resistance in Korean adults: An analysis of the 2007-2010 Korean National Health and Nutrition Examination Survey. PLoS One. 2019; 14: e0212963.
- Xia W, Cai Y, Zhang S, Wu S. Association between different insulin resistance surrogates and infertility in reproductive-aged females. BMC Public Health. 2023; 23: 1985.
- McDonagh TA, Metra M, Adamo M, Gardner RS, Baumbach A, Böhm M, et al; ESC Scientific Document Group. 2023 Focused Update of the 2021 ESC Guidelines for the diagnosis and treatment of acute and chronic heart failure. Eur Heart J. 2023; 44: 3627-3639.
- Cai S, Zhu T, Ding Y, Cheng B, Zhang A, Bao Q, et al. The relationship between the weight-adjusted-waist index and left ventricular hypertrophy in Chinese hypertension adults. Hypertens Res. 2023; 46: 253-260.
- Yildiz M, Oktay AA, Stewart MH, Milani RV, Ventura HO, Lavie CJ. Left ventricular hypertrophy and hypertension. Prog Cardiovasc Dis. 2020; 63: 10-21.
- ?or?evi? DB, Kora?evi? GP, ?or?evi? AD, Lovi? DB. Hypertension andleft ventricular hypertrophy. J Hypertens. 2024; 42: 1505-1515.
- Mehta SK, Rame JE, Khera A, Murphy SA, Canham RM, Peshock RM, et al. Left ventricular hypertrophy, subclinical atherosclerosis, and inflammation. Hypertension. 2007; 49: 1385-1391.
- Zhai Y, Fu H, Li Y, Li S, Zhang W, Yue J, et al. Relationship between four insulin resistance surrogates and left ventricular hypertrophy among hypertensive adults: a case-control study. Endocr Connect. 2024; 13: e230476.
- Moura B, Aimo A, Al-Mohammad A, Keramida K, Ben Gal T, Dorbala S, et al. Diagnosis and management of patients with left ventricular hypertrophy: Role of multimodality cardiac imaging. A scientific statement of the Heart Failure Association of the European Society of Cardiology. Eur J Heart Fail. 2023; 25: 1493-1506.
- Ma WY, Yang CY, Shih SR, Hsieh HJ, Hung CS, Chiu FC, et al. Measurement of Waist Circumference: midabdominal or iliac crest? Diabetes Care. 2013; 36: 1660-1666.
- Okin PM, Devereux RB, Jern S, Kjeldsen SE, Julius S, Nieminen MS, etal; LIFE Study Investigators. Regression of electrocardiographic left ventricular hypertrophy during antihypertensive treatment and the prediction of major cardiovascular events. JAMA. 2004; 292: 2343-
2349. - Verdecchia P, Schillaci G, Borgioni C, Ciucci A, Gattobigio R, Zampi I, et al. Prognostic significance of serial changes in left ventricular mass in essential hypertension. Circulation. 1998; 97: 48-54.
- Tao LC, Xu JN, Wang TT, Hua F, Li JJ. Triglyceride-glucose index as a marker in cardiovascular diseases: landscape and limitations. Cardiovasc Diabetol. 2022; 21: 68.
- Rokicka D, Hudzik B, Wróbel M, Sto?tny T, Sto?tny D, Nowowiejska- Wiewióra A, et al. The prognostic impact of insulin resistance surrogates in patients with acute myocardial infarction with and without type 2 diabetes. Cardiovasc Diabetol. 2024; 23: 147.
- Zhou Q, Yang J, Tang H, Guo Z, Dong W, Wang Y, et al. High triglyceride- glucose (TyG) index is associated with poor prognosis of heart failure with preserved ejection fraction. Cardiovasc Diabetol. 2023; 22: 263.
- Lopez-Jaramillo P, Gomez-Arbelaez D, Martinez-Bello D, Abat MEM, Alhabib KF, Avezum Á, et al. Association of the triglyceride glucose index as a measure of insulin resistance with mortality and cardiovascular disease in populations from five continents (PURE study): a prospective cohort study. Lancet Healthy Longev. 2023; 4: e23-e33.
- Oh R, Kim S, Park SH, Jang M, Cho SH, Kim JY, et al. Elevated triglyceride-glucose index is a risk factor for cardiovascular events in adults with type 1 diabetes: a cohort study. Cardiovasc Diabetol. 2025; 24: 150.
- Haring B, Schumacher H, Mancia G, Teo KK, Lonn EM, Mahfoud F, et al. Triglyceride-glucose index, low-density lipoprotein levels, and cardiovascular outcomes in chronic stable cardiovascular disease: results from the ONTARGET and TRANSCEND trials. Eur J Prev Cardiol. 2024; 31: 311-319.
- Xu J, Cai D, Jiao Y, Liao Y, Shen Y, Shen Y, et al. Insights into the complex relationship between triglyceride glucose-waist height ratio index, mean arterial pressure, and cardiovascular disease: a nationwide prospective cohort study. Cardiovasc Diabetol. 2025; 24: 93.
- Jv M, Zhang J, Han Y, Yang A, Zhu Y. Association of triglyceride glucose- body mass index and left ventricular hypertrophy in patients with IgA nephropathy: a retrospective study. Eur J Med Res. 2024; 29: 627.
- Yang C, Liu W, Tong Z, Lei F, Lin L, Huang X, et al. The Relationship Between Insulin Resistance Indicated by Triglyceride and Glucose Index and Left Ventricular Hypertrophy and Decreased Left Ventricular Diastolic Function with Preserved Ejection Fraction. Diabetes Metab Syndr Obes. 2024; 17: 2259-2272.
- Sasson Z, Rasooly Y, Bhesania T, Rasooly I. Insulin resistance is an important determinant of left ventricular mass in the obese. Circulation. 1993; 88: 1431-1436.
- Anan F, Yonemochi H, Masaki T, Takahashi N, Fukunaga N, Teshima Y, et al. High-density lipoprotein cholesterol and insulin resistance are independent and additive markers of left ventricular hypertrophy in essential hypertension. Hypertens Res. 2007; 30: 125-131.


