Shengqi Yichang Decoction Enhances the Effect of Dual PD-1 and CTLA-4 Immunotherapy in Microsatellite Stable Colorectal Cancer by Remodeling CD8+T cell Infiltration
- 1. The Third Clinical Medical College, Nanjing University of Traditional Chinese Medicine, China.
- 2. Jiangsu Clinical Innovation Center of Digestive Cancer of Traditional Chinese Medicine, China
- 3. Department of Oncology, Affiliated Hospital of Integrated Traditional Chinese and Western Medicine, China.
- 4. Research Center for Multicomponent of Traditional Chinese Medicine and Microecology, Jiangsu Province Academy of Traditional Chinese Medicine, China.
- 5. Affiliated Hospital of Integrated Traditional Chinese and Western Medicine, Nanjing University of Chinese Medicine, China
Abstract
Object: Immunotherapy targeting PD-1 and CTLA-4 have made breakthrough in cancer treatment. However, the Cases of Colorectal Cancer (CRC) with Microsatellite Stable (MSS) do not respond to the dual therapy. Thus, new strategy will be needed to overcome this limitation. A Traditional Chinese Medicine (TCM) Shengqi Yichang (SQYC) decoction has been proven to be effective in controlling CRC growth and enhancing patients’ immune cells number in clinic.
Methods: Here, an orthotropic MSS CRC tumor model (CT26-Luc cells) was used to observe the anti-tumor effect of SQYC decoction. A serial of comprehensive studies, including systemic pharmacological screening, RNA-sequencing, Single cell sequencing, metabolomics, and proteomics analysis were performed to uncover the mechanisms of SQYC in enhancing the immune cells infiltration. Meanwhile, experimental validations were conducted to confirm the predicted results, such as qPCR for the hub genes expression, flow cytometry for T cell infiltration, ELISA assay for the concentrations of major metabolites.
Results: Animal experiments indicated that SQYC decoction inhibited MSS CRC growth and increased the response of tumors to dual immune checkpoint inhibitors (ICIs). Pharmacological study revealed that SQYC contained 14 main components and 11 key genes (Trp53, PRKACB, AKT1, MAPK1, MAPK3, JUN, TNF, IL-6, IL-1β, CD44, MAPK8), to be involved in multiple pathways. Single cell RNA sequencing revealed that SQYC decoction acts as an anti-tumor immune promoter by increasing the proliferation and functions of CD8+ T effector cells in MSS CRC tumors. Based on metabolomics analyses, profoundly altered metabolites were identified, four metabolic pathways, namely linoleic acid, glycerophospholipid, choline and arachidonic acid metabolisms were explored. We found 99 down-regulated proteins and 190 up-regulated proteins in SQYC group by proteomics analysis. The enrichment gathered in anti-tumor immune therapy related signings, including PD-L1 expression and PD-1 checkpoint pathway, neutrophil extracellular trap formation, natural killer cell mediated cytotoxicity and IL-17 signaling pathway.
Conclusion: SQYC decoction might act as a novel therapeutic strategy for CRC patients with MSS tumors.
Keywords: Shengqi Yichang Decoction; Mss Crc; Immune Checkpoint Blockade; Single Cell Sequencing; Cd8+T cell
Abbreviations: CRC: Colorectal Cancer; ICIs: Immune Checkpoint Inhibitors; PD-1/PD-L1: Programmed Death receptor-1/programmed death ligand 1; NSCLC: Non-small Cell Lung Cancer; MMR: Mismatch Repair; MSI: Microsatellite Instability; FDA: Food and Drug Administration; CTLA-4: Cytotoxic T Lymphocyte-associated antigen-4; MSS: Microsatellite Stable; SQYC: Shengqi Yichang; TCM: Traditional Chinese medicine; HPLC: High-performance Liquid Chromatography; IHC-Score: Immunohistochemistry Score; DEGs: Differentially Expressed Genes; GO: Gene Ontology; KEGG: Kyoto encyclopedia of genes and genomes; TCMSP: TCM Systems Pharmacology Database; OB: Oral Bioavailability; DL: Drug-likeness; PCA: Principal Component Analysis; ortho: PLS-DA: Orthogonal partial least squares-discriminant analysis ortho; TMT: Tandem Mass Tags; CAN : Acetonitrile; BP: Biological Process; CC: Cellular Component; MF: Or Molecular Function; CFSE: Carboxyfluorescein Succinimidyl Ester; PRKACB: Protein Kinase camp-dependent Catalytic Subunit β; IFN-γ : Interferon-gamma; IL-13: Interleukin-13; IL-4: Interleukin-4; scRNA-seq: Single-cell RNA sequencing; pDCs: Plasmacytoid Dendritic Cells; ECS: Endothelial Cells; MPS: Mononuclear Phagocytes; NK: Natural killer; Treg cells: Regulatory T Cells; Teff cells: Effector T cells; Tex cells: Exhausted T cells; MFI: Mean Fluorescent Intensity; DEMs: Differential Metabolites; DEPs: Differentially Expressed Proteins; APCs: Antigen-presenting Cells
Graphic Abstract
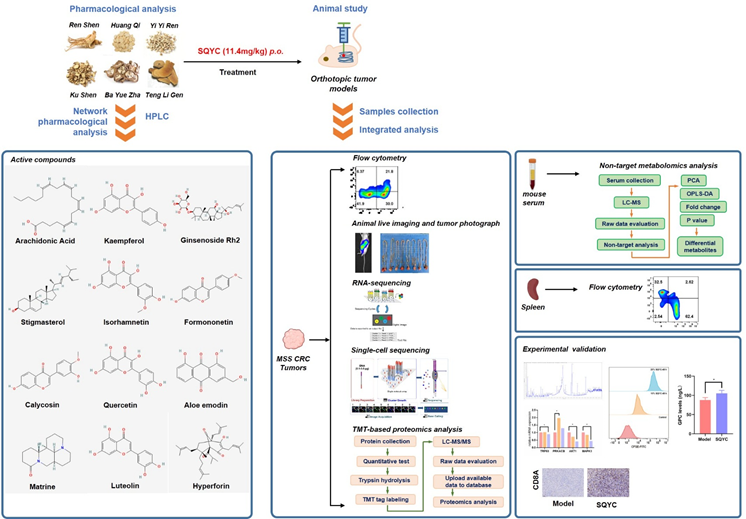
Schematic overview of the experimental design and analytical workflow
Introduction
Colorectal cancer (CRC) is becoming the second leading cause of cancer mortality worldwide till 2020 [1,2], and the incidence rate has been increasing in recent years [3]. It is worth noting that approximately 30-50% of CRC patients experience tumor dissemination [4]. Even after radical surgery, radiation therapy, chemotherapy, or molecular targeted drugs, their 5-year mortality rate is as high as 50%, due to its rapid deterioration and drug resistance [5]. Therefore, exploring new treatment strategies, enhancing efficacy, and improving prognosis is one of the key issues that urgently needed in clinical practice (Graphical Abstract).
Immune Checkpoint Inhibitors (ICIs) have attracted unprecedented attention in cancer therapy, for example the clinical success of programmed death receptor-1/programmed death ligand 1 (PD-1/PD-L1) blockade therapy in various cancers, including non-small cell lung cancer (NSCLC), nasopharyngeal cancer, breast cancer [6-8]. The DNA mismatch repair (MMR) pathway corrects the tumor mutation during DNA replication, which causes microsatellite instability (MSI) [9]. The US Food and Drug Administration (FDA) approved the use of PD-1/PD-L1 inhibitors to treat MSI and MMR-deficient (dMMR) solid tumors, due to their high sensitivity to ICIs [10], including MSI-high (MSI-H) CRC. Furthermore, the largest clinical trial (CheckMate-142) also reported that the combination therapy of PD-1/PD-L1 and cytotoxic T lymphocyte-associated antigen-4 (CTLA-4) antibodies could provide more durable clinical benefit in CRC [11]. Unfortunately, this efficacy is notably high only in dMMR/MSI-H CRC, most CRC patients (over 85%) with MMR proficient/microsatellite stable (pMMR/MSS) phenotype are completely unresponsive to the combination treatment [12]. Latest research mentioned that the non responsive of MSS CRC can be attributed to the formation of immunosuppressive tumor microenvironment [13]. This prominent issue leaves a large room for the improvement of the potency of dual blockade ICIs in MSS CRC patient outcomes.
Shengqi Yichang (SQYC) decoction is a well-known Traditional Chinese Medicine (TCM) for CRC with good clinically results. SQYC also can induce CRC cell autophagy and regulate the polarization of macrophages [14]. In vivo and in vitro studies have shown that some active components of SQYC, such as matrine, ginsenoside, tanshinone IIA can significantly enhance PD-1 inhibitor efficacy [15,16]. Therefore, we hypothesized that SQYC can act as an ideal strategy to overcome the limitation of immunotherapeutic effect for MSS CRC patients. In this study, the animal models were established to explore the effects of SQYC on the tumor immune environment, metabolomics and proteomics profiles by single cell RNA sequencing, TMT-based proteomics and non-target metabolomics analysis, and further confirmed by cellular experiments. Our extensive work provides experimental evidence of SQYC improving the efficacy of ICI agents and highlights a new treatment strategy for CRC.
Material and Methods
Preparation of Drugs
SQYC granule (batch number: Z20200004000) was provided by Jiangsu Sunan Pharmaceutical Industrial Co., Ltd. (Jiangsu, China). First, six kinds of plants, including Actinidia Chinensis Planch (Teng Li Gen), Hedysarum Multijugum Maxim (Huang Qi), Panax Ginseng C. A. Mey (Ren Shen), Akebiae Frucyus (Ba Yue Zha), Coicis Semen (Yi Yi Ren), and Sophorae Flavescentis Radix (Ku Shen), were extracted with distilled water and ground into powders by a vacuum freeze dryer. Then, the SQYC granule was made by mixing the powders in the adequate dosage ratio and adding dextrin. The quality of SQYC was monitored using a High-Performance Liquid Chromatography (HPLC) analysis, according to our previous study [14-17]. The granule was dissolved in warm distilled water before being administered to mice. For the cell treatment, SQYC-Medicated Serum was prepared. Sprague-Dawley rats were randomly divided into two groups: Control (n = 10) and SQYC treated group (n = 10). The rats were provided with a standard diet and room condition. The rats in SQYC groups were received SQYC (the concentration was the same as that used in animal experiments), while control group ones received physiological saline, twice a day for 5 days, by oral administration. One hour after the last administration, the rats were anesthetized, blood samples were collected from the abdominal aorta and centrifuged at 4000 r/min at 4°C for 15 min. Serum was collected and filtered through a 0.22μm filter, heat-inactivated at 56°C for 30 min, and stored at -80°C until cell culture.
Cell lines and culture method
Luciferase transfected CT26 (CT26-Luc) cells, CT26 WT cells and a murine-derived cytotoxic IL-2-dependent T-cell line CTLL-2 were provided by Jiangsu Province Academy of Traditional Chinese Medicine. CT26-Luc and CT26 WT cells were cultured with RPMI-1640 media (cat: 11875093), while CTLL-2 cells were in DMEM culture medium (cat: 11965092), containing 10% Fetal bovine serum (FBS, cat: A5669701) and 1% penicillin/streptomycin (cat: 15140122) at 37°C and 5% CO2.
The co-culture system of CT26 and CTLL-2 cells was conducted, the CT26 cells were initially placed in a 6-well plate. After adhesion for 24h, a mix cell resuspension of CTLL-2 cells and CT26 cells (cell ratio of 1:1) containing 10 ng/ml murine recombinant IL-2 protein (cat: AF-212-12-5UG) in RPMI-1640 medium was transferred to the CT26 cell culture plate to establish the co-culture system [18]. All above culture reagents were obtained from Gibco company, USA.
Animal experiments
The animal experiments were approved by the Animal ethical committee of Affiliated Hospital of Integrated Traditional Chinese and Western Medicine, Nanjing University of Chinese Medicine in April 28, 2023 (Registration No.: AEWC-20230428-302). BALB/c mice (male, 6 weeks old) were purchased from Kaisijia Biological technology Co., Ltd. (Jiangsu, China). The orthotropic MSS CRC tumor models were established using CT26-Luc cells. Following to the literature reports [19,20], a 2cm incision was made in the left abdomen of the mouse and pulled out the intestine, CT26-Luc cells (25μl, 1 × 10⁶ cells) were injected into the wall of intestine and then the wounds were sutured. In situ tumor mice were randomly divided into six groups (n=8): 1) Blank: no surgery; 2) Sham: open the abdomen but without cell injection; 3)Model: CT26-Luc cells injection; 4) SQYC: CT26-Luc cells injection plus orally administration with SQYC (11.4g/kg, once a day); 5) αPD-1 + anti-CTLA-4: CT26-Luc cells injection plus administration with αPD-1 (1mg/ml, 0.1ml, cat: BE0146, Bioxcell, USA) and anti-CTLA-4 (100μg/0.1ml, cat: BE0164, Bioxcell, USA), i.p.injected once every three days; 6) SQYC+αPD-1+anti-CTLA-4: CT26-Luc cells injection plus administration with SQYC(11.4g/kg, once a day, oral), αPD-1 (1mg/ml, 0.1ml, per three days, i.p.), anti-CTLA-4 (100μg/0.1ml, per three days, i.p.). The daily dosage of SQYC was obtained based on the clinical dosage for patients (10g/70kg) [17], and calculated using human–mouse transfer formula (mouse dose = human dose × 9.1) [21]. The animal studies were repeated three independent times.
In vivo imaging
The bioluminescence of tumor accumulation was observed using in vivo imaging system (AniView 6000, Biolight Biotechnology, China). Before observation, mice were injected with 200μl of D-Luciferin potassium (1.5mg/mL, cat: 115144-35-9, MCE, China) for 10min reaction. Quantitative analysis was performed using Aniview software.
Immunohistochemically (IHC) and multiple IHC staining
Tumor tissues were deparaffinized with xylene and rehydrated in a graded ethanol series (100%, 95%, 80% and 75%), then washed with distilled water for 2 min. The tissue sections were incubated with IHC Antigen Retrieval Solution (cat: 00-4955-58, Thermo Fisher Scientific, USA) for 3 min followed by 15 min blocking buffer reaction (cat: 37515, Thermo Fisher Scientific, USA) at room temperature. The diluted primary antibody (CD8A, cat: ab217344, Abcam, UK) was overnight incubated. Another incubation with related secondary antibody (cat: ab205719, Abcam, UK) was performed at room temperature for 1h. The expression of each signal was developed with DAB Substrate Kit (cat: 34065, Thermo Fisher Scientific, USA). The immunohistochemistry score (IHC-score) was defined as positive area ratio score × staining intensity score [22].
For multiple fluorescence IHC, briefly, slides were prepared using 4-Color IHC Kit (cat: abs50028, Absin, China) and incubated with primary antibodies CD4 (1:200, cat: 183685, Abcam, UK) at 4°C overnight. Anti-Rabbit Secondary Antibody (included in IHC kit) was used to HRP-conject with the primary for 1h at room temperature. IHC staining was performed for 10 min at room temperature. The antibody was stripped with antibody eluent (abs994, Absin, China) at 37°C for 20 min, the new rounds of staining were repeated for CD8 antibody (1:200, cat: S0B0034, STARTER, China) at room temperature for 1h or Ki67 antibody (1:200, cat: 9129, Cell Signaling Technology, USA) at 4°C overnight. DAPI staining for 5min was applied for nucleus. Finally, slides were sealed and observed under the laser confocal microscope (Olympus, Japan) and analyzed using HALO software (Indica Labs, USA)
Hematoxylin and Eosin (H&E) Staining
Tumors were harvested and embedded in paraffin blocks after experiments. Then blocks were cut into 5µm thick tumor sections for confirmation through H&E staining. Sections were incubated with hematoxylin for 3 min, following by 5 min rinse with tap water. Place the sections in distilled water for 30 sec, and another 30 sec in 95% alcohol. Counterstain Eosin Y solution for 1 min, then dehydrate, clear and mount the slices.
RNA-sequencing analysis
Total RNA was isolated using RNeasy extraction kit (cat:74104, Qiagen, USA), followed by electrophoresis quality Agilent 4200 TapeStation (cat: G2991A, Agilent, USA) and quantitative quality using NanoDrop One (NDONE, Thermo Fisher Scientific, USA). Total RNA was converted into cDNA and fragmented into small pieces for library preparation. VAHTS Stranded mRNA seq Library Prep Kit (cat: NR602, Vazyme, China) was used to obtain the library, and loaded onto Illumina sequencing platform to read. Use R software edgeR package to identify the differentially expressed genes (DEGs). The cutoff criteria were set at P<0.05, |log2FC| ≥ 1. Gene ontology (GO) and Kyoto Encyclopedia of Genes and Genomes (KEGG) enrichment of DEGs was carried out using R software cluster profiler package, and presented as bar plot and scatterplot [23].
Network pharmacological analysis
TCM Systems Pharmacology Database (TCMSP, http://tcmspw.com/tcmsp.php) was used to retrieve the active ingredients in SQYC. The filter information was based on oral bioavailability (OB) ≥ 30% and drug-likeness (DL) ≥ 0.18. Drugbank database (https://go.drugbank.com/) was screened to search the target components, active compounds without potential target information were excluded in the subsequent analysis. STRING database (https://cn.string-db.org) was used to check the interaction between target genes (the minimum required interaction score was set to 0.9). Cytoscape software (Cytoscape, 3.7.2) was used to integrate the interaction networks and selected top genes based on the degree ≥ 20. The chemical structures were obtained from PubChem database (https://pubchem.ncbi.nlm.nih.gov/).
Single cell sequencing data processing and clustering
1. Tissue dissociation and preparation: The fresh tumor tissues were dissociated into single cells using Tumor Dissociation Kit (Cat. 130-096-730, Miltenyi Biotec). According to the instructions, tissue pieces were digested at 37°C for 15min with sustained agitation, then filtered the samples using 40μM sterile strainers and centrifuged at 1000rpm for 5 min. The supernatant was discarded, the sediment was resuspended in 1ml PBS (cat: SH30256.01, HyClone, USA), stained with Trypan blue (cat: 72-57-1, Sigma, USA) and microscopically evaluated.
2. Single cell RNA sequencing (scRNA-seq): Single-cell suspensions were converted to barcoded scRNA-seq libraries by using the Chromium Single Cell Library, Gel Bead & Multiplex Kit (10x Genomics). Briefly, cells were partitioned into Gel Beads in Emulsion in the ChromiumTM Controller instrument where cell lysis and barcoded reverse transcription of RNA occurred. Libraries were prepared using 10x Genomics Library Kits and sequenced on Illumina Nova6000 with 150bp paired end reads.
3. Raw sequencing data quantification, cell clusters annotation and functional enrichment: Raw sequencing data were processed to generate gene expression profiles using Cell Ranger (10×Genomics, v.3.0.2). Reads from the 10× library was mapped to human genome GRCh38 with ensemble version 92 gene annotation. Reads with the same cell barcode, UMI and gene were grouped together to calculate the number of UMIs per gene per cell. The UMI count tables of each cellular barcode were used for further analysis. Cell type identification and clustering analysis using Seurat program R package (version 3.0.1, http://satijalab.org/seurat/). UMI count tables were loaded into R using read.table function. Then we set the parameter resolution to 0.6 for FindClusters function to clustering analyses. DEGs between different samples or consecutive clusters (FDR < 0.001) were identified with function FindMarkers. GO function enrichment analysis was performed on the gene set using the clusterProfiler (version 3.8.1, P< 0.05) to find biological functions or pathways that are significantly associated with the genes specifically expressed [24].
Metabolomics analysis
The experimental mouse serum (50μl) was mixed with 300μl of extraction solution (ACN: Methanol = 1:4, V/V), then vortexed and centrifuged at 12000 rpm for 10 min at 4°C. The supernatant was collected and centrifuged again at 12000 rpm for 3 min. Around 180μl aliquots supernatant was transferred for LC-MS analysis.
Chromatographic separation was performed on Agilent 1200 system (Agilent, USA). The chromatographic parameters were T3 column (Waters ACQUITY Premier HSS T3 Column 1.8µm, 2.1 mm×100 mm), 0.1% formic acid in water as mobile phase A and 0.1 % formic acid in acetonitrile as mobile phase B. The gradient condition was 5 to 20% in 2 min, increased to 60 % in the following 3 min, increased to 99% in 1 min and held for 1.5 min, then come back to 5% mobile phase B within 0.1 min, held for 2.4 min. The analytical conditions were as follows, column temperature, 40°C; flow rate, 0.4mL/min; injection volume, 4μl; Another aliquot was using negative ion conditions and was the same as the elution gradient of positive mode.
MS spectra were carried on TripleTOF 6600 mass spectrometry (AB Sciex, USA). Data acquisition was operated using the information-dependent acquisition (IDA) mode using Analyst TF 1.7.1 Software (Sciex, Concord, Canada). The source parameters were gas 1, 50psi; gas 2, 50 psi; curtain gas, 25 psi; temperature, 550°C; decluttering potential, 60V, or-60V in positive or negative modes, respectively; and ion spray voltage floating, 5000V or-4000V in positive or negative modes, respectively.
Raw data was performed by R package XCMS program (version 4.1.2, www.r-project.org), including peak extraction, peak alignment and retention time correction. Principal component analysis (PCA), orthogonal partial least squares-discriminant analysis (orthoPLS-DA, VIP>1, P<0.05) were used to show differences in metabolite profiles between groups. Hierarchical cluster analysis was carried out by R software ComplexHeatmap program (version 2.9.4) and presented as heat maps with dendrograms. KEGG enrichment were annotated using KEGG compound database (http://www.kegg.jp/kegg/compound/), and then mapped to KEGG pathway database (http://www.kegg.jp/kegg/pathway/). Significantly enriched pathways are identified with a hypergeometric test’s P-value.
Tandem Mass Tags (TMT)-based proteomics analysis
1. Proteins preparation: Frozen tumor tissues were lysed with 300µl lysis buffer with 1mM PMSF (cat: P0013G and cat: ST507, Beyotime Biotechnology, China), followed with sonication. Then, samples were centrifuged at 12000 rpm for 10 min at 4°C, repeat once to exclude precipitation. Protein concentration was determined by BCA kit (cat: 23225, Thermo, USA) and detected by SDS-PAGE assay.
2. Trypsin hydrolysis and TMT tag labelling: According to the above protein concentration, 50μg of protein was taken and added 25mM DTT (cat: 1064272, Adamas-beta, China) to achieve a mix solution with final concentration of 5mM, incubated the mixture at 55°C for 30min. The corresponding volume of iodoacetamide (10mM, cat: I6125, Sigma, USA) was added and incubated in the dark for 15min at room temperature. Then 6 times of the volume of precooled acetone in the above system to precipitate the protein, and place it at -20°C overnight. Subsequently, the sample was centrifuged at 8000g for 10 min at 4°C for collecting the precipitate and evaporate acetone for 2-3 minutes. 100μl TEAB (200mM, T7408, Sigma-Aldrich, USA) was added to the reconstituted precipitate, as well as 1mg/ml trypsin TPCK (T1426, Sigma-Aldrich, USA) to dissolve the protein (protein: TPCK = 50:1 (m/m) of the sample mass), and digested overnight at 37°C. After enzymatic hydrolysis, the peptides were labeled with TMT isobaric tags (cat: 90066, Thermo Fisher Scientific, USA) for 1h at room temperature.
3. Peptides separation and LC-MS/MS analysis: The separation of labeled peptides was performed using a C18 analytical column (Agilent Zorbax Extend, 2.1×150 mm, 5μm) on the 1100 HPLC System (Agilent, USA). Mobile phases A: acetonitrile (ACN)-H2O, 2:98, v/v and B (ACN-H2O, 90:10, v/v) were used as gradient. The flow rate was 300μl/min and monitored at 210nm. The gradient elution conditions were set as: 0~8 min, 98% A; 8~8.01 min, 98%~95% A; 8.01~30 min, 95%~80% A; 30~43 min, 80~65% A; 43~53 min, 65~55% A; 53~53.01 min, 55~10% A; 53.01~63 min, 10% A; 63~63.01 min, 10~98% A; 63.01~68 min, 98% A. During 8-54min, the eluent was repeatedly collected in centrifugal tube 1-15 every minute in turn until the end of gradient.
The peptide components analysis was performed by a Q-Exactive mass spectrometer (Thermo, USA) equipped with a Nanospray Flex source (Thermo, USA). Firstly, samples were separated using a RP-C18 column (RSLC, 75μm×50cm, Acclaim PepMap, Thermo, USA) with phase A (ACN-H2O-FA, 99.9:0.1, v/v) and phase B (ACN-H2O-FA, 80: 19.9: 0.1, v/v/v) under the condition of 0~4 min, 8-11% B; 4~36 min, 11-45% B; 36~39 min, 45-100% B and 39~45 min, 100% B. Full mass scan was acquired in the positive-ion mode in the range of 350 to 1500 m/z with a mass resolution of 45000 and AGC target value was set at 3e6. MS/MS spectra were obtained with a resolution of 3000 with an AGC target of 2e5 and a max injection time of 40ms. The Q-E dynamic exclusion was set for 30s.
4. Proteomics analysis: Proteome Discoverer (version 2.4.1.15, ThermoFisher Scientific, USA) was searched to analysis TMT-based proteomics data. The sequence file is uniprot-Mus musculus-10090-2023.2.1.fasta. The FDR was set to 0.01. DEGs between groups were evaluated based on the criteria fold change ≥ 1.2 or fold change ≤ 1/1.2 with p <0.05. Volcano plot and heat map were displayed using R software ggplot (v. 3.4.2) and pheatmap program (v. 1.0.12), respectively. GO analysis was performed using the clusterProfiler (version 3.8.1) to find biological process (BP), Cellular Component (CC), or Molecular Function (MF), top 5 with smallest p-value was selected. KEGG enrichment was screened based on KEGG Pathway and Orthology database. Protein-protein network construction was performed by STRING (https://string-db.org), followed by Cytoscape software analysis.
qPCR
Total RNA from different groups were lysed and isolated using TRIzol reagent (cat: 15596026CN, Invitrogen, USA) according to the protocol. Next, the cDNA was reversed using the QuantiTect Reverse Transcription Kit (cat:205311, QIAGEN, Germany) and amplified using QuantiNOVA SYBR Green PCR kit (cat: 208052, QIAGEN, Germany) on the Sequence Detection System (ABI Q7 pro, Applied Biosystems). The PCR procedure was conducted by denaturation at 95°C for 15s, annealing at 60°C for 10s and extension at 72°C for 40s, total 30-42 cycles, depending on different genes. The primer sequences were listed in Table 1. Subsequently, the relative expression of each gene was quantified as using 2-ΔΔCT methods.
Flow cytometry
The digested tumor tissues or spleen from experimental animals were passed through a 70μM mesh and washed with PBS twice, then centrifuged at 400 g for 10 min. Single-cell suspension was labeled with fixable viability stain (cat: 565388) and Fc block (cat: 553141) on ice for 20 min, followed by centrifuge at 600g, 5 min. The cell pellet then resuspended with the mixture of immunostaining antibodies, including APC-conjugated anti-CD45 (cat: 561018), FITC-conjugated anti-CD8 (cat: 553030), BV510-conjugated anti-CD4 (cat: 563106) (all above antibodies were from BD Pharmingen, USA) and PE-conjugated anti-CD3 antibody (cat: 12-0031-81, Invitrogen) 30 min at 4°C. FACS data was read using CytoFLEX flow cytometer (Beckman Coulter, USA). Results were analyzed using FlowJo software (Tree Star, USA) and presented as percentage of positive cells over total number of cells.
Carboxyfluorescein succinimidyl ester (CFSE) staining for T cell proliferation
T cells (1x10⁷) were stained with 1μl CFSE stain solution (1000X, cat: C34570, Invitrogen, USA) in dark for 20min, washed with PBS twice. Placed stained cells in a 24-well plate for SQYC treatment or non-treatment for 72h. Collected cells and centrifuged for 5min at 800g, then blocked cells with 5% BSA solution for 15min, followed by another centrifuge at 800g. Incubated cells with CD3 flow cytometry antibody (cat: 12-0031-81, Invitrogen) for 30min incubation, washed with PBS twice and measured CFSE fluorescent density by flow cytometer (CytoFLEX Beckmen coulter, USA). Set non-staining cells as negative control.
ELISA
The levels of cholineglycerophosphate (GPC, cat: MM-45393M2), phosphocholine (PC, cat: MM-48223M2), linoleic acid (cat: MM-928297O2), arachidonic acid (cat: MM-926637O2) and phosphatidylglycerol (PG, MM-927663O2) were measured by ELISA method. All ELISA kits were purchased from Jiangsu Meimian Industrial Co., Ltd, China. Mice serum was collected and incubated with ELISA reagents according to manufacturer’s instructions. Read the plates at OD 450 nm by a microplate reader (BioTek, Vermont, USA).
Statistics
All experiments were repeated three times, and the data was presented as the mean ±SD. For the comparisons among different groups, GraphPad Prism 10.0 (GraphPad Software, USA) was used to analyze the significance with unpaired Student’s t-test or one-way ANOVA. Statistical significance was set at P < 0.05.
Table 1
Table 1: Primer sequences of hub genes.
Table 2
Table 2: The potential intersected genes.
Table 3
Table 3: Top 11 hub genes.
Figure 1
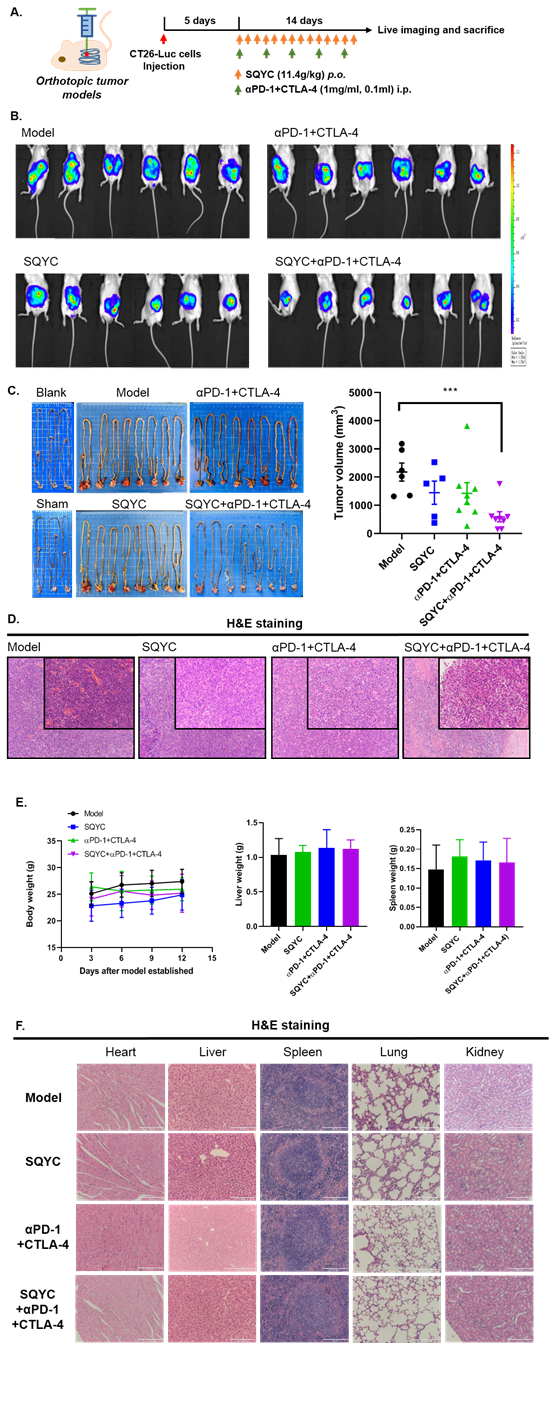
Figure 1: SQYC enhanced the efficacy of αPD-1+CTLA-4 double treatment in orthotropic tumor models. A. Work flow of animal experiment. B. Animal live imaging to observe the tumor sizes of different groups. C. Tumor tissues were photographed and tumor volume was calculated (n=8). D. H&E staining was performed to observe the pathological changes in tumor tissues (magnification x 200). ***P<0.001, compared to model groups.
Figure 2
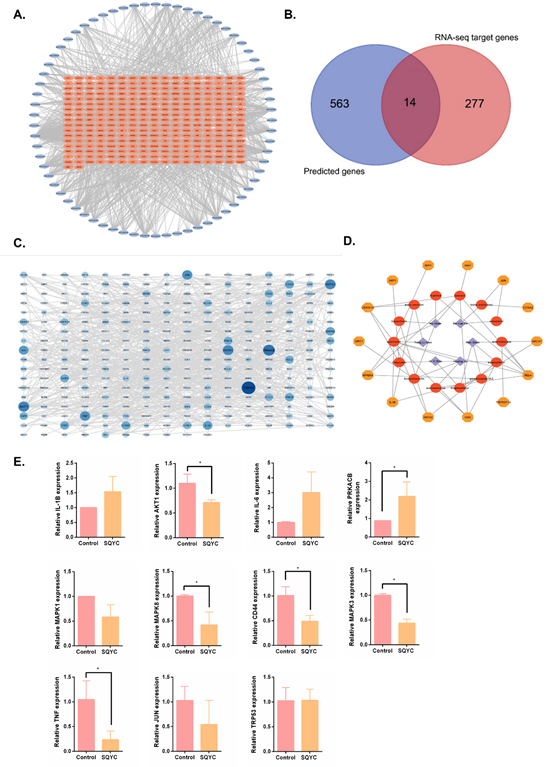
Figure 2: Active compounds and potential targets of SQYC. A. A total of 277 relative target genes were obtained from RNA-sequencing. B. Venn diagram of intersected targets between DrugBank prediction and RNA-sequencing results. C. The PPI network of SQYC targeted genes. D. Network of Chinese herb-ingredients-targets. E. qRT-PCR was used to detect the expression of potential genes. *P<0.05, compared to model group.
Figure 3
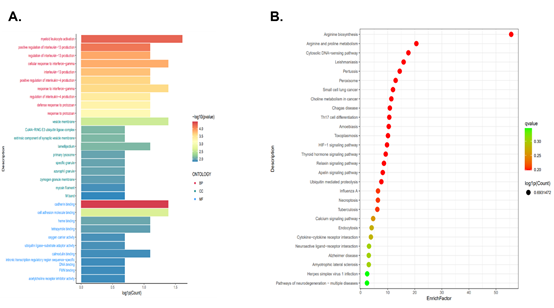
Figure 3: The functional analysis of SQYC. A. GO functional enrichment analysis. B. Analysis of KEGG pathway enrichment.
Results
SQYC enhanced the efficacy of the combination of αPD-1+CTLA-4 antibodies
CRC is classified by genetic alternations, around 5% patients have alternations in mismatch repair (MMR) DNA damage response pathway, exhibits a high tumor mutation burden. These patients are referred to as microsatellite instability (MSI), have a better response to anti-cancer immune therapy. However, the remaining 95% of patients have proficient MMR systems, they are microsatellite stable (MSS), and show no response to immune checkpoint inhibitors (ICIs), due to low immune cell infiltrate [25,26]. Ipilimumab and nivolumab are monoclonal antibodies that target immune inhibitory receptors CTLA-4 and PD-1, respectively, on T cells [27]. Thus first, we detect the synergistic inhibition of SQYC and CTLA-4 plus PD-1 ICIs. The orthotropic CT26-Luc MSS CRC tumor model was established (Figure 1A and IB). We observed the anti-cancer effect of SQYC on tumor accumulation effect and body weight for two weeks. Tumors were gradually formed after modeling surgery. After 14 days of treatment, the bioluminescence signals from SQYC treated groups was low, in contrast, the signals from model ones were significantly increased. Although CTLA-4 plus PD-1 inhibitors could partly reduce tumor size and luminescent intensity, but no significance. When SQYC was combined with CTLA-4 plus PD-1 ICIs, the treated mice exhibited the weakest bioluminescence signals and the tumor sizes of mice were obviously reduced, the inhibition was significant compared with other groups (P<0.05). In the meantime, the treatment has no side effect on mice body weight (Figure 1C). The representative images of tumors in each group were recorded by H&E staining (Figure 1D). In addition, the pathological observation by H&E staining showed that there was no significantly injury induced by SQYC treatment in mice heart, spleen, liver, kidney and lungs (Figure 1F). Our findings showed that SQYC granule markedly promoted the therapeutic efficiency of PD-1 plus CTLA-4 ICIs without obviously side effect.
Active compounds and potential targets of SQYC
1. Active compounds and targets prediction of SQYC: To investigate why SQYC could enhance the efficacy of PD-1 plus CTLA-4 ICIs, we next analysis the major active components of SQYC by high-performance liquid chromatography-mass spectrometry (HPLC-MS/MS) analysis. A total of 55 active components in SQYC granule were quantified using corresponding calibration curves of chemical standards, the detailed information was listed in Supplementary Table S1.
Beside HPLC-MS/MS analysis, network pharmacology-based analysis was also conducted to find out the potential components. We first screened the active ingredients in TCMSP. According to the standard of OB (≥30%) and DL (≥0.18), and referring above HPLC results, 108 effective compounds were listed, including 22 components from Ginseng (Ren Shen), 20 components from Astragalus (Huang Qi), 9 components from Coix seed (Yi Yi Ren), 6 components from vine root (also called kiwifruit root, Teng Li Gen), 6 components from Akebia fruit (Ba Yue Zha) and 45 ones from Sophora flavescens (Ku Shen), details are shown in Supplementary Table S2. They were then imported into DrugBank for targets prediction. After removing 21 targets with a reliability of 0 and duplicates, a total of 563 potential targets genes of SQYC active ingredients were obtained. To further explore the potential anti-tumor mechanisms of SQYC for MSS CRC, we further identified CRC-related targets by RNA-seq analysis. A total of 277 relative targets were annotated (Figure 2A). After comparison with the results of network pharmacology-based analysis and RNA-seq analysis, the intersected differentially expressed targets were presented as Venn diagram (Figure 2B). There were 14 potential intersected genes which may be involved in the anti-cancer immune effect of SQYC were identified as follows: XDH, PLAT, SKP1, MAOA, ABCA1, RELA, CDKN1A, TNFRSF1A, SPP1, XIAP, SIRT1, IL1B, NFKBIA and NR1I2, listed in Table 2.
The intersection genes were input into STING11.0, setting minimum required interaction score over 0.9, we got 281 targets and 818 edges in PPI network of SQYC by Cytoscape3.7 (Figure 2C). Though the step-by-step screening, the relationship among drugs, active components and targets were obtained, we established a network among them shown in Figure 2D, which contained 6 herbs, 14 ingredients, 14 targets and 47 edges. After analyzed using NetworkAnalyzer, the top 11 degree of the nodes were filtered (Degree≥20), they were: Trp53, PRKACB, AKT1, MAPK1, MAPK3, JUN, TNF, IL-6, IL-1β, CD44, MAPK8 (the degree detail was shown in Table 3). Most of 11 hub genes were overlapped with the targeted genes from previous Network Pharmacology analysis. Furthermore, we detected the expression levels of these hub genes by qRT-PCR, and found that after 24h treatment, 20% serum containing SQYC significantly inhibited the levels of TRP53, AKT1, MAPK3, IL-1β, CD44 and MAPK8, however, no obvious effect on MAPK1, JUN, TNF and IL-6 in CT26 cells (Figure 2E).
Interestingly, in this experimental validation, a new trend gene has been found in MSS CRC, named protein kinase cAMP-dependent catalytic subunit β (PRKACB), which belongs to the serine/threonine protein kinase family [28]. It serves as a key mediator to regulate cell growth, differentiation, and gene expression in various tumor proliferation and metastasis, such as pancreatobiliary oncocytic neoplasms [29], ovarian cancer [30]. Conversely, other reports mentioned that PRKACB might act as a tumor suppressor in non-small cell lung cancer [31]. Nonetheless, the exact role played by PRKACB in MSS CRC is still unknown. Thus, we confirmed that PRKACB was down-regulated in MSS CRC CT26 cells, it increased significantly by SQYC treatment for 24h, this evidence provided us a brand-new target in future MSS CRC prognosis and treatment.
2. GO analysis and KEGG pathway enrichment: The GO function analysis was used to screen enrichment of SQYC treatment compared to Model mice. In terms of BP, myeloid leukocyte activation, regulation of interleukin-13 (IL-13) production, cellular response to interferon-gamma (IFN-γ), interleukin-4 (IL-4) production were important processes that may happened in SQYC group. The most significant enrichment of SQYC in cellular component mainly included vesicle membrane, Cul4A-RING E3 ubiquitin ligase complex, extrinsic component of synaptic vesicle membrane. SQYC treatment also induced molecular functions such as cadherin binding, cell adhesion molecule binding, heme binding, tetrapyrrole binding, oxygen carrier activity as well as ubiquitin ligase-substrate adaptor activity (Figure 3A). Meanwhile, the top 10 involved enrichment of SQYC treatment in KEGG pathways were presented in Figure 3B, including Arginine biosynthesis, Arginine and proline metabolism, Cytosolic DNA-sensing pathway, Leishmaniasis, Pertussis, Peroxisome, Small cell lung cancer, Choline metabolism in cancer, Chagas disease and Th17 cell differentiation. These predictions indicated that SQYC might act as a crucial regulator in MSS CRC tumor metabolism and immune microenvironment, including Arginine biosynthesis.
Single cell sequencing predicted the functional roles of SQYC in MSS CRC immune microenvironment
Our pervious small clinical observation found that SQYC could alleviate the toxicity of FOLFOX4 chemotherapeutic regimen, prevent the incidence of leukopenia in CRC patients and more importantly, SQYC could significantly increase the proportion of T lymphocytes in CRC patients [14]. Referring to pervious reports that over 85% of CRC patients are MSS subtype and lack response to ICIs [32]. Thus, to further investigate whether SQYC could affect cellular heterogeneity to improve the tumor immune microenvironment and enhancing the efficacy of ICI, we conducted scRNA-seq analysis. After quality filtering, a total of 21153 cells were obtained from three SQYC treated tumors and three model tumor tissues. These cells were catalogued into night cell types, including Epithelial cells, Endothelial cells (ECs), Fibroblasts, B cells, Plasma cells, T cells, Neutrophils, Mononuclear phagocytes (MPs), and Plasmacytoid dendritic cells (pDCs) presented by graph-based UMAP (Figure 4A). Mononuclear phagocytes (MPs) are a group of myeloid immune cells that have phagocytic and/or antigen-presenting functions, including monocytes, macrophages, and dendritic cells. Thus, a total of 2738 MPs from samples were clustered into 3 subtypes including CD4+T cell, CD8+T cells and Natural killer (NK) cells. The subtype of CD4+T cells was further clustered as naïve T cells and regulatory T (Treg) cells annotated with canonical marker genes Bach2, Igfbp4, Igkc, Lef1, or Ctla4. CD8+T cells were clustered as naïve T cell annotated with Dapl1, effector T (Teff) cells annotated with Ccl5, Hmgb2, Hmgba2, Isg15; and exhausted T (Tex) cells annotated with Ccl4. NK cells were clustered as NK_Gzma and NK_Gzmd, respectively. Upon SQYC treatment, the numbers of naïve T cells (CD4+ and CD8+) were significantly decreased in tumor tissues, compared to model ones. Meanwhile, the proportions of NK cells and CD8+T cells in SQYC-treated tumors were much higher than in those from model tissues. While, CD8+Teff cells labeled with Hmgb2 exhibited the most significant increase level. Conversely, the number of CD4+Treg cells were decreased after SQYC administration (Figure 4B). The multiple color fluorescence staining results indicated that there is an obvious expression of Ki67 in model group and the percentage of positive cells were significantly higher than that of SQYC treated ones. Meanwhile, SQYC administration induced tumor tissues exhibited CD4 expression, induced significant CD8 levels increase, which were mainly concentrated within the tumor tissue, rather than around the tumors (Figure 4C and D). These findings suggested that SQYC treatment increased the infiltrating levels of CD8 cells, the mechanism might be related to the differentiation of naïve T cells, resulting in the activating the effector CD8+T cells, and the limiting of immune escape-related CD4+T regulatory cells.
In addition, besides the increase of CD8+Teff cells, the number of CCL4-labeled CD8+T exhausted cells were also enhanced significantly. Based on a report from Nature [33], exhausted T cells are particularly evident on high affinity CD8+T cells against neoantigens. Another report indicated that exhausted CD8+ T cells include progenitor exhausted cells and terminally exhausted cells. The progenitor exhausted CD8+ T cells show better tumor growth control ability and higher response to anti-PD-1 therapy [34]. Thus, we assumed that in SQYC-treated tumor environment, the increased exhausted CD8+T cells might be the subpopulation of progenitor ones, resulting from the enhancement of high affinity CD8+T, these changes induced by SQYC displayed a better control of tumor growth and the response to immune therapy. However, the specific mechanism behind this change remains unclear, it will be further studied in our future work. To further verify the promotional effect of SQYC in CD8+T cells infiltration, IHC staining was performed first. IHC staining exhibited significantly overexpression of CD8A in SQYC group (P < 0.05) (Figure 4E). Next, we use mouse T cell line CTLL-2 to evaluate the expression levels of CTLA-4, CCL5, HMGB2, ISG15, CCL4, as well as PD-1 expression by qRT-PCR. The results showed that after SQYC treatment, CD8+T effector cells-annotated genes CCL5, ISG15 and PD-1 expression was significantly increased, which was consisted with scRNA-sequencing prediction. The expression of CCL4 from CD8+Tex cells also higher than model ones. While, no changes were observed in HMGB2 and CTLA-4 expression (Figure 4F). All above indicated that SQYC could enhance CD8+T cell via CCL5 and ISG15 expression. Furthermore, we confirmed in flesh tumor tissues by flow cytometry that αPD-1 plus CTLA-4 antibodies had little effect on CD45+CD3+ cells and CD8+ T cells proportions, compared to the model group. Notably, SQYC alone or combination with αPD-1+CTLA-4 robustly increased both number of CD45+CD3+ T cells and CD8+ T cells in tumor tissues (Figure 5A). Furthermore, we treated mouse T cell line CTLL-2 with SQYC to detect its promoting effect of T cell proliferation by CFSE staining. As shown in Figure 5B, CFSE assay showed that SQYC treatment could obviously enhance the mean fluorescent intensity (MFI) of CFSE in CTLL-2 cells, suggesting that SQYC produced a significant increase in T cell proliferation.
We further investigated the surface checkpoints expression and the secretion of chemokines in tumor tissues. Single-cell sequencing analysis revealed that in SQYC-treated tumor tissues, the frequency of CD28+CD80+ and CTLA-4+CD80+ Teff cells was obviously increased in the percentage of total CD8+T cells, compared to model tumor tissues (Figure 5C). As well as the chemokines levels, CD8+Teff cells secreted high level of CXCL10/CXCR3 (Figure 5D), which plays an important role in T cells-tumor cells adhesion to exhibit anti-tumor immunity [35].
SQYC induced specific changes in metabolome
We then performed metabolite profiling by non-target metabolomics analysis to detect the changes in MSS CRC metabolites induced by SQYC granule. There was a clear separation between control (orange spots) and model group (green spots) in the multivariate analysis. Metabolites in SQYC and model groups had partial overlap in the PCA, but they were completely separated in orthoPLS-DA (Figure 6A). Compared to controls, MSS CRC challenge significantly increased 564 and decreased 444 metabolites. However, SQYC administration regulated the cancer metabolite profiles by up-regulating 127 and downregulating 320 metabolites compared to models (Figure 6B). There were 129 overlapping metabolites among significantly changed metabolites in the two comparison groups (Figure 6C). The hierarchical cluster of the differential metabolites (DEMs) clearly showed metabolite differences between the SQYC and model group (Figure 6D). Pathway analysis revealed that the metabolic pathways associated with choline, linoleic acid, glycerophospholipid and arachidonic acid were significantly altered (Figure 6E). Taken together, SQYC could regulate tumor metabolite profiles in MSS CRC mice, with a primary focus on lipid metabolism. Thus, we focused on the major plasma metabolites of above pathways using ELISA to detect the levels of glycerylphosphorylcholine (GPC), phosphatidyl cholines (PC), phosphatidylglycerol (PG), linoleic acid and arachidonic acid (AA). In Figure 6F, mice after the treatment of SQYC had higher levels of GPC (P=0.0427) and PC (P=0.0064). However, these mice had no significant changes in the levels of PG, linoleic acid or AA. These findings suggested that SQYC treatment could effectively enhance the activity of choline metabolism in MSS tumors.
SQYC regulated proteomic changes to enhance the anti-tumor effect of anti-PD-1 + anti-CTLA-4 antibodies
We next identified differentially expressed proteins (DEPs) by TMT-based proteomic quantitative analysis. A total of 7701 proteins were identified, of which 7108 proteins fulfilled the quantitative demands. We screened 99 significantly down-regulated proteins and 190 up-regulated proteins in SQYC group compared to model group and presented as a volcano plot in Figure 7A. Cluster analysis demonstrated the changes of differential protein expression levels between two groups (Figure 7B). GO and KEGG enrichment analyses were conducted to uncover the function of DEGs. As shown in figure 7C and D, GO enrichments depicted that the DEPs in SQYC group was principally associated with extracellular space, granzyme-mediated programmed cell death signaling pathway, muscle contraction, immunoglobulin receptor binding, extracellular matrix organization, collagen-containing extracellular matrix, extracellular matrix structural constituent. Moreover, KEGG pathway analyses indicated that SQYC-altered proteins were mainly involved in drug metabolism-cytochrome P450 and other enzymes, protein digestion and absorption, ECM-receptor interaction, arginine and proline metabolism, focal adhesion. Interestingly, SQYC also participated in some important pathways in cancer immune activity, including PD-L1 expression and PD-1 checkpoint pathway, neutrophil extracellular trap formation, natural killer cell mediated cytotoxicity, IL-17 signaling pathway, suggesting that SQYC might act as a potential MSS CRC immunotherapy regulator (Figure 7E-F). The top 25 connective proteins were selected and drawn as the PPI network, which mediate leading functions in SQYC treatment (Figure 7G). Thus, we postulated that SQYC exerted therapeutic effects through multiple targets regulation and immunity-related pathways
Figure 4
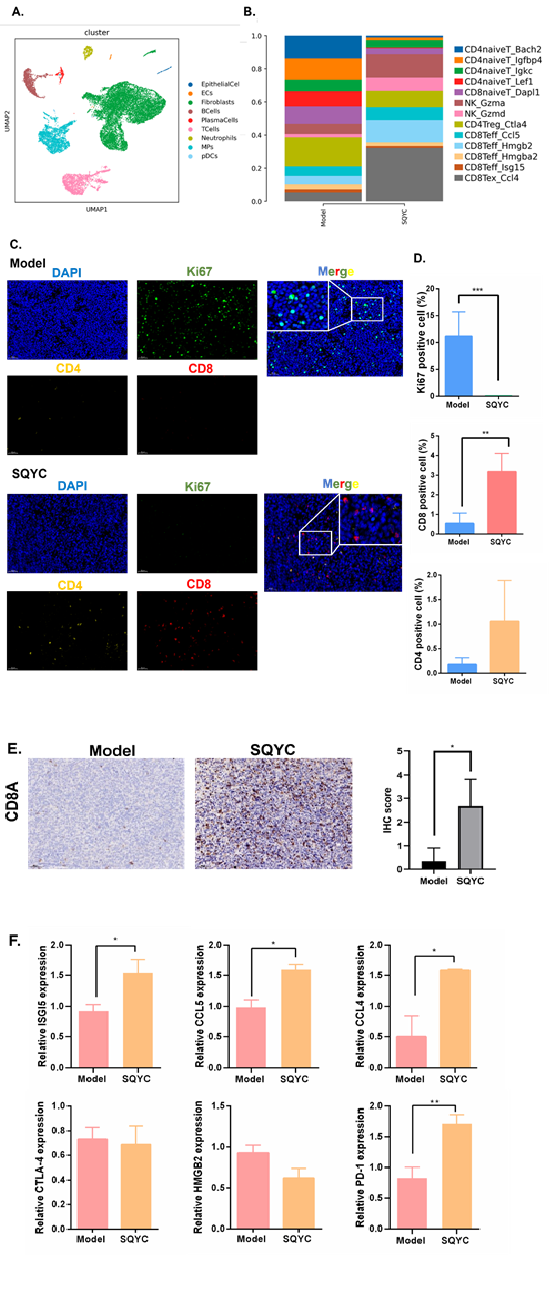
Figure 4: Landscape of integrated analysis of MSS CRC scRNA-seq data by SQYC treatment. A. UMAP plot of a total of 21153 cells, color-coded by cell type. B. Bar plot shows the proportion of each immune cell types. C. Representative multiplex immunofluorescence images (20X and 40X) demonstrating the expression of Ki67 (green), CD4 (yellow) and CD8 (red) in samples from Model and SQYC groups. C. The expression of CD8A in model and SQYC group, respectively. Scar bar=50µM. The IHC score was calculated by ImageJ software. D. The positive cells proportion of Ki67, CD4 and CD8 in tumor tissues. E. The infiltration levels of CD4+Treg cells, CD8+ Teff and CD8+Tex annotated by different genes. F. The differential expression of hub genes and canonical marker genes for major cell types CD8+T cells. *P<0.05, **P<0.01, ***P<0.001, compared to model group.
Figure 5
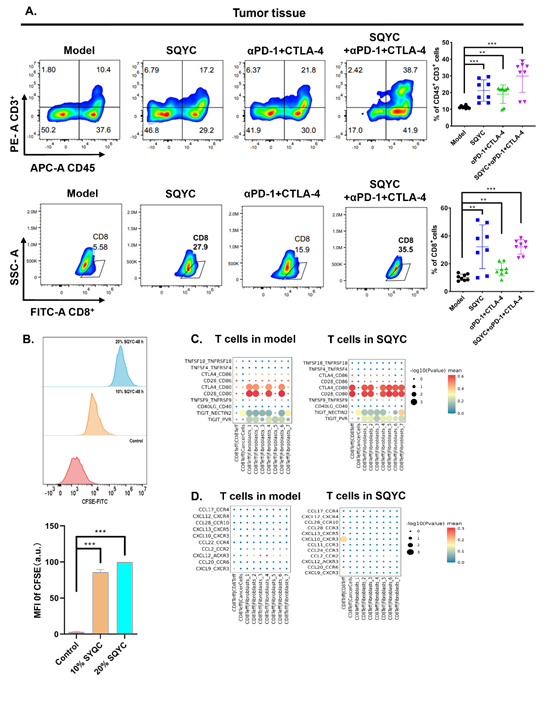
Figure 5: SQYC enhanced immune cells proportion in MSS CRC tumors and spleens. A. The infiltration levels of CD4+ and CD8+T cells in tumor tissues or spleen tissues depending on different treatments. B. The proliferation of CTLL-2 cells upon SQYC treatment (10% or 20% SQYC-mediated serum for 48h) by CFSE staining. C. The expression of surface checkpoints of T cells in tumor tissues from different groups. D. Chemokines levels in T cells. ***P<0.001 compared to Control group.
Figure 6
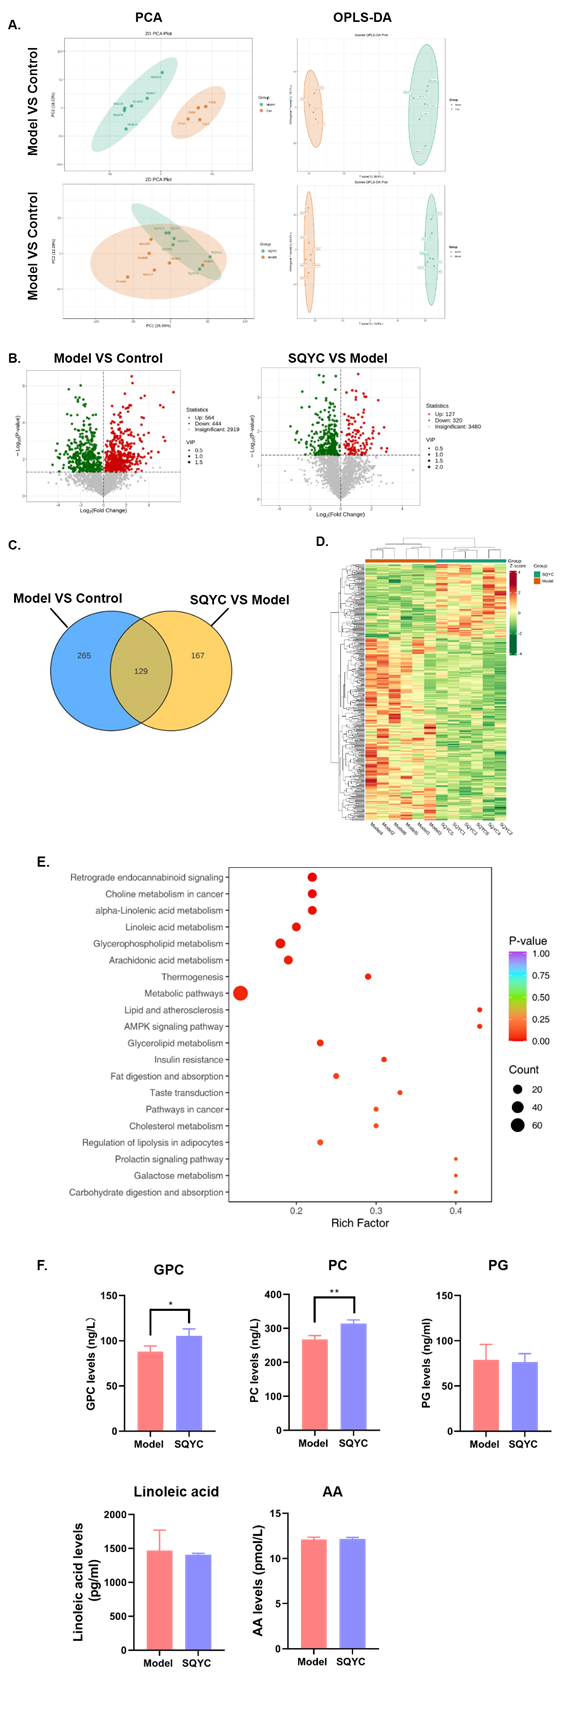
Figure 6: Identification of significantly altered metabolites by SQYC in MSS CRC mice. A. PCA and orthoPLS-DA analyses. B. Volcano plots of metabolite distribution when comparing model to control and SQYC to model. C. Venn diagram of overlap metabolites between two comparisons. D. Heatmap of DEGs by model and SQYC samples. E. KEGG pathways altered by SQYC. F. Bar graph of GPC, PC, PG, Linoleic acid and AA by ELISA on mice plasma. *P<0.05, **P<0.01, compared to model group.
Figure 7
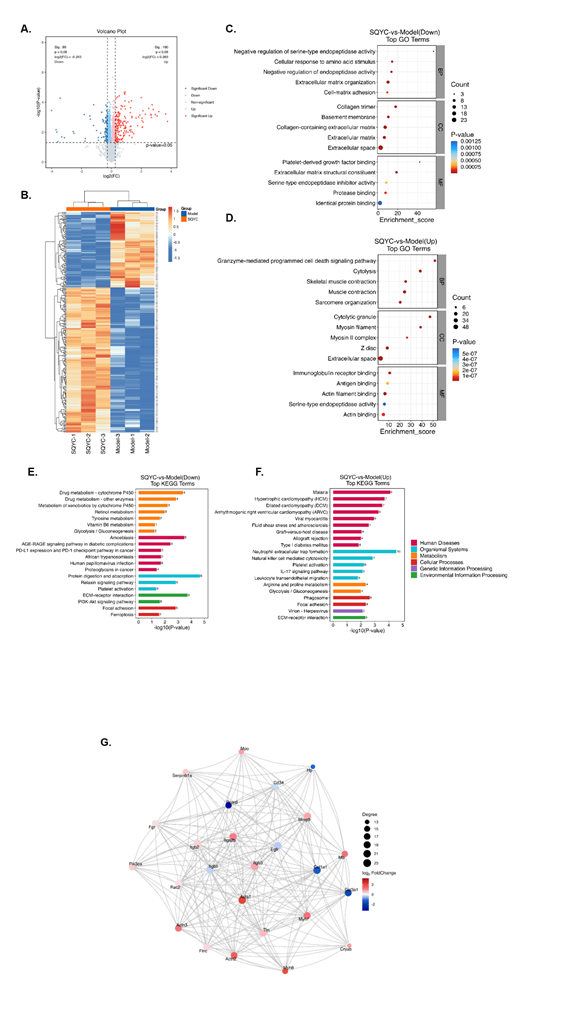
Figure 7: TMT-based proteomic analysis of DEPs in mice with SQYC treatment. A. Volcano plot of DEPs in SQYC groups VS model groups. Blue dots represented downregulation proteins, red dots meant up-regulated proteins, and gray dots showed proteins with no statistically significance. B. Heatmap of altered DEPs between SQYC and model groups. Red referred to upregulation proteins, while blue to downregulation ones. C. GO analysis of down-regulated proteins. D. GO analysis of up-regulated proteins. E. KEGG analysis of down-regulated proteins. F. KEGG analysis of up-regulated proteins. G. PPT network of top 25 key proteins.
Discussion
Cancer immunotherapies, represented by ICIs is undergoing continuous alternations and evolution in their microenvironment to trigger limited efficacy [36]. PD-1/PD-L1 and CTLA-4 are the most common and promising targets in ICIs, cause the dual therapy can operate at different stages of T cell activation to enhance immune responses against various cancers [37]. For MSS CRC, clinical trials tested the efficacy of ipilimumab (CTLA-4 inhibitor) plus nivolumab (PD-1 inhibitor), historically has shown no effect [25-38], is hard to settle the limitation [39]. Therefore, breaking the limitation of dual ICI combination therapy heralds a new direction for MSS CRC immunotherapy research. Although low cytotoxic CD8+T cell infiltration is a major reason for the limited effectiveness of ICIs in most MSS CRC [40], the research progress in the utilization of immunotherapy has been very limited.
TCM has been used for thousands of years to treat various diseases [41], and it gains globe attention since Youyou Tu awarded the Nobel Prize. SQYC granule is a classic TCM for CRC in clinic with good results. In has been proven that SQYC is effective in enhancing anti-tumor immune ability in CRC patients [42]. Herein, we investigated the anti-tumor effect of SQYC combined with anti-mouse PD-1 and anti-mouse CTLA-4 in CT26 orthotropic MSS CRC model. The in vivo observation indicated that SQYC granule and dual ICIs anti-mouse PD-1 and anti-mouse CTLA-4 combination therapy was greater than that of monotherapy with either SQYC or anti-mouse PD-1 plus anti-mouse CTLA-4 and without obvious side effects. This finding demonstrated that SQYC significantly enhanced the anti-PD-1 and anti-CTLA-4 combination immunotherapy in MSS CRC.
Since CD8+T cells accumulated around the tumor and exhibited a dysfunctional phenotype which causes the low response of anti-PD-1 and anti-CTLA-4 antibodies in MSS CRC [43]. Based on the above outstanding findings, we provide the first comprehensive histologic characterization and activity of SQYC granule in MSS CRC to clarify the mechanisms of multi-component, multi-target agents by network pharmacologic screening, single cell RNA sequencing, metabolic and proteomics analysis. The analysis highlighted that SQYC has 11 significant targets in MSS CRC and enhances immunotherapy efficacy by increasing the CD8+T effect cells infiltration. Studies also mentioned that the stimulation of CD28 on T cells can bind to CD80 on APCs (antigen-presenting cells) to boost CD8+ T cell proliferation, function and anti-tumor immunity [44]. Thus, we further analyzed the immune checkpoint ligands of CD28 and CD80 expression, the results showed that in SQYC-treated tumors, the CD8+T effector cells exhibited high abundant of CD28/CD80, suggesting the anti-tumor function of treated-CD8+T effector cells were activated. Meanwhile, we found the co-stimulation of CTLA-4/CD80, but not CD86, was also increased in CD8+T cells in SQYC. It has been reported that CD86 blockade could prevent the T regulator cells response, promote CD8+cytotoxic T cell priming and tumor control [45]. CTLA-4 acts as a negative regulator of T cells responses, CD80 engagement drives CTLA-4 ubiquitylation degradation to inhibit regulatory T cell function [46]. Our findings indicated that SQYC-induced CD80 enrichment increased CD8+T effector cells proliferation and cytotoxic functions, hampered the induction of Treg response. On the other hands, the excessive activation of T cells was exhibited in mice when lacking CTLA-4 receptor [47], maybe this is the reason why plenty of CD8+T exhausted cells were found in SQYC group. Conversely, another study indicated that exhausted CD8+T cells include a subpopulation of ‘progenitor exhausted’ cells that retain polyfunctionality, which mediate tumor control and respond to checkpoint blockade [34]. Thus, how to balance the activated levels of CD8+T cells maybe a potential research project in our future work. Additionally, our results demonstrated the enrichment of CXCL10/CXCR3 in SQYC-treated CD8+T cells, which plays important roles in the migratory of effector T cells [35]. Overall, our findings indicated that SQYC exhibited anti-tumor immunity possibly by enhancing CD8+Teff cell infiltration, activation and the adhesion with tumor cells through CD28/CD80 co-stimulation and CXCL10/CXCR3 axis.
The metabolic reprograming also impacts tumor immune [48]. In our work, the GO and KEGG analysis indicated that Arginine biosynthesis is the major metabolism pathway involved in SQYC regulation. The appropriate supply of arginine is associated with immune responses improvement [49], especially macrophage, dendritic cell and T cell immunobiology. Our previous studies have proved that CRC was developed via PI3K/AKT signaling pathway [50]. This pathway was reported to regulate arginine biosynthesis in CRC and pancreatic cancer carcinogenesis [51,52]. The arginine metabolism has been studied in ouranother work. Furthermore, other alternations of metabolisms were also observed in SQYC-treated group, compared to model ones, mainly choline, linoleic acid, glycerophospholipid and arachidonic acid metabolism. Choline is an important nutrient related to one-carbon metabolism and CRC risk [53]. Notably, Yin’s team found that the uptake of choline reduced CRC growth by stabilizing p53 protein [54]. Other research reported that the decrease of choline import raised oxidative stress and cancer cell proliferation [55]. In the present of linoleic acid, CRC migration, colony formation, and proliferation decreased [56].Latest study indicated that glycerophospholipids might not impair CRC tumor cells directly, but affect the activation of CD8+T cells [57]. While, Liao et al found that low dose of arachidonic acid promoted tumor ferroptosis and immune checkpoint blockade (ICB)-induced anti-tumor immunity [58]. This evidence combined with our data revealed that SQYC granule inhibited MSS CRC not only by suppressing tumor cell growth directly, but could also affect anti-tumor immune cells by metabolisms.
The proteomics analysis clearly indicated the SQYC was involved in the downregulation tumor growth related pathways, such as extracellular matrix organization, ECM receptor interaction and focal adhesion [59], as well as PD-L1 expression in cancer. However, treated with SQYC increased anti-tumor immune cells functions, like Granzyme-mediated programmed cell death signaling pathway, natural killer cell mediated cytotoxicity, IL-17 signaling pathway, which can promote CD8+T cell tumor infiltration to control CRC [60]. This result indeed confirmed that SQYC could inhibit MSS CRC via promoting anti-tumor immunity.
In this work, we only comprehensively uncovered the main active ingredients, differentially expressed genes and the important associated signaling pathway regulated by SQYC, briefly verified the related genes, proteins and metabolites. Further deeply studies are needed to investigate how SQYC regulates these pathways to be beneficial for anti-tumor environment, especially to the proliferation, activation of immune cells.
Conclusion
To sum up, our findings revealed that SQYC granule is a potential traditional Chinese medicine to suppress MSS CRC, promote immunotherapy efficacy, boost tumor immune cells infiltration and functions. In the future, deeply investigation could be performed to uncover the benefit of SQYC granule on MSS CRC lipid metabolism and associated protein modification. The effect of SQYC in T cell exhaustion is also worthy to be analyzed.
Authors’ contributions
Shan Deng designed and carried out the experiment, also analyzed the data and wrote the draft of the manuscript. Xi Chen, Yuping Liu and Ziqi Shi carried out the animal experiments and LC/MS. Jialin Yu, Yi Ji, Linchang Li revised the manuscript. Jiege Huo supervised the project and provided funding support. All authors have read and agreed to publish the manuscript.
Funding
This work was financially supported by the National Nature Science Foundation of China [grant number: 82305348], Jiangsu Clinical Innovation Center of Digestive Cancer of Traditional Chinese Medicine [grant number: No. 2021.6], Project of National Clinical Research Base of Traditional Chinese Medicine in Jiangsu Province [grant number: JD2023SZX02], Medical Scientific Research Key Project of Jiangsu Provincial Health Commission [grant number: ZD2022020].
References
12. Kalyan A. Updates on immunotherapy for colorectal cancer. J Gastrointest Oncol. 2018; 9: 160-169.
25. Morano.Temozolomide Followed by Combination With Low-Dose Ipilimumab and Nivolumab in Patients With Microsatellite-Stable, O(6)-Methylguanine-DNA Methyltransferase-Silenced Metastatic Colorectal Cancer: The MAYA Trial. J Clin Oncol. 2022; 40: 1562-1573.
37. Ribas A, Wolchok JD. Cancer immunotherapy using checkpoint blockade. Science. 2018; 359: 1350-1355.
38. Le DT. PD-1 Blockade in Tumors with Mismatch-Repair Deficiency. N Engl J Med. 2015; 372: 2509-2520.


