Regional Policies on Sugar Intake Reduction at Population Levels to Address Obesity in the Eastern Mediterranean
- 1. Department of Non-Communicable Diseases and Mental Health, World Health Organization (WHO), Egypt
- 2. Department of Nutrition and Food Science, American University of Beirut, Lebanon
Abstract
Sugar intake was reported to be associated with the increase in body weight and adiposity as well as several non-communicable diseases (NCDs). This relationship has highlighted the importance of reducing sugar consumption among all populations, especially those who experience nutrition and dietary transitions. The Eastern Mediterranean Region (EMR) was described to have the highest increment of sugar intake over the past few decades, and this paralleled increased rates of obesity, dental and oral health problems, and others NCDs. The WHO – EMRO developed a very strict regional policy to reduce sugar intake, which requires a major change in food intake patterns. In brief, sugar supply (kg/year or energy %) in EMR seems to be relatively close to that of Europeans and Americans and this is further compounded by a massive intake of refined carbohydrates that mainly consist of milled cereals, specifically rice and wheat (double that of EU and America). Thus, recommendations should address both sugar and refined carbohydrate for fruitful results. This review discusses sugar recommendations, availability and intake as well as other sugar-related topics in countries of the EMR. It is always believed that life becomes sweeter without adding sugar!
Keywords
• Sugar; Refined Carbohydrates; Supply; Availability; Intake
Citation
Al Jawaldeh A, El Mallah C, Obeid O (2018) Regional Policies on Sugar Intake Reduction at Population Levels to Address Obesity in the Eastern Mediterranean. JSM Nutr Disord 2(1): 1006.
INTRODUCTION
Sugar intake has increased over the past few decades and has become an important contributor to the daily total energy intake. Although sugar per se does not cause direct harm to the human body, it is known to increase daily energy intake and thus contribute to increased body weight and fatness [1-4], an underlying condition of several health problems such as diabetes [5] and hyperlipidemia [6].
Additionally, sugar intake is the fundamental cause of tooth decay that affects children with their first set of teeth and carries on inducing serious dental erosion and decay throughout life, i.e. into the eighth decade of life. In fact, sugar is considered cariogenic as its fermentation creates acidic conditions which increase risks of dental decays [7]. Caries is not only one of the most costly diseases affecting countries, but it also induces infections in children leading to emergency hospital admissions. It also impairs their physical growth and their attendance and learning ability at school [8].
Further correlations between sugar intake and different diseases have been studied and yielded different outcomes. Multiple correlations and regression analyses showed that higher sugar consumption worsens schizophrenia and is associated with greater prevalence of depression [9].
Several authors described nutrient inadequacy when sugar intake increases, yet the data are controversial. A poor diet, low in nutrients and highly caloric was correlated to high intake of refined carbohydrates, defined as free sugars and refined starchy foods namely refined cereals [10], which raises the energy density and decreases nutrient density [11]. The refinement process of cereals is known to decrease the fiber content by more than 50%; however, the loss of nutritious compounds was described to go beyond the ones of fibers [12]. A milled grain retains less than 70% of the initial micronutrients (like phosphorus and vitamin B6) that are believed to support carbohydrate metabolism. Thus, dietary patterns that heavily depend on refined carbohydrate (sugars and refined cereals) and other low nutrient foods increase the risk of the onset of obesity [13] and other metabolic abnormalities such as non-communicable diseases (NCDs). In fact, refined cereals constitute a larger proportion of our daily energy intake, especially in heavy cereal-consuming communities [14-16], like ours. Therefore, they form stronger determinants of health problems. For instance, refined carbohydrates were accused to cause more cardiovascular harm than saturated fats [17].
Nevertheless, high sugary foods are reported to substitute nutritious foods; whole grain cereals are replaced by milled cereals and sugar-sweetened beverages like sodas and fruit flavored juices replace milk and dairies specially among children. Hence, high calcium, phosphorus and B-vitamins products are exchanged for high sugar and zero nutrient products.
Consuming too many foods and drinks rich in sugar increases the concentration of energy per unit weight in foods, which means that, given the less effective brain regulatory systems for preventing weight gain rather than weight loss, children and adults, particularly if they are genetically sensitive, will gain weight [18]. A high level of free sugars intake increases energy intake without children and adults realizing; it is also associated with a poor quality diet, which is often short in important nutrients.
Sugar in many forms of drinks, i.e. soft drinks, etc. on the basis of clinical trials and some longitudinal studies leads to a greater likelihood of weight gain [19,20]. These products are energy-rich and seem to evade the normal brain regulatory processes to an even greater extent than energy-rich foods. So, energy-rich drinks are particularly conducive to weight gain. Attempts to replace sucrose with low-calorie artificial sweeteners did not show impressive results. Artificially sweetened drinks also seem to increase the risk of diabetes but mainly by promoting weight gain and obesity. The UK Government’s Scientific Expert Committee report also assessed these drinks in relation to the development of diabetes and found a clear link to the development of diabetes independent of weight gain [21].
This association between the worldwide increase of NCDs and sugar supply and consumption emphasizes the importance of reducing sugar intake, especially in areas where nutrition transition was highlighted. Policy-makers and program managers in EMR are advised to assess current free sugar intake levels and their sources in both foods and drinks. They should also consider the development of nationwide measures that aim at transforming the food chain in their country [22]. The fact that, refined carbohydrates (sugars and refined cereals) constitute more than 60% of our daily energy intake, necessitate the adoption of policies and measures that target all for optimal outcomes, since free sugars alone solve a small fragment of the problem.
The objective of this review is to provide an updated summary on sugar consumption in the EMR and to suggest strategies that help countries decrease their intakes, abiding by the new recommendations. This report sheds a light on the importance of sugar metabolism rather than just intake; which would be of high interest to promote health-conscious populations.
METHODS
Literature search
Online database on sugar intake in the EMR (a total of 22 countries) were accessed on July 2015 using Pub Med, AUB libraries, and Good Scholar. The terms used to search data were “Sugar” OR “Sweet” OR “Dessert” OR “Sweetened Beverages” OR “Dietary Pattern” AND/OR “Intake” OR “Consumption” AND “EMRO” OR “EMR” OR the name of the country e.g. “Lebanon”.
Additional data are retrieved from the WHO Regional Office of the Eastern Mediterranean (http://applications.emro.who.int/ library/Databases/wxis.exe/Library/Databases/iah/). Books, national/regional reports, guidelines, and website of scientific associations e.g. AHA, are also visited.
Data extraction
Relevance was decided upon reading the title and the abstract. Irrelevant papers are excluded and all related ones are entirely read and data are retrieved as needed. Although our target was to collect national studies that are representative, small scale studies were also included because the national ones were rare and very hard to find.
DEFINITION AND SOURCES OF SUGAR
Definition of sugar
Varied terminologies around the world are used to define “sugars”. The supplementary table (Table S1) lists different definitions and categories of sugars according to several references. In general, the terms “sugar” or “free sugar” or “added sugar” are found in studies that assess sugar intake among populations and they mainly mean the amount of sucrose added to food and beverages during processing or preparation.
Table S1: Different definition of sugar.
|
Reference |
Term |
Definition |
|
FAO/WHO (WHO, 2015) [37]
|
Free sugars |
Monosaccharides and disaccharides added to foods and beverages by the manufacturer, cook or consumer, and sugars naturally present in honey, syrups, fruit juices and fruit juice concentrates. |
|
Total sugars |
Free sugars + intrinsic sugars + milk sugars.
|
|
|
Dietary Guidelines for Americans, 2015-2020[39] |
Added sugars |
They include syrups and other caloric sweeteners that are added to foods and beverages to sweeten them; they add calories without contributing essential. |
|
Institute of Medicine, 2005 [71] |
Added sugars |
Sugars and syrups that are added to foods during processing and preparation. Specifically, added sugars include white sugar, brown sugar, raw sugar, corn syrup, corn-syrup solids, high-fructose corn syrup, malt syrup, maple syrup, pancake syrup, fructose sweetener, anhydrous dextrose, and crystal dextrose. They do not include naturally occurring sugars such as lactose in milk or fructose in fruits. |
|
NCHS, 2013 [72] |
Added sugars |
All sugars used as ingredients in processed and prepared foods such as breads, cakes, soft drinks, jams, chocolates, and ice cream, and sugars eaten separately or added to foods at the table. Examples of added sugars include white sugar, brown sugar, raw sugar, corn syrup, corn syrup solids, high fructose corn syrup, malt syrup, maple syrup, pancake syrup, fructose sweetener, liquid fructose, honey, molasses, anhydrous dextrose, crystal dextrose, and dextrin |
|
Committee on Medical Aspects of Food Policy, 1991 [73] |
Added sugars |
Non-milk extrinsic sugars e.g. sucrose, glucose and fructose, and sugars naturally present in fruit juices, e.g. glucose and fructose
|
|
European Food Safety Authority, 2009 [74]
|
Total sugars |
Include both indigenous (sugars naturally present in foods such as fruit, vegetables, cereals and lactose in milk products) and added sugars. |
|
Added sugars |
Refer to sucrose, fructose, glucose, starch hydrolysates (glucose syrup, high-fructose syrup, isoglucose) and other isolated sugar preparations used as such, or added during food preparation and manufacturing. |
|
|
Committee on Medical Aspects of Food Policy, 1989 (Food Standards Agency Scotland, 2008) [75]
|
Sugars |
Intrinsic sugars (sugars forming an integral part of certain unprocessed foodstuffs, i.e. enclosed in the cell, the most important being whole fruits and vegetables) and extrinsic sugars (milk sugars and Non-milk extrinsic sugars, which includes fruit juices, honey, and added sugars).
|
|
Added sugars |
Comprise both recipe sugars and table sugars.
|
|
|
Free sugars |
Non-milk extrinsic sugars which includes fruit juices, honey, and added sugars.
|
Table S2: Sugar intake in Eastern Mediterranean countries.
|
Country |
Reference |
Year |
Sample Size |
Age Group |
Type-Design |
Method |
Findings |
Comment |
|
Afghanistan |
Central Statistics Organization (2014) [76] |
2011-2012 |
21,000 |
0-85+ years |
Two-stage cluster design |
7 day food consumption recall |
|
This is according to the food commodity status |
|
Bahrain |
Gharib & Rasheed, 2011 [77] |
1999-2001 |
2,562 |
6-18 years |
Cross-sectional descriptive study using A multi-stage sampling design |
24-h dietary recall |
|
Intrinsic and extrinsic sugars are accounted in this study |
|
Musaiger et al., 2011 [78] |
2006 |
735 |
15-18 years |
Cross-sectional study multi-stage stratified random sampling |
self-administered questionnaire |
|
- |
|
|
Djibouti |
WFP, 2011 [79] |
2011 |
1,251 households |
All |
Two-stage random sampling |
Household questionnaire |
|
- |
|
Egypt |
Tayel et al., 2013 [52] |
2010 |
300 of which 175 are normotensive |
12-18 years |
Comparative cross-sectional study |
food frequency questionnaire |
|
This study included only students living in Sohag |
|
Abdel-Hady et al., 2014 [41] |
2010 |
927 |
15-20 years |
Cross-sectional study |
self-administered questionnaire |
|
This study included only students living in Mansoura |
|
|
Iran |
Bazhan et al., 2013 [53] |
- |
400 girls |
14-17 years |
Cross sectional study |
24-hour dietary recall, food habits and food frequency questionnaires |
|
This study included only students from public and private schools in Lahijan |
|
Hejazi & Mazloom, 2009 [55] |
2007 |
84 |
12-16 years |
- |
Three 24 h diets recalls (one weekend and two week days) |
|
This study included only adolescents living in Shiraz |
|
|
Khosravi-Boroujeni et al., 2012 [54] |
1999-2006 |
1,752 |
19+ years |
Cross-sectional study |
Food frequency questionnaire |
|
Recruited people lived in Isfahan, Najafabad and Arak |
|
|
Iraq |
WFP, 2008 [80] |
2007 |
25,875 households |
- |
Food Security Survey Random cluster sampling |
Questionnaire |
|
- |
|
Jordan
|
Alwan & Kharabsheh, 2006 [42] |
2002 |
- |
- |
Nationwide cross-sectional population survey was conducted using multistage cluster sampling design |
- |
|
Retrieved from: DoS, Household Income and Expenditure Survey, Jordan, (1992-1997-2002), source not found
|
|
Bawadi et al., 2014 [81] |
- |
750 |
22-84 years |
Cross-sectional study |
Semi-quantitative food frequency questionnaire
|
|
This study only included type 2 diabetic subjects |
|
|
Sayegh et al., 2002 [82] |
|
1,140 |
4 and 5 years |
Two-stage sampling procedure |
Questionnaire |
|
This study only included kindergartens in Amman. |
|
|
Kuwait |
Kamel & Martinez, 1984 [83] |
- |
500 |
Adults |
Systematic study |
24-hour recall |
|
|
|
Al-Ansari, 2006 [84] |
|
588 |
8, 13 and 17 years |
|
Questionnaire |
|
The selection was made in a specific region in Kuwait |
|
|
Lebanon |
Nasreddine et al., 2006 [57] |
2001 |
444 |
25–54 years |
Across-sectional dietary survey |
Quantitative food-frequency questionnaire
|
|
The sample only included people living in Beirut |
|
Baba, 1998 [85] |
- |
- |
- |
- |
- |
|
Data from Cowan et al., 1964 |
|
|
Libya |
Huew et al., 2014 [86] |
- |
180 |
12 years |
Randomly selected sample |
3 d food diary |
|
The study involved students living in Benghazi, the second largest city in Libya
|
|
Morocco |
Benjelloun, 2002 [43] |
1984-1985 |
41,526 |
20+ years |
National survey |
- |
|
Retrieved from Direction de la Statistique, 1992
|
|
La direction de la statistique, 2001 [87] |
2000-2001 |
14,243 |
10+ years |
National survey |
Questionnaire |
|
The data excluded sugars and honey in desserts and sweets
|
|
|
Oman |
Musaiger, 1996 [88] |
1988-1991 |
- |
Children and mothers |
This is based on several rapid assessment surveys |
Questionnaire A qualitative 24 hour dietary recall |
|
These studies were performed on people living in Muscat |
|
Pakistan |
Gallup & Gilani, 2011 [89] |
- |
These surveys range from 1000-2500 men and women |
18+ years |
National survey Multi-stage area probability sampling |
Questionnaire |
|
The results presented here are from multiple nationwide house hold surveys carried out by Gallup and Gilani over the last three decades (1980-2010)
|
|
Hakeem et al., 1999 [90] |
1995 |
180 |
10-12 years |
|
Three-day estimated diet records
|
|
|
|
|
Palestine |
Stene et al., 1999 [44] |
1996-1997 |
500 |
30 - 65 years |
Community-based cross-sectional survey |
Short food-frequency questionnaire 24-h recall without |
|
The results describe the patterns of Palestinian West Bank village population |
|
Alzain, 2012 [91] |
|
150 |
24-62 months |
|
Dietary survey: food consumption frequency and daily dietary recall for three consecutive days
|
|
The study was carried out three communities( Beit hanon , Jabalia and Beit lahia |
|
|
A2Z project, 2010 [92] |
2009 |
366 345 |
Children 3-7 years Women 18-50 years |
Cross-sectional population study following a multi-cluster random sampling |
Questionnaire multiple pass 24-hour recall
|
|
The sample was recruited from Hebron and Gaza City |
|
|
Qatar |
Hassan & Al-Dosari (2008) [45] |
2004 |
259 |
9-10 years |
Cross-sectional survey on a random sample |
Questionnaire on food frequency, food habits and types of foods |
|
Visited schools were in Doha city |
|
Saudi Arabia |
Al-Tamimi & Petersen, 1998 [58] |
1995 |
240 240 |
6 years 12 years |
- |
Questionnaire |
|
The study was carried out in Madina City |
|
Collison et al., 2010 [93] |
2007 |
9,433 |
10-19 years |
Cross-sectional study |
Food Frequency Questionnaire |
|
The recruitment was done in different regions of the capital city of Riyadh |
|
|
Somalia |
- |
- |
- |
- |
- |
- |
- |
- |
|
Sudan |
Nazik et al. 2013 [59] |
2007-2008 |
1109 |
12 years |
School-based survey two-stage probability proportional to size cluster sampling technique |
Food Frequency Questionnaire |
|
Students attended public and private schools in 7 main localities in Khartoum |
|
Syria |
Musaiger & Kalam, 2014 [94] |
2012 |
365 |
15-18 years |
Cross-sectional multi-stage stratified sampling |
Questionnaire |
|
The sample was selected from Damascus |
|
Jaghasi et al., 2012 [47] |
2010-2011 |
504 |
6–12 years |
- |
Food frequency questionnaire |
|
The students were selected from 4 geographical areas with diverse socioeconomic characteristics in Damascus city |
|
|
Tunisia |
Aounallah-Skhiri et al., 2011 [95] |
2005 |
1,019 |
15-19 years |
Cross-sectional survey |
Semi-quantitative frequency questionnaire |
|
Adolescents were chosen from three regions of Tunisia |
|
United Arab Emirates |
Jacob et al., 2003 [96] |
- |
125 |
3-15+ years |
Cross-sectional study |
Questionnaire |
|
The study was performed on University students in Ajman, UAE
|
|
Bin Zaal et al. (2009) [60] |
- |
661 |
12-17 years |
Cross-sectional study |
Questionnaire |
|
The sample was selected from between different geographical areas of Dubai
|
|
|
Yemen |
WFP, 2014 [97] |
2014 |
10,500 households 15,800 women 13,400 children |
- |
Two-stage stratified sampling technique |
- |
|
This is a food security survey |
Sources of sugar
Globally, 86% of sugar supply comes from sugar cane, which is produced by few counties with tropical climates [23]. Sugar production decreased in the past four years despite the increase in consumption and raised its price.
Americans are known to consume a significantly high amount of sugars. Their main “food providers” of sugars are soft drinks, table sugar, candies, cakes, cookies, pies, and fruit drinks followed by milk based desserts such as ice cream, sweetened yogurt, and others [24].
SUGAR PRODUCTION, IMPORT, EXPORT AND SUBSIDIES IN THE REGION
Sugar is considered an important low cost contributor of energy intake. Almost all countries have high import dependency (Table 1), which makes sugar relatively costly. Several EMR countries (Egypt, Iran, Pakistan and Sudan,) are known to produce significant amount of their need, while remaining countries depend on import. In addition, several countries are known to subsidize sugar prices, keeping it an affordable source of energy especially among poor populations. Below is a list of countries that have policies to support sugar subsidies (Table 2).
RECOMMENDATIONS
The WHO report, issued in 2015, suggested new recommendations for sugar consumption. Strong evidence supports reducing free sugar (that is monosaccharide’s and disaccharides added to foods and beverages, as defined by FAO/ WHO, 2015, refer to Table S1) intake to less than 10% of the daily total energy intake, in both adults and children. A further reduction to less than 5% is advised yet considered conditional [37]. Individuals who consume less than the recommendations should not increase their intakes to reach the 10%.
These percentages do not provide a clear picture if the total energy intake exceeds the acceptable ones. In this framework, the World Cancer Research Fund International (WCRFI), in accordance with the WHO recommendations, calculated a recommended amount of sugar intake. A person should have no more than 50 grams daily (10% based on a 2000 kcal diet), which are equivalent to 6 teaspoons of sugar. A further decrease of fewer than 25 grams (5% based on a 2000 kcal diet) is of additional health benefits, suggested the WCRFI [23].
Lower recommendations were advised by the American Heart Association [24] that blames sugar for contributing to the obesity endemic in the United States; no more than 100 kcal/d for women and 150 kcal/d for men are suggested.
European guidelines, European Food Safety Authority (EFSA) and Committee on Medical Aspects of Food Policy (COMA), recommend an average intake of added, non-milk extrinsic sugars, that does not exceed 10%.
Different percentages were also suggested; added sugars should be no more than 5% of free sugars and10% of added sugars of total food energy according to the UK Food Standards Agency [38] and the dietary guidelines for Americans [39], respectively.
WHO – EMRO developed a policy statement and action plan in sugar reduction [22], based on the WHO guidelines, taking in consideration energy intake per person a day exceeds 2000 kcals in all countries of the Region, with almost half the countries reaching or almost reaching 3000 kcals a day [21]; therefore, average sugar intakes should fall by more than 50% for both children and adults, or to less than 5% of food energy , equivalent to less than 35 grams per day for men and less than 25 grams per day for women and children [22].
SUGAR SUPPLY AND INTAKE IN THE REGION
The EMR has been witnessing several nutrition transitions which have affected the quality of the diet of the Middle Eastern population. The Region has the fastest growth in sugar consumption globally and this dietary transition has markedly reduced the quality of the diet among the population [21,25]. These changes in dietary patterns have favored higher sugar intakes and the increment of sugar consumption between 2000 and 2007 was classified the largest amongst all WHO regions (Figure 1).
![Trend of the sugar consumption in the six WHO regions from 2000 to 2007, retrieved from Khan, 2011 [25].](https://www.jscimedcentral.com/public/assets/images/uploads/image-1704714626-1.png)
Figure 1: Trend of the sugar consumption in the six WHO regions from 2000 to 2007, retrieved from Khan, 2011 [25].
This alarming situation highlights the importance of a rapid country-base evaluation.
AFRO: Africa Regional Office
AMRO: Americas Regional Office
EMRO: Eastern Mediterranean Regional Office
EURO: Europe Regional Office
SEARO: South East Asia Regional Office
WPRO: Western Pacific Regional Office
Sugar supply: amounts, percentages and trends in the region
Based on the FAO stat 2017, data on sugar supply per capita of all the Eastern Mediterranean countries, except Bahrain, Libya, Palestine, Qatar, Somalia, and Syria which were missing, were drawn in Figures 2 and 3.
Figure 2: Sugar supply (g/capita/d) in the Eastern Mediterrnean countries in 2013, data from FAO stat, 2017.
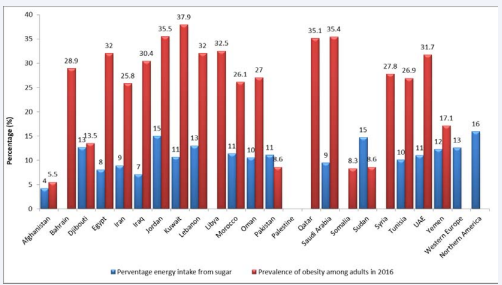
Figure 3: Percentage energy intake from sugar (blue) in the Eastern Mediterrnean countries in 2013, data from FAO stat, 2017and pervalence of obesity among adults (red). Data in FAO are missing for the following countries: Bahrain, Libya, Palestine, Qatar, Somalia, and Syria. The red and green lines show equivalent amounts of the recommended 10% and 5% of a daily energy intake based on a 2000 kcal diet.
The sugar supply (g/day) of all EMR countries was lower than that of North America (145.8 g/day) and only Jordan had a supply that exceeded that of Western Europe (109.5 g/day). According to the WCRFI recommendations (50 g/day), only Afghanistan and Iraq had appropriate sugar intake (Figure 2). However, if 20% allowance for wastage was factored, which is known to better reflect intake, Yemen, Sudan and Pakistan would have been very close to the WCRFI recommendation.
The percentage energy intake from sugar of all EMR counties was lower than that of North America (15%), while few countries like Djibouti, Jordan, Lebanon, and Sudan had similar values to Western Europe (13%). Six countries (Kuwait, Morocco, Oman, Pakistan, Tunisia, and Emirates Arab United) had a value close to 10%, while five countries (Afghanistan, Egypt, Iraq, Iran and Saudi Arabia) were below the WHO cutoffs (Figure 3).
In order to build an idea on the trend of sugar availability, we looked at sugar supply of four countries with different levels of income. In brief, the trend of sugar supply doesn’t seem to be associated with the economic status and country income (Figure 4).
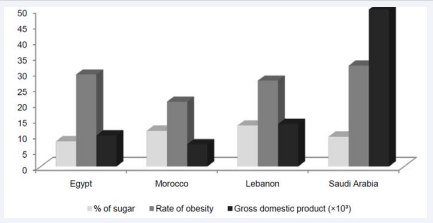
Figure 4 Sugar supply (kcal/capita/d), rate of obesity, and gross national product Egypt, Lebanon, Morocco, and Saudi Arabia between 2013 and 2015, data from FAO stat 2017
Gross domestic product per capita, PPP (constant 2011 international $)
Prevalence of obesity in the adult population (18 years and older)
The average sugar consumption in the Region is lower while the prevalence of obesity, reflecting also the prevalence of NCDs, is higher than the ones in Europe and American. This further confirms the suggested hypothesis that sheds the light on the poor nutrient support of carbohydrate metabolism and thus to refined carbohydrate intake rather than sugar intake. Figure 3 also proves that obesity is not only dependent on sugar intake; Kuwait, the region with the highest prevalence of obesity is not the one with the highest sugar consumption. In parallel, Sudan, with a low obesity rate is amongst the countries that have the highest intake.
Sugar intake in the Region
The Eastern Mediterranean countries do not only share the same geographical location but also have similar cuisine, traditional foods, and dietary habits.
Data that show major sources of sugars, whether added or naturally occurring, were not available for the EMR. Some papers and reports describe the main sources of sugars in the EMR as the following: soft drinks, sweetened tea, canned juice and fruit flavored drinks, chocolate, candies, and Arabic sweets.
However, some country-related dietary and cultural habits as well as some small-scale studies have helped in drawing a clear picture.
Tea is considered the main traditional beverage in almost all countries of EMR [40-47], and the main source of cane sugar in several countries [48,49]. Black tea is usually consumed hot with a considerable amount of table sugar that usually exceeds two teaspoons per serving. Tea consumption is common at all times, with breakfast, dinner, between meals, and at night. It is well known that some dietary habits target specific age range (e.g. soft drinks are mostly consumed by children and adolescents); however, tea in the EMR does not spare any age category even young children [50,51].
Data are missing for the following countries of the EMR: Bahrain, Libya, Palestine, Qatar, Somalia, and Syria. A subtraction of 20% of the present numbers (due to wastage) is a better reflection of intake. The red and green lines show equivalent amounts of the recommended 10% and 5% of a daily energy intake based on a 2000 kcal diet.
The relatively high temperatures that reign the region favors the intake of cold sweetened beverages such as soft drinks and fruit-flavored drinks [40,48,52-60]. The food westernization witnessed by the region has dramatically increased the intake of these beverages which are not part of the dietary heritage of the region.
Socializing over sweets is a tradition among Eastern Mediterranean populations especially Arabs. Even the most routine daily situations such as lunch or dinner invitations include the consumption of sweets. Thus, daily high intake of sugar is expected to be part of the cultural habits of the region.
Other sources of sugar are chocolate, biscuits, and candies. These items, sold in schools, are mainly highly consumed by students because they do not require specific conditions for preservation, they have low risk of contamination and food poisoning, and they are usually affordable and easily unpacked by young children. These facts have made these options highly preferred by both schools and children.
The traditional dietary patterns, the cultural and social habits, and the nutritional transitions, have all contributed to this high intake of sugar among all age groups of this region.
Refined carbohydrate intake
Recent dietary recommendations focus on having low intake of refined carbohydrates including sugar [39]. The dietary habits in the EMR (Figure 5) are characterized by a high intake of refined cereals (mainly wheat, rice and their products) that overcomes (almost double) the intake among Northern Americans and Western Europeans.
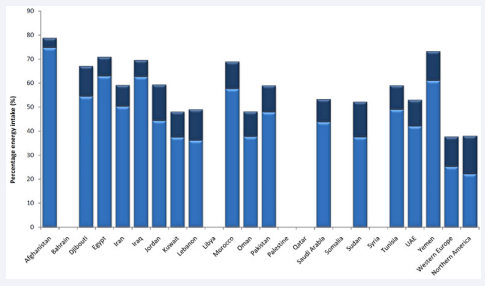
Figure 5: Percentage energy intake from cereals (excluding beer) (light blue) and sugar (dark blue) in the Eastern Mediterranean countries in 2013, data from FAO stat, 2017.
Thus, the average supply of sugars in EMR seems to be close to that of North America and Western Europe, unlike that of refined cereals. In brief, the high intake of refined carbohydrates in the EMR is highly attributable to the intake of refined cereals.
EFFECTIVE POLICIES AND STRATEGIES TO REDUCE SUGAR INTAKE
A multidisciplinary approach involving policymakers, media, social partnerships, academics, etc. is mandatory in order to reduce refined carbohydrate consumption or support its metabolism among populations. Policies should include building marketing strategies to counter the exaggerated intake of sugar, conducting awareness and providing reliable information, controlling promotions on unhealthy high sugary foods and beverages and milled cereals, improving access to alternative healthy food (whole grains), etc. Implementations should start in kindergartens, schools, universities, and workplaces where people spend most of their time. As part of monitoring, studies that assess large-scale refine carbohydrate intakes must be continuously performed in order to evaluate the effectiveness of the strategies.
SUGGESTED MEASURES TO MINIMIZE SUGAR INTAKE IN EMR
a- Reformulate sugar-rich foods and drinks to lower sugar intakes
This measure is recognized to be highly effective and requires the government to set appropriate food and drink standards. Experience also shows that when responsible companies take measures to reduce sugar in food and drinks they become very concerned if other competitor companies do not do the same and gain a commercial advantage. Establishing common standards set by the government allows all companies to operate on the same basis.
b- Set standards for all food and drink served by government-sponsored institutions
Progressive policies should specify that no sugar sweetened drinks should be offered for sale and the amount of sugar used by all caterers and food manufacturers supplying the government facilities should be progressively reduced.
c- Restrict promotion of sugar-enriched products, especially drinks
Price promotions are used for increasing sales and this is particularly evident in the Eastern Mediterranean Region, where sales of sugar-enriched soft drinks have been increasing rapidly over the last two decades [61]. Price promotions like presenting two items for the price of one, price reductions or increasing the portion size for the same price are known to be highly effective in encouraging consumers to purchase and consume more of a product.
Soft drinks (excluding fruit juice) may be the largest single source of sugar for adolescents, but there is a need to establish the major sources of sugar in the diet. Table sugar, confectionery, and fruit juice are often large contributors to the sugar intake of adolescents in the Region. For younger primary school children, soft drinks, biscuits, buns, cakes, pastries and puddings, breakfast cereals, confectionery and fruit juice may be the major sources. In adults, table biscuits, buns, cakes, pastries and puddings, fruit juices and soft drinks may be the main sources. It will be much easier to formulate priority changes once a country knows the sugar content of the principal items in its diet, but sugary drinks should be limited as much as possible and ideally be eliminated as a source of caloric intake.
d- Impose restrictions on marketing, advertising and sponsorship of all sugar-enriched foods and drinks across all media platforms
The marketing of inappropriate sugar-enriched foods and drinks is becoming increasingly aggressive as the region represents an ideal marketing opportunity due to limited regulatory restrictions. Special measures are needed to address the unopposed marketing on satellite television channels and across all digital media. Several European countries now have major restrictions on sales promotions of inappropriate foods and drinks and these restrictions are sometimes accompanied by taxes and health warnings associated with each advertising slot and advertisement. Sponsorship of sporting events is a notorious avenue for promoting the consumption of sugary and fatty products and this form of advertising is increasingly seen as detrimental to public health.
e- Use nutritional profiling to establish clear definitions of foods and drinks high in sugar
WHO-developed methods for assessing the appropriate levels of nutrients, including sugar and a method has been established for use in marketing in the Region [62]. There are also methods of setting the criteria for developing clear, understandable methods of food labeling, e.g. traffic light labeling, which is increasingly being used internationally and for which there is extensive evidence of its usefulness for interested consumers.
f- Eliminate sugar subsidies provided by national governments and introduce progressive taxes initially on sugary drinks and then on all foods and drinks with added sugar
An initial retail price increase of 10% on sugary drinks is often used but economic analyses suggest that a minimum of a 20% increase in retail price is needed to induce appreciable changes in intake (10 included already). There is new evidence of the impact of such measures in several countries and in the United Kingdom where the Government has proposed a price increase greater than 20% on sugary soft drinks.
g- Improve accredited training on diet and health for individuals with opportunities to influence population food choices
Those eating in facilities provided in schools, hospitals, government departments and other national groups, e.g. the military or police are totally dependent on the choice of ingredients made by the caterers. In many countries, these caterers have little understanding of nutrition but in providing an appreciable part of the daily intake of those attending they have, in practice, a major influence on the dietary quality of a substantial number of people. So, if the governments target these caterers with skilled practical advice to reduce sugar use, as well as salt and fat content of the foods that they serve, then these changes would automatically impact an appreciable proportion of the population in the Region. This approach, therefore, depends on a cross-government initiative.
h- Provide routine health education to populations
Given that unhealthy diets are one of the main causes of disease and disability in the Eastern Mediterranean Region, health education about the importance of a varied diet low in fats, sugar and salt should become part of the routine information provided both by doctors and the government in schools and in public information systems.
Providing health education should be seen as a background policy – it has to be combined with other measures, such as those listed above.
PROGRESS IN EMR TO PROMOTE HEALTHY DIET INCLUDING SUGAR REDUCTION STRATEGIES
Sustainable food systems are key to promoting healthy diets. Governments are called upon to promote nutrition-enhancing agriculture, by integrating nutrition objectives into the design and implementation of agricultural programs, ensure food security and enable healthy diets [63]. WHO developed a regional roadmap in nutrition for the member states to implement the Global Targets and ICN-2 recommendations [63]. National strategies and/or national action plans developed in most countries of the Region. Promoting healthy diet is a key strategic and a cost effective intervention identified by the Regional Committee within the Regional Framework for Action to address NCDs, including: Promoting breastfeeding and implementing the International Code of Marketing of Breast-milk Substitutes, reducing salt intake at population levels, replacing trans-fats with polyunsaturated fats at population level and obesity control and prevention, including sugar reduction [64].
The WHO Regional office developed a “Proposed policy priorities for preventing obesity and diabetes in the Eastern Mediterranean Region” where sugar imported in most countries of the Region, except in Egypt where there is some home production and in Pakistan which is the fifth largest sugar producer and exporter in the world. Throughout the Region sugar pervades the food system and is abundantly used in all catering outlets including those in the public sector such as government departments, the military and the police [65]. Reducing the amount used in these outlets as well as reducing sugar subsidies and then progressively taxing sugar containing soft drinks involves initiatives by many government departments. Many countries commend with the implementation of the “Policy statement and recommended actions for lowering sugar intake and reducing prevalence of type 2 diabetes and obesity in the Eastern Mediterranean Region” [66]; including opposed Sin Taxes on Soft drinks; . KSA is the first Country at GCC to implement the Taxes on soft drinks and fizzy drinks -The GCC Member States have agreed to impose excise tax rates of 50% on soft drinks, and 100% on energy drinks [67-69]. Few countries removed subsidy on sugar such as Jordan and Egypt.
Besides pricing strategies, guiding consumers to buy healthier food products is an important food policy for preventing NCDs. Due to the critical role of food labeling on health and control of NCDs, the world health organization (WHO) introduces nutrition labeling as an essential approach of its regional and global strategies to address NCDs(1). Food labeling as a means to change the purchasing behavior of consumers, is being implemented in Iran, using traffic light labeling for content of fat, sugar, salt and trans-fatty acids of food products [70].
RESEARCH GAPS AND LIMITATIONS
The aim of this review was to present a brief overview of the actual sugar consumption in countries of the EMR; nevertheless, a list of research limitations encountered the process.
We used the FAO database as a main source of information since the same criteria are applied to all countries. However, 5 countries were missing in this database which has affected the whole picture of the region.
Furthermore, national studies on refined carbohydrate consumption were rare. Although, when found, national studies provided better description of the whole status of the country, small scale studies were used as indicator.
Additionally, most of the surveys targeted schoolchildren as they are more prone to oral/dental problems. Assessment on adults, if performed, was on small scales.
Last but not least, a major problem was the lack of clear definition of “sugar” in the papers. In some cases, sugar as table sugar and honey was studied; in others, sugar was the group that combined sweets and desserts as well. The varied classification has made the comparison between countries vague and hard to interpret.
CONCLUSIONS
The consumption of sugar has taken lots of attention when both obesity and diseases are tackled. Most updated dietary guidelines and nutrition recommendations tend to only focus on white sugar that is added to food and drinks, while new research attempts shed the lights on reducing all refined carbohydrates that are quantitatively consumed in big amounts and need more nutrients to be metabolized. This report suggests to cut down on refined carbohydrates and to balance between their amounts and nutrients intake for an enhanced sugar metabolism and a healthier community.
AUTHOR CONTRIBUTIONS
O.O.: Conceived, developed and drafted the work. C. E-M: Contributed to the interpretation and writing of the manuscript. A. A-J: Conceived and contributed to the writing of the manuscript.
REFERENCES
7. Sheiham A. Dietary effects on dental diseases. Public Health Nutr. 2001; 4: 569-591.
10. Burkitt D. Refined carbohydrate foods and disease. Elsevier: 2012.
17. Hu FB. Are refined carbohydrates worse than saturated fat? Am J Clin Nutr. 2010; 91:1541-1542.
26. Food balance sheets. In FAOSTAT, Nations, F.a.A.O.o.t.U. 2017.
29. Serious food security concerns due to conflict. Iraq: Nations, F.a.A.O.o.t.U.
32. Charap J. Libya: Selected issues International Monetary Fund: 2013.
33. Mahmood F. Subsidy on export of sugar. In State Bank of Pakistan. 2015.
35. Information T.A.B.N. Food subsidies sought as prices surge in uae. 2017.
37. Organization WH. Guideline: Sugars intake for adults and children. World Health Organization: 2015.
38. Agency FS. Expert nutritionists recommend halving sugar in diet.
43. Benjelloun S. Nutrition transition in morocco. Public Health Nutr. 2002; 5: 135-140.
50. Abid A. Oral health in tunisia. International dental journal. 2004; 54: 389-394.
51. Maatouk F. School oral health survey in kairouan, tunisia. 1998.
63. WHO/FAO J. Countries vow to combat malnutrition through firm policies and actions. 2017.
69. Business G. All gcc states to implement soft drinks, tobacco tax by year-end. 2017.
79. Programme, U.N.W.F. Urban in-depth efsa djibouti; 2011.
80. Programme, U.N.W.F. Comprehensive food security & vulnerability analysis in Iraq. 2008.
85. Baba NH. Food and dietary fibre consumption pattern in lebanon. Int J Food Sci Nutri. 1998.
87. Statistique Dd. Enquete nationale sur la consommation et les depenses des menages 2000/2001, 2001.
97. Yemen, comprehensive food security survey (cfss). Programme U.N.W.F. 2014.


