Sedentary behaviors among Mexicans in the United States and Mexico: A binational study
- 1. Department of Epidemiology and Health Services Research Unit, Instituto Mexicano del Seguro Socia, México
- 2. Department of Keck School of Medicine, University of Southern California, USA
- 3. Department of Center for Research in Health and Nutrition, National Institute of Public Health, Mexico
- 4. Department of Colorado School of Public Health, University of Colorado Denver, USA
Abstract
Introduction: This study examined differences in sedentary behaviors among Mexicans living in Mexico, Mexican immigrants in the United States (U.S.) and U.S. born Mexican-Americans.
Methods: The National Health Surveys (NHANES) and (ENSANUT) were analyzed. Screen time and sitting time were measured. Information about birth place, country of residence and language usually spoken at home was analyzed. Multiple linear regression assessed differences in sedentary behaviors among these populations.
Results: Mexican-born individuals living in Mexico and U.S. born Mexican-Americans living in the U.S reported higher screen time (127.7 and 213.7 minutes/day, respectively) compared to Mexican immigrants living in the U.S. (132.9, minutes/day). In addition, Mexicans-born and living in Mexico and U.S. Born Mexican-Americans spent more minutes/day sitting compared to Mexican immigrants living in the U.S.
Conclusions: U.S. born Mexican-Americans spent more time in sedentary behaviors compared to their counterparts in Mexico and the U.S. Future studies should investigate differences in sedentary behaviors and its predators.
Keywords
• Sedentary behaviors
• Migrants
• Screen time
CITATION
Gallegos-Carrillo K, Belcher BR, Dunton GF, Medina C, Samet JM, et al. (2023) Sedentary behaviors among Mexicans in the United States and Mexico: A binational study. JSM Nutr Disord 5(1): 1013.
INTRODUCTION
Several changes in human activity have been increasing the time spent on sedentary activities. Sedentary behaviors is any waking behaviors characterized by an energy expenditure≤1.5 METs (metabolic equivalent=one MET equals the resting metabolic rate), including screen-based leisure activities and be sitting, reclining, or in lying position while is working and during commuting as well [1].
Nowadays, prolonged time spent within sedentary activities appear to be related to all- cause mortality [2,3], and cardiovascular disease mortality [2]. independent of physical activity [3]. In addition, sedentary time is a potential health risk factor associated with several health conditions including cardiovascular diseases [4], type 2 diabetes [5,6] and cancer [7-9].
The time spent in sedentary activities has different patterns around the world [10]. Differences which could be attributed to the income level, migration and variations across countries. In addition, some differences could be found in the same country as well as in the same ethnicity [11], that could be understood as consequence of the migration flux and the adjustment process into a new socio-cultural and economic environment to which the migrant population are exposed [12,13].
Differences could be found based on country’s income. For instance, higher levels of sedentary behaviors during work hours; an increased inactive transportation (driving in a car, buses, trains) and high amount of time spent in screen-based leisure activities has been found in high-income nations.[7, 14] In contrast, people living in middle- and low- income countries, spend more time engaged in active occupational activities, household chores, which may contribute to reduced time spend in sedentary behaviors [15]. Furthermore, population living in middle-income countries, such as Mexico, tends to have higher rates of active transportation time due to lower rates of personal automobile ownership [16,17]
What has received little to no attention are the effects of migration on sedentary behaviors in 5population migrating from less industrialized to more industrialized nations (i.e., Mexican individuals moving from Mexico to the U.S.). Previous studies have described that different levels of adaptation could influence health status such as physical activity levels [18], self-rated health [19], depression [20], and cancer [21]. Given the high proportion of Mexican immigrants in the U.S. [22] and their continued influx from Mexico [23], understanding the role sedentary behaviors based on cultural adaptation process compared to population that has remained in Mexico is fundamental. Thus, the purpose of this study was to examine the relationship between two types of sedentary behaviors, and migration process in Mexican immigrants living in the U.S., compared to Mexicans living in Mexico, and U.S.-born Mexican-Americans.
METHODS
The U.S. National Health and Nutrition Examination Survey (NHANES) 2011-2012 24 and the Mexican National Health and Nutrition Survey (ENSANUT) 2012 25 are national representative surveys. Both surveys explore health status and nutrition patterns using similar types of questions.
Design characteristics and population of study
National Health and Nutrition Examination Survey (NHANES): NHANES is a cross-sectional health interview survey representative of the U.S. civilian, non-institutionalized population [24]. Data are collected year-round using a complex, stratified, multistage probability cluster sampling design strategy. Publicly available database is released in 2-year cycles. For the purpose of this study data from 2011-2012 survey cycles were used. The NHANES screened approximately 11,500 households per year; and data were collected from 13,431 individuals. Of those selected 9,756 completed the interview [24]. Data for 505 men and women ages 20-69 years, self-identified as “Mexican American” was included in this study.
Further information related to NHANES 2011-2012 has been published previously [24]. Mexican-Americans with missing data for: sedentary behaviors or outlier values (> 16 total hours per day spent sedentary (N=2); body mass index (n=25), migration related variables (n=2),pregnant women (n=6), underweight participants (BMI < 18.5 kg/m2; n=4) and other covariates as education and occupation (n=17), were excluded. Final sample size included 448 Mexican-Americans (men n=234; women n=214) who had completed variables of interest.
Mexican National Health and Nutrition Survey (ENSANUT): ENSANUT survey was conducted between October 2011 and May 2012, using a probability multistage stratified sample, and a clustered design [25]. The sample was representative of the Mexican population. ENSANUT collected data from 50,528 households to obtain a sample of 89,000 individuals. Socio demographic and physical activity information of 10,729 adults was used. Details on ENSANUT methodology and data collection have been published elsewhere.34 Participants with missing sedentary behavior data (n=365), BMI (n=427) and other related covariates (n=90); as well data from participants with underweight (<18.5 kg/m2; n=99), and pregnant women (n=226) were excluded. A total of 9,702 (men n=3,803; women n=5,899) between 20-69 years of age were used for the final analyses.
Measurement
Dependent variables: Sedentary behavior measurement: Sedentary behaviors were self-reported by participants and defined as a) time spent in commuting from one place to another (inactive transportation), b) screen time, TV viewing, computer time, use of videogames, and other types of screen time such as use of electronic personal devices.
Global Health Activity Questionnaire (GPAQ): This questionnaire developed by the World Health Organization was used in the NHANES (2011-2012) to examine physical activity levels and sedentary behaviors [26]. The GPAQ questionnaire has been shown to have moderate validity and reliability compared to device-based measures such as accelerometers [27], and its capability to assess sedentary behavior [28]. We used one question that explored the time spent sitting at work, home, at desk, reading, and sitting while in inactive transportation; it excluded the time spent sleeping. This question has been used to estimate the time sitting per day in other studies [29-31]. Minutes/ day of sitting time were calculated from the questionnaire using information collected of time sitting at work, home and inactive transportation. In addition, two questions from the GPAQ were used to measure screen time. The questions asked about hours per day spent watching TV and playing computer videos in the last 30 days. In addition, hours per day using a computer or playing computer games outside of work or school was used to estimate a minutes/day screen variable.
Short form of the International Physical Activity Questionnaire (IPAQ) – Spanish version: This questionnaire was developed by an international group of experts in order to determinate global physical activity levels [32]. The IPAQ asks for the time and days spent in vigorous, moderate, and walking in the previous 7 days and the total amount of time spent sitting (at work, home and during leisure time, including time spent sitting at a desk, visiting friends, reading or sitting or lying down to watch television) in a day or Wednesday during the last 7 days. The validity and reliability of IPAQ short form against objective measurement using accelerometers have been also obtained, showing an acceptable reliability and fair validity for physical activity in a Mexican sample [33], and sedentary behavior in other settings [34]. The IPAQ protocol was for cleaning physical activity and sedentary behaviors data. [30]. In addition, sitting hours/day <10 min/day and >16 hours/day were removed from analyses based on previous studies [26, 32].
In addition, ENSANUT database contained two additional questions related to sedentary behaviors. These questions included 1) the time spent in a motor vehicle (e.g., a train, bus, car, or tram) during a weekday in the last seven days. Time spent sitting per day and into motor vehicle were used to estimate sedentary time variable (min/day). And, 2) time spent in front of a screen (watching television, movies, playing videogames) during a week and weekends. These questions have been validated in Mexican population [32,33], Hour per day during the week and weekend were combined to create minutes per week and then divided by 7 to generate a screen time variable (min/day).
Independent variables: Migration and cultural adaptation, was defined by birth-place, country of residence and usual language spoken at home. Those born in Mexico living in the U.S., are referred as Mexican immigrants.
Covariates
Socio demographic characteristics such as age, sex, education (i.e., elementary or less, less than high school, or high school or above); employment status (i.e., employed or unemployed) were considered as covariates. We included self-reported health conditions such as having been diagnosed by a health professional as having type 2 diabetes mellitus, self-reported and survey finding hypertension (systolic blood pressure ≥140 mmHg and/ or, diastolic pressure ≥ 90 mmHg), and survey findings high levels of cholesterol (> 240 mg/dL).
Statistical analyses
Sample design (clusters and strata variables) and weights were used for the analyses for each separate dataset. Descriptive analyses included: means, frequencies, ranges, and proportions according to migration status. Outcome variables were: minutes/ day spent in sedentary behaviors (sitting and screen time). Description of the study populations (sociodemographic and health conditions), based on variables of migration status and adaptation to a new culture.
In a second stage of analysis, national databases were joined to explore the associations between sedentary behaviors and migration and cultural adaptation. For regression analyses, the ENSANUT sample was treated as the reference category (i.e, those who are Mexican-born, currently living in Mexico, and who speak only Spanish at home). Multivariate linear regressions were used to examine the extent to which time spent in sedentary behavior, sitting, screen time were associated with the level of migration and adaptation to a new culture of Mexican-born individuals living in Mexico and Mexican-Americans, i.e., those individuals born in the U.S. who were of Mexican origin. Each regression analysis was conducted for non-adjusted and covariate- adjusted models including sociodemographic characteristics and health conditions variables. Analysis was carried out using Stata, S.E. 15 for Windows.
RESULTS
Sociodemographic characteristics by migration and cultural adaptation
In total, 9,702 participants from the 2012 ENSANUT and 448 participants from 2011- 2012 NHANES had valid information. Statistically significant differences were observed in men for education level and occupation by migration status and cultural adaptation (p < 0.05). U.S.-born, Mexican-Americans living in the U.S. attained the highest level of education and had the highest rate of unemployment in comparison with their peers born in Mexico and living as immigrants in the U.S. or still living in Mexico. In addition, data about health risk conditions indicated that U.S.born Mexican-American males living in the U.S. had a higher prevalence of type 2 diabetes (11.4%), hypertension (41.7%) and high cholesterol (25.9%) than Mexicans living in Mexico and Mexican immigrants living in the U.S. Among females, significant differences were observed for education and employment across migration and cultural adaptation categories. In addition, significant differences were observed when the language spoken at home was used as a proxy of the level of migration and cultural adaptation in women. Mexican immigrant women living in the U.S., but who speak only Spanish at home, reported the highest proportion of type 2 diabetes (11.5%) and high cholesterol (21.1%) Table 1.
Table 1: Socio-demographic, anthropometrics and health risk conditions of Mexican ethnicity population according to birth place, country of residence and language usually spoken at home by gender. National Health and Nutrition Databases. (NHANES 2011-2012 and ENSANUT 2012).
|
Variables |
Mexican born/ living in Mexico/ speaking Spanish |
Mexican immigrants / living in the US/ speaking Spanish |
Mexicans immigrants/ living in the US/ speaking Spanish and English |
US Born Mexican- American living in the US/ speaking English |
|
Mexican immigrants living in the US |
US Born Mexican- Americans living in the US |
|
|
|
Male |
|
||||||
|
|
(n=3,803) |
(n=93) |
(n=106) |
(n=35) |
p-value |
(n=149) |
(n=85) |
p-value |
|
Age mean |
41.6 |
40.4 |
37.2 |
36.2 |
0.141 |
39.8 |
35.9 |
0.054 |
|
Age group % |
|
|
|
|
|
|
|
|
|
20-29 years |
26.9 |
15.3 |
35.1 |
43.4 |
0.058 |
20.2 |
42.2 |
0.006 |
|
30-49 years |
40.8 |
62.1 |
44.9 |
36 |
|
57.2 |
38.9 |
|
|
50-69 years |
32.2 |
22.6 |
19.9 |
20.6 |
|
22.6 |
18.8 |
|
|
Education level % |
|
|
|
|
|
|
|
|
|
Elementary or less |
21.8 |
52.1 |
14.2 |
0.9 |
0 |
40.2 |
5.6 |
0 |
|
Less than high school |
50 |
17.1 |
33.7 |
10.8 |
|
22.2 |
25.6 |
|
|
High school and higher |
28.2 |
30.7 |
52.1 |
88.2 |
|
37.6 |
68.8 |
|
|
Occupation % |
|
|
|
|
0.007 |
|
|
0.025 |
|
Employment |
77.2 |
83.1 |
77.5 |
63.7 |
|
83 |
68.7 |
|
|
Unemployment |
22.8 |
16.9 |
22.4 |
36.2 |
|
17 |
31.3 |
|
|
Health risk conditions |
|
|
|
|
|
|
|
|
|
Diabetes |
8.6 |
8.8 |
8.5 |
11.4 |
0.149 |
9.1 |
9 |
0.624 |
|
High blood pressure |
12.7 |
11.4 |
13.9 |
41.7 |
0 |
12.2 |
25.8 |
0.003 |
|
High cholesterol |
12 |
23.6 |
19.8 |
25.9 |
0 |
22.9 |
21.2 |
0.769 |
|
|
|
|
|
Female |
|
|
|
|
|
|
(n=5,899) |
(n=83) |
(n=86) |
(n=45) |
p-value |
(n=126) |
(n=89) |
p-value |
|
Age mean |
41.5 |
40.4 |
36.9 |
38.4 |
0.605 |
39.7 |
37 |
0.013 |
|
Age group % |
|
|
|
|
|
|
|
|
|
20-29 years |
23.8 |
18.3 |
28.6 |
34.6 |
0.139 |
18.2 |
36.4 |
0.019 |
|
30-49 years |
46.3 |
58.5 |
57.9 |
45 |
|
62.4 |
45.9 |
|
|
50-69 years |
29.9 |
23.2 |
13.4 |
20.4 |
|
19.4 |
17.8 |
|
|
Education level % |
|
|
|
|
|
|
|
|
|
Elementary or less |
25.2 |
51.9 |
9.8 |
4.3 |
0 |
39.9 |
4.02 |
0 |
|
Less than high school |
47.2 |
22.8 |
29.7 |
10 |
|
28.8 |
15.1 |
|
|
High school and higher |
27.6 |
25.3 |
60.4 |
85.7 |
|
31.3 |
80.9 |
|
|
Occupation % |
|
|
|
|
|
|
|
|
|
Employment |
35.3 |
50.2 |
62.6 |
67.5 |
0 |
51.9 |
68.3 |
0.17 |
|
Unemployment |
64.7 |
49.7 |
37.4 |
32.5 |
|
48.1 |
31.7 |
|
|
Health risk conditions |
% |
|
|
|
|
|
|
|
|
Diabetes |
11.3 |
11.5 |
9.7 |
0 |
0.013 |
10.4 |
5.8 |
0.454 |
|
High blood pressure |
18.6 |
24.1 |
19.7 |
27.7 |
0.001 |
21.7 |
25.1 |
0.267 |
|
High cholesterol |
16.1 |
21.1 |
18.1 |
15.1 |
0.003 |
17.9 |
19.8 |
0.571 |
n=sample size, (NHANES). National Health and Nutrition Examination Survey. (ENSANUT) Encuesta Nacional de Salud y Nutrición.
Factors associated with sedentary and screen time
Based on [table 2],
Table 2: Association of minutes of sedentary time and screen time with sociodemographic characteristics andhealth conditions among Mexican ethnicity population living in Mexico or in the US. National Health and Nutrition Databases (NHANES 2011-2012 and ENSANUT 2012).
|
Variables |
Sedentary time |
Screen time |
|||
|
|
Adjusted § |
Adjusted § |
|||
|
|
Coef |
|
95% C.I. |
Coef |
95% C.I. |
|
Gender Female (reference) |
-- |
-- |
|||
|
Male |
-46.3 (-0.55, -0.37)*** |
-15.1 (-19.8,-10.5)*** |
|||
|
Age group 20-29 years (reference) |
-- |
-- |
|||
|
30-49 years |
-7.01 (-17, 3.01) |
-25.7 (-30.9, -20.5)*** |
|||
|
50-69 years |
-15.8 (-27.9, -3.6)* |
-35.3 (-41.6, 29)*** |
|||
|
Education level Elementary school or less (reference) |
|
|
|||
|
High school no diploma |
48.1 (38.5, 57.6)*** |
26.9 (22.1, 31.9)*** |
|||
|
High school and higher |
126.7 (15.3, 138.2)*** |
67.1 (61.1, 72.9)*** |
|||
|
Employment status Employed (reference) |
-- |
-- |
|||
|
Unemployed |
-25.1 (-33.9, -16.4)*** |
3.56 (-0.98, 8.1) |
|||
|
Health risk conditions No diabetes (reference) |
|
-- |
|
-- |
|
|
Diabetes No high blood pressure (reference) |
29.7 (15.7, 43.8)*** -- |
9.4 (2.1, 16.7)* -- |
|||
|
High blood pressure No high blood cholesterol (reference) |
12.9 (1.6, 24.1)* -- |
4.7 (-1.1, 10.5) -- |
|||
|
High cholesterol |
16.9 (5.4, 28.5)** |
8.8 (2.8, 14.8)** |
|||
|
§ Coefficients indicating the change in the dependents variable due to the increase in the independent variables, coefficients co-adjusted for all the variables listed in the model. *p<0.05, **p <0.01, ***p< 0.001. |
|||||
men in comparison to women had lower time spent sitting (Coeff -46.3 minutes per day, (95% C.I. -0.55,-0.37)) and less time spent in front of a screen (Coeff -15.1 minutes per day, (95% C.I. -19.8, -10.5); p < 0.001.
The time per day spent sitting (Coeff -15.8 minutes (95% C.I.-27.9, -3.6)) and on a screen time decreases (Coeff -35.3 (95% C.I.-41.6, -29)) with age. (p < 0.001) [Table].
In addition, those unemployed reported fewer minutes/ day sitting (Coeff -25.1 minutes per day, 95% C.I. -33.9, -16.4) compared to those who were employed.
Health risk conditions were associated with higher sedentary time. Specifically, those with Type 2 diabetes had higher sedentary time (Coeff -29.7 minutes per day, (95% C.I. 15.7, 43.8) than those without Type 2 diabetes [Table 2].
Sedentary and screen time according to migration and cultural adaptation
The largest differences in sitting time were seen by categories of language usually spoken at home, in addition to the birth-place and country of residence. The group with fewer min/day of sitting time were Mexican immigrants living in the U.S. who only spoke Spanish at home (210 min/day), compared to Mexican- born individuals living in Mexico (274.9 min/day) and U.S.-born, Mexican-American living in the U.S. who spoke only English at home (364 min/day), respectively [Figure 1].
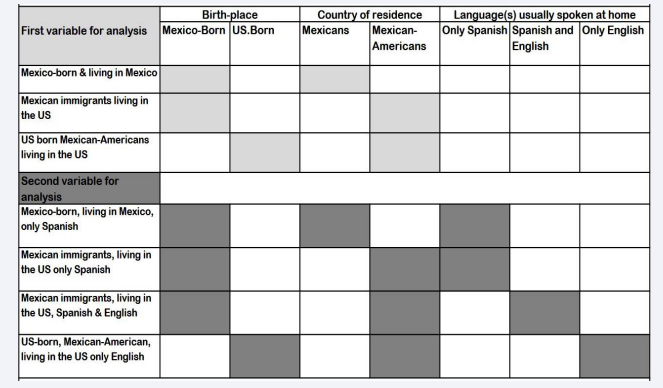
Figure 1: Definition of variables according to birth-place, Country of residence and languages(S) usually spoken at home.
Figure 2 displays min/day of screen time (watching TV, playing videogames and using electronic personal devices). Mexican immigrants living in the U.S. who spoke only Spanish at home spent less time on screens (122.9 minutes/day) compared to the other groups.
Associations of sedentary and screen time by migration and cultural adaptation
Mexican immigrants living in the U.S. who speak only Spanish at home and Mexican immigrants living in the U.S. speaking both Spanish and English reported lower sedentary time than Mexicans living in Mexico and U.S. Born Mexican-Americans living in the US. Results remain significance in adjusted models for both Mexican immigrants living in the US who are bilingual (Coeff -46.3 minutes per day, (95% C.I. -74.2, -18.4)) and for Mexican immigrants living in the US (Coeff -59.2 minutes per day, (95% C.I. -82.6, -35.8)) without considering language spoken as a way to measure the level of cultural adaption Figure 2, having as reference those Mexicans born living in Mexico [Figure 2].
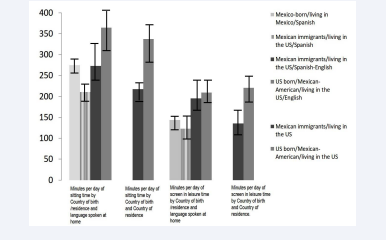
Figure 2: Mean of minutes per day of sitting time* and time spent in the screen** of Mexican ethnicity population by birth place, country of residence, and Language preferred at home. NHANES 2011-2012 and ENSANUT 2012. * Sitting time including time spent in transportation. ** Screen/TV time includes TV viewing, videogames and recreational computer use. NHANES (National Health and Nutrition Examination Survey). ENSANUT (Encuesta Nacional de Salud y Nutrición). Confidence interval 95% in bold line.
Results indicated differential associations between screen time and language spoken a home. Mexican immigrants living in the U.S. who spoke both Spanish and English at home (Coeff56.3 minutes of screen time per day (95% C.I. 41.4, 71.2)), andU.S. Born Mexican-American speaking English at home had the highest coefficient of screen time (Coeff -80.8 minutes per day, (95% C.I. -57.8, -103.7)), these associations remained significant after adjusting for covariates whose coefficients are shown in Figure 3.
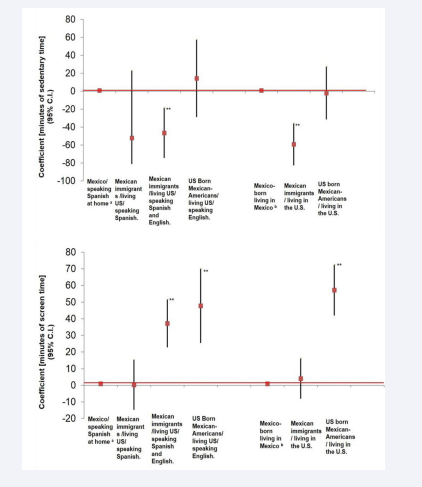
Figure 3: Association of minutes of sedentary and screen time in Mexican ethnicity population by birthplace, country of residence and language usually spoken at home, and by birth place and country of residence. National Health and Nutrition Databases from the United States and Mexico (NHANES 2011-2012 and ENSANUT 2012) a Reference category is Mexico-born living in Mexico/ speaking Spanish at home. b Reference category is Mexico-born living in Mexico Coefficients indicating the change in the dependent variable due to the increase in the independent variables. Coefficient adjusted for the following variables gender, age, education level, employment status and health risk conditions.** p< 0.001
While, statistical models using birthplace and country of residence only, shown that US born Mexican-Americans living in the US, have higher and significant coefficients of screen time (Coeff 86.1 minutes per day, (95% C.I. 70.4-101.7) than Mexican immigrants living in the US or Mexicans living in Mexico, adjusted coefficients are reported in Figure 3.
DISCUSSION
Our findings indicated that both Mexican-born living in Mexico and Mexican immigrants living in the U.S. spent less time sitting and on screens, and overall fared better than their U.S. born Mexican-American counterparts (the highest acculturated group). The Mexican immigrants living in the U.S. who speak only Spanish (i.e., the group with the least adaptation to a new culture) reported the lowest levels of sedentary behavior as well, suggesting that be in the process of adaptation in the migration context may be protective against excessive sedentary behaviors.
We assessed how language spoken at home, self-reported ethnicity, country of birth, and country of residence influence on sedentary behavior. The inclusion of language usually spoken at home was novel in that it allowed us to observe varying levels of sedentary and screen time that were not observed with the more commonly used measures such as country of birth and ethnicity.
Our study findings showed that being more adapted to a new culture are positively associated with higher levels of sedentary time. It is possible that lower levels of sedentary time among individuals less adapted to the new cultural context is associated with active occupations, although data of occupational activities were not available in both databases to make this comparison, we are aware that occupation is an important variable which must be included in future analysis particularly those assessing sedentary time among migrant populations. However, studies assessing ethnic disparities in objectively measured physical activity have indicated that higher physical activity levels observed in Mexican- Americans could be related to active occupations mainly in those with low household incomes [34]. Data on sedentary behaviors in these populations are still lacking but.
Findings from some previous studies among Mexican- Americans have found associations between occupation and sedentary behaviors. For instance, it has been found that workers with sedentary occupations spent more time sitting compared to those who spend time in occupations which require be standing [35,36].
A study that reported sitting in Mexican population reported that students and those who are employed are more likely to spend time sitting than housewives and unemployed [24] This result is consistent with the pattern observed among Mexicans and Mexicans-Americans whether in Mexico or in the US [35-37].
There is a lack of information related to the comparison between screen and TV time based on a migration process and adaptation to a new culture. Results from this study indicated strongest associations with preferred language. English language only or English and Spanish combined (i.e., bilingual individuals) resulted in a positive association with higher amount of screen time.
For instance, individuals who were either bilingual or spoke only English at home reported higher levels of screen time.U.S. born Mexican-Americans showed the highest association with screen and TV time. This finding was similar for Spanish speaking Mexican-born individuals living in Mexico and for the Mexican immigrants living in the U.S. In addition, a higher level of cultural adaptation has been associated previously with use of mobile phone in Mexican Americans [38], and greater time spent on mobile devices is associated with higher sedentary behaviors [38].
This reinforces the importance of understanding ways in which migration and adaptation to the new culture are measured. This study showed that preferred language (“language usually spoken at home”) captures more differences in sedentary and screen time than a combined variable of only birthplace and country of residence. Some studies have proposed ways to measure acculturation [39-41].These studies have shown that a stronger prediction of the level of adaptation and a new culture under and acculturation when a single measure is used (i.e.: language in this study). However, there were no valid information related to acculturation within these national health surveys. Therefore, we used language as an indicator of “acculturation” in a new country.
In addition, the use of language (Spanish spoken at home) could serve as a good indicator for this component. Specifically, because these immigrants could prefer to retain their heritage through the use of language or are less willing to adapt to the norms, values, and practices of the new host society [42]. However, more research is needed to better understand associations between health risk behaviors and acculturation measures.
The results of this study showed that sedentary behaviors (both sitting and screen time) are lower among Mexican immigrants living in the U.S. in comparison to U.S. born Mexican- American living in the U.S. This is consistent with previous research society [42,43].
LIMITATIONS
The use of a cross-sectional design in both national databases prevents us from reaching causal inferences. The differences in the questionnaires used to measure sedentary behavior, screen and TV time, GPAQ [26], in the NHANES and IPAQ [32], in the ENSANUT is another limitation; however, other studies aimed to assess physical activity trends worldwide have used the both questionnaires to make comparisons [44]. There has been reported that self-reported instruments tend to overestimate physical activity levels and sedentary activities, and these questionnaires are not the exception. Cautions should be taken on the interpretation of sedentary and screen time due to the differences in the structure and response options between surveys.
Sitting time within the NHANES was captured using a single question. This question referred to hours spent sitting per day in transportation, leisure time and during work activities. Data on sitting time from the ENSANUT was obtained by two items. First, the hours per week spent sitting in motorized transportation. Secondly, the time spent in a day or Wednesday in the last 7 days.
Although both national databases were cleaned and processed following the same procedures. In addition to the use of sample weights, the questions of time spent in front of a screen may raise some concerns. This could be related to the questions structure, making comparability and representativeness more difficult. Furthermore, the small sample size resulted from acculturation categories among Mexican immigrants and Mexican-Americans within NHANES. Despites this limitation, reported values are representative of the entire population. Due to the fact that self- reported sedentary behaviors (sitting and screen time) can be underestimated, the associations between acculturation could also be underestimated.
However, in spite of these limitations and the limited scientific evidence available from the last 20 years related to the association between acculturation process among the U.S. born Mexican-Americans and Mexican immigrants living in the U.S [45,46], and sedentary behaviors, this study provides relevant and new evidence on this topic. Although measurement limitation, valuable data has been obtained and reported here, demonstrating the influences of migration and adaptation to a new culture in the relationships of health risk behaviors. Future studies about measurement would be useful to make direct comparisons among countries easier.
CONCLUSIONS
This analysis examined the relationship between two types of sedentary behaviors, and migration process between two countries and three populations using data from two large national and representative datasets from Mexico and the U.S. This study demonstrated that sitting and screen time varied based on the migration and cultural adaptation. Our findings could serve as baseline research to identify potential future public health interventions to reduce the time spent in sedentary behaviors both in the U.S. and in Mexico, under the assumption that migrant phenomenon promotes both healthy and risky behaviors, among them sedentarism.
ACKNOWLEDGEMENTS
We appreciate all the support of the Center for Health Equity in the Americas, Keck School of Medicine, University of Southern California (U.S.C), the National Council of Science of Technology from Mexico (CONACYT) and the Mexican Social Security Institute (IMSS).
Funding source
USC, CONACYT, Mexican Social Security Institute.
REFERENCES
- Tremblay MS, Aubert S, Barnes JD, Saunders TJ, Carson V, Latimer Cheung AE, et al. Sedentary Behavior Research Network (SBRN) - Terminology Consensus Project process and outcome. Int J Behav Nutr Phys Act. 2017; 14: 75.
- Chau JY, Grunseit AC, Chey T, Stamatakis E, Brown WJ, Matthews CE, et al. Daily sitting time and all-cause mortality: a meta-analysis. PLoS ONE. 2013; 8: e80000.
- Bjork Petersen C, Bauman A, Gronbaek M, Wulff Helge J, Thygesen LC, Tolstrup JS. Total sitting time and risk of myocardial infarction, coronary heart disease and all-cause mortality in a prospective cohort of Danish adults. Int J Behav Nutr Phys Act. 2014; 11: 13.
- Ford ES, Caspersen CJ. Sedentary behavior and cardiovascular disease: a review of prospective studies. Int J Epidemiol. 2012: 41: 1338–1353.
- Wilmot EG, Edwardson CL, Achana FA, Davies MJ, Gorely T, Gray LJ, et al. Sedentary time in adults and the association with diabetes, cardiovascular disease and death: systematic review and meta- analysis. Diabetologia. 2012; 55: 2895–2905.
- GBD 2015 Risk Factors Collaborators. Global, regional, and national comparative risk assessment of 79 behavioural, environmental and occupational, and metabolic risks or clusters of risks, 1990–2015: a systematic analysis for the Global Burden of Disease Study 2015. Lancet. 2016; 388: 1659-1724.
- Lee IM, Shiroma EJ, Lobelo F, Puska P, Blair SN, Katzmarzyk PT, et al. Effects of physical inactivity on major non-communicable diseases worldwide: an analysis of burden disease and life expectancy. Lancet. 2012; 380: 219-229.
- Proper KI, Singh AS, van Mechelen W, Chinapaw MJ. Sedentary behaviors and health outcomes among adults: a systematic review of prospective studies. Am J Prev Med. 2011; 40: 174-182.
- Lynch BM. Sedentary behavior and cancer: a systematic review of the literature and proposed biological mechanisms. Cancer Epidemiol Biomarkers Prev. 2010; 19: 2691-2709.
- Bauman AE, Seis RS, Sallis JF, Wells JC, Loos RJF, Martin BW. Correlates of physical activity: why are some people physically active and others not? Lancet. 2012; 380: 258-271.
- Sullivan R, Kinra S, Ekelund U, A.V. Bharathi, Vaz M, Kurpad A, et al. Socio-Demographic Patterning of Physical Activity across Migrant Groups in India: Results from the Indian Migration Study. PLoS ONE. 2011; 6: e24898.
- In L. A. Samovar, R.E. Porter (Eds.), Intercultural Communication: A reader. Belmont, CA: Wadsworth. 1982; 379-388
- Marden CF, Meyer G. Minorities in America society (3rd ed.). New York: Van Nostrand Reinhold Co. 1968.
- Knuth AG, Hallal PC. Temporal trends in physical activity: a systematic review. J Phys Act Health. 2009; 6: 548-559.
- Pate RR, O’Neill JR, Lobelo F. The evolving definition of ‘‘sedentary’’. Exerc Sport Sci Rev. 2008; 36: 173–178.
- Pratt M, Sarmiento OL, Montes FM, Ogilvie D, Marcus BH, Perez LG, et al. The implications of megatrends in information and communication technology and transportation for changes in global physical activity. Lancet. 2012; 380: 282-293.
- National Institute of Statistics, Geography and Informatics. INEGI. Statistical yearbook and geographic of the United Mexican States 2014. INEGI. Mexico. 2014.
- Vásquez G, Salinas J, Molokwu J, Shokar G, Flores-Luevano S, Alomari A, et al. Physical Activity in Older Mexican Americans Living in Two Cities on the U.S.-Mexico Border. Int J Environ Res Public Health. 2018; 15: 1820.
- Lommel LL, Thompson L, Chen JL, Waters C, Carrico A. Acculturation, Inflammation, and Self- rated Health in Mexican American Immigrants. J Immigr Minor Health. 2019; 21: 1052-1060.
- Calzada EJ, Sales A. Depression among Mexican-origin mothers. Exploring the immigrant paradox. Cultur Diver Ethnic Minor Psychol. 2019; 25: 288-298.
- Pinheiro PS, Callahan KE, Stern MC, de Vries E. Migration from Mexico to the United States: A high-speed cancer transition. In J Cancer. 2018; 142: 477-488.
- U.S. Census Bureau 2014. American Community Survey B030011-Year Estimates Hispanic or Latino origin by specific origin. Available at: U.S. Census Bureau, 2014 American Community Survey 1-Year Estimates. Accessed November 2015.
- Pew Research Center. Facts on U.S. Latinos, 2017.
- Johnson CL, Dohrmann SM, Burt VL, Mohadjer LK. National Health and Nutrition Examination Survey: Sample design, 2011–2014. Vital Health Stat 2. 2014; 1-33.
- Romero-Martínez M, Metodología. En: Gutiérrez JP, Rivera- Dommarco J, Shamah-Levy T, Villalpando-Hernández S, Franco A, Cuevas-Nasu L, et al. Encuesta Nacional de Salud y Nutrición 2012. Resultados Nacionales. Instituto Nacional de Salud Pública. México 2012:19-27.
- World Health Organization. Global Physical Activity Questionnaire (GPAQ). Analysis Guide. Geneva. Switzerland: World Health Organization. 2001.
- Herrmann SD, Heumann KJ, Der Ananian CA, Ainsworth BE. Validity and reliability of the Global Physical Activity Questionnaire (GPAQ). Meas Phys Educ Exerc Sci. 2013; 17: 221-225.
- Cleland CL, Hunter RF, Kee F, Cupples ME, Sallis JF, Tully MA. Validity of the global physical activity questionnaire (GPAQ) in assessing levels and change in moderate-vigorous physical activity and sedentary behaviour. BMC Public Health. 2014; 14: 1255.
- Harrington DM, Barreira TV, Staiano AE, Katzmarzyk PT. The descriptive epidemiology of sitting among US adults, NHANES 2009/2010. J Sci Med Sport. 2014; 17: 371-375.
- Ussery EN, Whitfield GP, Fulton JE,Galuska DA, Matthews CE, Katzmarzyk PT, et al. Trends in Self-Reported Sitting Time by Physical Activity Levels Among US Adults, NHANES 2007/2008-2017/2018. J Phys Act Health. 2021; 18: S74-S83.
- Ussery EN, Fulton JE, Galuska DA, Katzmarzyk PT, Carlson SA. Joint prevalence of sitting time and leisure-time physical activity among US adults, 2015–2016. JAMA. 2018; 320: 2036–2038.
- Craig CL, Marshall AL, Sjostrom M, Bauman AE, Booth ML, Ainsworth BE, et al. International physical activity questionnaire: 12 country reliability and validity. Med Sci Sports Exerc. 2003; 35: 1381-1395.
- Medina C, Barquera S, Janssen I. Validity and reliability of the International Physical Activity Questionnaire among adults in Mexico. Rev Panam Salud Publica. 2013; 34: 21-28.
- Gay JL, Buchner DM. Ethnic disparities in objectively measured physical activity may be due to occupational activity. Prev Med. 2014; 63: 58-62.
- Gay JL, Kohl HW, Salinas JJ, McCormick JB, Fisher-Hoch SP. Contribution of occupation to high doses of light-intensity physical activity and cardiovascular risk factors among Mexican American adults. J Phys Act Health. 2014; 11: 1342-1349.
- Vandelanotte C, Duncan MJ, Short C, Rockloff M, Ronan k, Happell B, et al. Associations between occupational indicators and total, work- based and leisure-time sitting: a cross-sectional study. BMC Public Health. 2013; 13: 1110.
- Medina C, Janssen I, Campos I, Barquera S. Physical inactivity prevalence and trends among Mexican adults: results from the National Health and Nutrition Survey (ENSANUT) 2006 and 2012. BMC Pub Health. 2013; 13: 1063.
- Chrisman M, Chow WH, Daniel CR, Wu X, Zhao H. Mobile phone use and its association with sitting time and meeting physical activity recommendations in a Mexican American Cohort. JMIR Mhealth Uhealth. 2016; 4: e54.
- Schwartz SJ, Benet Martínez V, Knight GP, Unger JB, Samboanga BL, Des Rosiers Se, et al. Effects of language assessment on the measurement of acculturation: measurement equivalence and cultural frame switching. Psychol Assess. 2014; 26: 100-114.
- Arcia E, Skinner M, Baily D, Correa V. Models of acculturation and health behaviors among Latino immigrants to the U.S. Soc Sci Med. 2001; 53: 41-53.
- Alegría M. The challenge of acculturation measures: what are missing? A commentary on Thomson & Hoffman-Goetz. Soc Sci Med. 2009; 69: 996-998.
- Abraído-Lanza AF, Armbrister AN, Florez KR, Aguirre AN. Toward a theory-driven model of acculturation in public health research. Am J Public Health. 2006: 96: 1342-1346.
- Murillo R, Albrecht SS, Daviglus ML, Kershaw KN. The role of physical activity and sedentary behavior in explaining the association between acculturation and obesity among Mexican-American adult. Am J Health Promot. 2015; 30: 50-57.
- Guthold R, Stevens GA, Riley LM, Bull FC. Worldwide trends in insufficient physical activity from 2001 to 2016: a pooled analysis of 358 population-based surveys with 1•9 million participants. Lancet Glob Health. 2018; 6: e1077-e1086.
- Pérez-Stable EJ, McMillen MM, Harris MI, Juarez RZ, Knowler WC, Stern MP, et al. Self- reported diabetes in Mexican Americans: HHANES 1982-1984. Am J Public Health. 1989; 79: 770-772.
- Cantero PJ, Richardson JL, Baezconde-Garbanati L, Marks G. The association between acculturation and health practices among middle-aged and elderly Latinas. Ethn Dis. 1999; 9: 166-180.


