Capturing Individual Sleep, Mood, and Psychotic Symptom Dynamics over Time: A Case Illustration of Novel Ideographic Modeling and Visualization Strategies
- 1. Department of Maine Medical Center Research Institute, Center for Psychiatric Research, USA
- 2. Department of Psychological Sciences, Purdue University, USA
- 3. Department of Dyadic Data Consulting, LLC, USA
- 4. Department of Massachusetts Mental Health Center Public Psychiatry Division of the Beth Israel Deaconess Medical Center, USA
- 5. Department of Center for Contextual Psychiatry, Neurosciences, Belgium
- 6. Department of Research Group of Quantitative Psychology and Individual Differences, KU Leuven, Leuven, Belgium
- 7. Department of Maine Medical Center, USA
- 8. Department of Psychiatry, Harvard Medical School, USA
Abstract
Emerging psychotic disorders are complex mental health conditions with widely heterogeneous clinical presentations. Advances in ideographic analyses may facilitate understanding of this complexity and inform personalized medicine approaches to psychosis treatment. Ideographic analysis included a case example from an experience sampling method (ESM) study of affect and psychosis in 35 individuals aged 15-25 diagnosed as at clinical high risk for psychosis (CHR) or with recent-onset psychosis (early psychosis, EP). Participants received 6 prompts per day within an individualized 12-hour window for 21 days using a smartphone application. They rated experiences of positive affect, negative affect, and psychotic symptoms and recorded daily sleep onset and offset times. The case example was one of a subset (n=9) of participants who provided an additional 21-days of ESM data either 6 or 12-months after initial participation. Line graphs and ribbon plots provide visualizations of the case example’s moment- and day-level symptom data, respectively. Symptom networks were estimated using group iterative multiple model estimation (GIMME). Line graphs illustrate momentary affective and psychotic symptoms over two data collection periods of three-weeks separated by 6 or 12 months. Ribbon plots depict covariation of day-level symptom data, including sleep data. Symptom network plots depict uni- and bi-directional connections between day-level symptom data and sleep variables. Ideographic modeling and visualization of symptoms over different temporal periods offer unique perspectives for understanding changing symptom patterns and relations in emerging psychotic disorders. Ideographic analyses have the potential to enhance individualized, hypothesis-driven assessment and selection of treatment priorities.
Keywords
• Psychosis
• Experience Sampling Methodology
• Symptom Dynamics
• Symptom Networks
• Clinical High Risk for Psychosis
CITATION
Weiss DM, Aslinger E, Cook WL, Johnson KA, Lafit G, et al. (2023) Capturing Individual Sleep, Mood, and Psychotic Symptom Dynamics over Time: A Case Illustration of Novel Ideographic Modeling and Visualization Strategies. JSM Schizophr 3(1): 1014.
ABBREVIATIONS
CHR: Clinical High Risk For Psychosis; EP: Early Psychosis, Recent-Onset Psychosis; ESM: Experience Sampling Methodology; GIMME: Group Iterative Multiple Model Estimation; PA: Positive Affect; NA: Negative Affect
INTRODUCTION
No two individuals are exactly alike – an adage that is widely accepted in the clinical realm but less so in psychopathology research where emphasis is on group trends. Research in emerging psychopathology is dominated by nomothetic approaches, which examine similarities within and differences between groups with and without a given characteristic (e.g., psychosis). Nomothetic research is guided by current nosology despite the heterogeneity found both within and across diagnostic classifications, especially within the “Schizophrenia Spectrum and Other Psychotic Disorders” section of the DSM-5 [1]. Examples of nomothetic research include distinguishing non affective from affective psychosis [2,3] or clinical high risk (CHR) from early psychosis (EP; recent onset psychosis) categories [4]. Others have utilized symptom profiles to identify subgroups [5] or have linked subgroups to distinct functional outcomes [6]. The need to move beyond nomothetic approaches to ideographic approaches, which examine variations in an individual over time [7], is exemplified by data which demonstrated that specific diagnoses shifted for approximately half of a first episode sample in a 2.5 year period [8]. Thus, while nomothetic approaches have furthered the understanding of psychotic disorders and have guided evidence-based practices, ideographic approaches are needed to understand person-specific causal pathways for individualized approaches to care [9].
Methodologically, experience sampling methodology (ESM) is well-suited to capture an individual’s symptom variations over time by tracking “moment-to-moment” fluctuations of psychological constructs of interest and their temporal relations [10-12]. Repeated observations allow for estimation of lagged effects, the degree to which a variable measured at one time predicts itself or other variables at a subsequent time [13]. These analytic approaches are especially important for modeling symptoms (e.g., affect) that change rapidly or within the same day [14,15]. Ideographic analyses may offer particular value in understanding the role of transdiagnostic symptoms, such as sleep disturbance, in the symptom trajectories of individuals with emerging and recent onset psychosis [16]. This could build on nomothetic analyses that have identified, for instance, temporal relations between sleep quality, paranoia, and negative affect in psychotic disorders [17].
Innovations in ESM methods and statistical approaches are providing new opportunities to study symptom dynamics that precede the acute onset of psychosis within an individual. Longitudinal ESM data can help illustrate whether person specific symptom networks shift across temporal frames, and suggest important clinical transitions and responses to external events or interventions [18]. Newly developed statistical tools, such as group iterative multiple model estimation (GIMME), allow for this type of ideographic analysis. Specifically, GIMME has the advantage of modeling both lagged and contemporaneous symptom relations across group, subgroup, and individual levels [7]. Additionally, GIMME estimation can provide directionality of effects within longitudinal ESM data. Initially developed for neuroimaging data [19], GIMME has been more recently applied to assess group-level and person-specific symptom networks for psychological data [7,20,21], including in individuals with CHR [22,23].
Use of analytic methods such as GIMME with data visualizations across different temporal frames offers a glimpse at the potential of ideographic analyses for advancing personalized medicine within the context of early intervention for psychosis. In the methods section for this longitudinal observational study, we report on measures and procedures for obtaining ESM data and for producing GIMME analysis and data visualizations. The results sections outline on the ideographic analyses of positive and negative affect, sleep, and psychotic symptoms using ESM data from a case example (henceforth “CE”) who transitioned from CHR to EP between baseline and 12-month follow up. These results demonstrate ways ideographic analysis can identify symptom changes that may be missed within the current diagnostic classification system. The discussion section reviews the potential of ideographic analyses to facilitate case formulation and treatment planning even with existing limitations. Importantly, observations and interpretations presented are meant to illustrate potential clinical applications of idiographic analyses rather than to suggest firm clinical conclusions.
METHODS
The longitudinal observational study from which the case example is drawn measured psychotic symptoms, positive affect (PA), negative affect (NA), sleep duration, and sleep midpoint as variables of interest for characterizing emerging pathways to affective and non-affective psychosis (see https://osf.io/hdu4p/ Supplemental Materials for parent study methods/procedures).
Participants
CE was selected from a sample of 35 individuals ages 15-25, diagnosed as CHR or EP using the SCID-5 (Structured Clinical Interview of DSM-5 [24] and SIPS (Structured Interview of Psychosis-Risk Syndromes [25]. We have disguised CE to prevent identification.
Procedures
Staff obtained written informed consent from CE’s parents and assent from CE. Trained bachelor and masters’ level research staff administered diagnostic assessments and oriented subjects to the survey items on the smartphone app, MetricWire®, a commercial HIPAA-compliant mobile technology service for ESM research (www.metricwire.com). Each participant was asked to respond to 6 semi-random prompts within an individualized 12 hour window for 21 days. The first prompt of each day queried sleep onset and offset times for the prior night. Participants were invited to repeat the study at 6- or 12-months, with assessments completed remotely due to the SARS-CoV-2 pandemic. CE completed a repeat ESM protocol at 12 months. Remuneration up to $320 for each assessment/ESM period incentivized high survey completion.
Measures
Negative Affect (NA), was measured with 9 one-word items from an established ESM item repository [26]: “anxious”, “lonely”, “irritable”, “tired”, “down”, “insecure”, “guilty”, “stressed”, “physically uncomfortable”. Participants were asked to rate the degree they felt on a 7-point Likert scale ranging from 1 (“not at all”) to 7 (“Very much”).
Positive Affect (PA), was measured with 3 items from the repository: “happy”, “content”, “relaxed” rated on the aforementioned Likert scale.
Psychotic Symptoms were measured with 9 items, including 7 items that assess potentially delusional or disorganized experiences: “I feel suspicious”, “I can’t let go of my thoughts”, “My thoughts are influenced by other people”, “I feel unreal”, “I feel like I am losing control (of my thoughts)”, “It’s hard to express my thoughts in words”, and “My thoughts are so loud, it’s as if I can hear them”; and 2 items that assess hallucinations: “I see things that other people can’t see” and “I hear things that other people can’t hear”. Participants were asked to rate each item at the time of the prompt on the same 7-point Likert scale used for affective symptoms.
Sleep Duration and Sleep Midpoint were calculated based on responses from two items: “What time did you fall asleep last night?” and “What time did you wake up?” Participants adjusted a digital clock to answer each question. Sleep midpoint, the halfway point between sleep onset and wake time, represents a marker of circadian rhythm [27]. It was centered at midnight. Sleep duration was calculated as the difference between reported sleep onset and wake times.
Statistical Analysis
Analyses were conducted in R version 3.6 (R Core Team, 2019). Means were calculated by item cluster: NA, PA, and psychotic symptoms. For participants who answered three or more prompts within a day, day-level means were calculated from moment-level means. PA and NA temporal instability was assessed via mean squared successive difference (MSSD), the average of the squared difference between successive moment to-moment observations within a day [28-30]. Higher MSSD values indicate more affective instability.
Data Visualization Application to Behavioral ESM Data
Using the R package “ggplot2”[31], line graphs depicted moment-level means for PA, NA, and psychotic symptoms for each 21-day ESM observation window. Sleep ribbon plots were constructed using Python, version 3.7 [32]. Plots depicted a 48 hour window (y-axis) to account for sleep across two successive days (e.g., sleep onset at 10PM on Day 1 with 8AM offset on Day 2). Line graphs of day-level means of psychotic symptoms, PA, and NA accompanied ribbon plots in order to visualize covariations with sleep variables.
GIMME Application to Behavioral ESM Data
Group and individual symptom networks were estimated and depicted using the package “gimme” [33] in order to examine temporal covariations between variables of interest (see https:// osf.io/hdu4p/ for group and individual symptom networks). In GIMME, network estimation uses a structural vector autoregressive model with both contemporaneous and lagged parameters [34]. GIMME models estimate the directionality of detected relations by satisfying requirements for Granger causality, in which past values of one variable contain information used to predict a second variable above and beyond past values of that variable [35].
GIMME plot interpretation followed prior approaches [36,37]. Symptoms are represented with circles or “nodes”. Relations between nodes, represented by lines, are referred to as “connections”, can reflect positive or negative associations, and can represent lagged and contemporaneous associations [38].
To include sleep, a day-level variable of specific interest, in network analyses, we aggregated ESM symptom data into day level means. We also estimated networks of symptom instability using day level NA and PA MSSD. Although there have been mixed reports about the added value of dynamic vs. static measures of affect in nomothetic analyses, they may have value in ideographic analyses [39,40]. All GIMME models included sleep duration and sleep midpoint as lead variables (by one day). This was performed to detect the degree to which NA, PA or psychotic symptoms predict the subsequent night’s sleep in addition to the degree to which the prior night’s sleep affects NA, PA, or psychotic symptoms. Network analyses were constrained to prevent the detection of temporally-impossible connections (i.e., sleep variables predicting psychotic/affective symptoms that have already occurred).
RESULTS OF IDEOGRAPHIC DEMONSTRATIONS
Moment-level and day-level visualizations of baseline ESM data
Line graphs and sleep ribbon plots depict visualizations for CE (Figure 1),
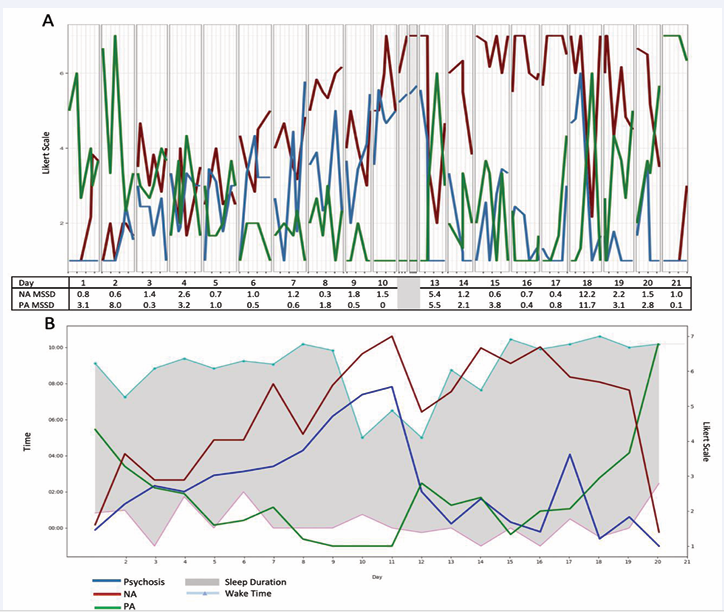
Figure 1: Data visualizations of moment-level and day-level ESM data for the case example. A) Moment-level data of NA, PA, and psychotic symptoms with average NA and PA MSSD levels per day across a 21-day observation window B) Ribbon plot of sleep duration, sleep onset, and sleep offset times with daily means of PA, NA, psychotic symptoms across 21-day observation window. Daily means for symptoms and affective instability were not calculated on days 11 & 12 as only two prompts were answered.
an adolescent White male who met criteria for CHR. At baseline, he endorsed attenuated delusional ideas, interpersonal suspiciousness, visual and auditory hallucinations, and disorganized communication. He met criteria for recurrent moderate major depressive disorder and post-traumatic stress disorder. Baseline medications included an antidepressant and an atypical antipsychotic with stable dosage over the preceding 6 weeks.
The line graph (Figure 1A) for CE depicts symptoms that vary from moment to moment. Within-day symptoms appear to fluctuate widely during some days; e.g., days 6, 7, and 18 show marked psychotic symptom variability. Higher and more unstable PA appears at the beginning and end of the ESM window, with more exclusively high NA throughout the second and into the third week.
A ribbon plot of sleep onset and offset times with day-level symptom means for CE (Figure 1B) reflects earlier wake times and fewer hours of sleep during the second week of the baseline ESM window. This disruption appears to follow elevations of NA and psychotic symptoms and low levels of PA. Thus, the two graphs (line vs. ribbon) illustrate distinct information on clinical dynamics. Momentary data visualizations may help a client-clinician dyad explore factors (e.g., specific stressors, contextual factors, time of day) contributing to intermittent or acute exacerbations of symptoms (e.g., spike in psychosis on day 18) or symptom dynamics (e.g., affect instability on day 13). In contrast, day-level data visualizations may allow a client-clinician dyad to generate hypotheses about broader day-to-day changes including in sleep.
Moment-level and day-level visualizations of 12-month follow-up ESM data
At 12-month follow-up, CE met criteria for schizophrenia and endorsed symptoms of two hypomanic episodes between assessments. His level of care changed from a community provider to an EP coordinated specialty care clinic. His antidepressant dosage increased between assessments and antipsychotic medication remained consistent. He had initiated a romantic relationship. Although the SARS-CoV-2 pandemic started between assessments, CE denied significant pandemic related impacts.
Figure 2 depicts CE’s 12-month ESM data.
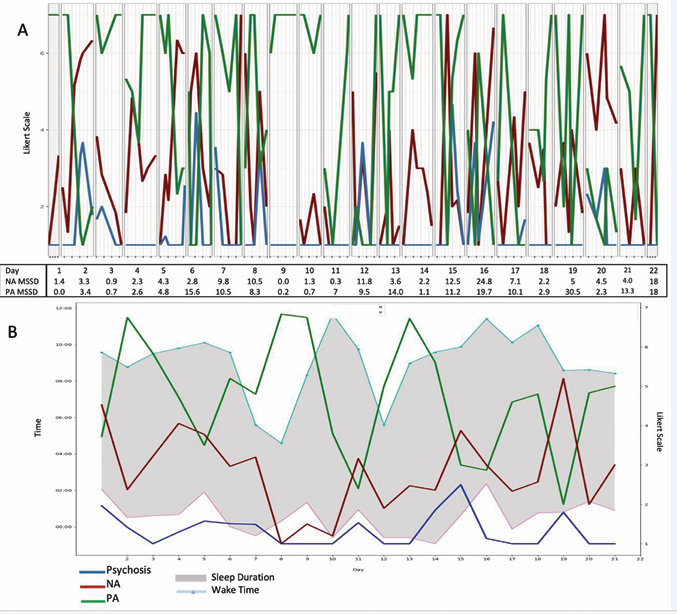
Figure 2: Twelve-month follow-up moment- and day-level ESM data for the case example. A) Moment-level data of NA, PA, and psychotic symptoms with average NA and PA MSSD levels per day across 21-day observation window. B) Ribbon plot of sleep duration, sleep onset, and sleep offset times with daily means of PA, NA, psychotic symptoms across 21-day observation window.
Line graphs (Figure 2A) suggest lower but more unstable levels of NA relative to baseline (Figure 1A). They also suggest lower, stable psychotic symptoms, including multiple days without psychotic symptoms. Despite CE’s transition to schizophrenia, his data do not reflect an increase in the intensity or frequency of psychotic symptoms. Affective instability appears more clinically salient at 12 months.
CE’s follow-up ribbon graph (Figure 2B) illustrates the value of day-level data, in particular sleep. Day-level psychotic symptoms remain low but sleep onset and wake times, as well as day-level PA and NA, are unstable relative to the baseline (Figure 1B). Earlier wake times precede elevations in PA, providing potentially important clinical information given the report of two hypomanic episodes. A nomothetic approach reliant on clinical diagnosis might mistakenly prompt a clinician and client to prioritize treatment of psychotic symptoms in spite of their infrequence and/or low intensity. In contrast, an ideographic approach might prompt greater attention to affective experiences, sleep, and earlier intervention in potential hypomanic episodes. Thus, ESM data from two observation periods highlight the potential role of ideographic analyses for understanding clinically meaningful symptom dynamics likely to be missed by traditional nomothetic frameworks.
Symptom network models with means and dynamic variables
The baseline symptom network with affective means (Figure 3A)
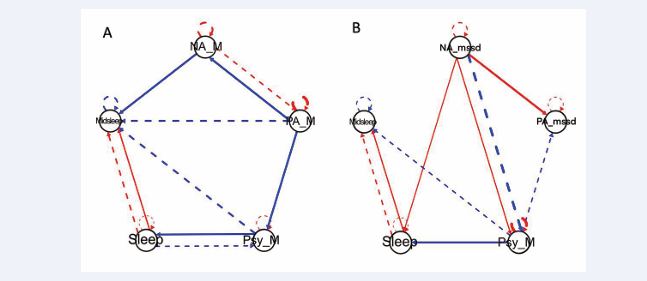
Figure 3: Symptom network plots for the case example’s baseline ESM data A) Symptom network plot using daily means of affective data to show contemporaneous (solid line) and lagged (dashed line) relationships between positive and negative affect, psychotic symptoms, sleep duration, and midpoint sleep. B) Symptom network plot using affect variability measures (mean squared successive difference) to show contemporaneous (solid line) and lagged (dashed line) relationships between positive and negative affect, psychotic symptoms, sleep duration, and midpoint sleep. For both plots, red connections indicate positive relationships while blue connections indicate negative relationships. Line thickness indicates strength of relationship.
depicts complex bidirectional relations such that 1) lower PA predicts higher concurrent psychotic symptoms and NA but 2) higher NA predicts higher PA on the subsequent day. This symptom network might prompt a clinician and CE to explore whether low PA triggers subsequent NA or psychotic symptoms and/or whether coping strategies for managing high NA lead to higher PA.
In examining connections with sleep variables, higher levels of psychosis result in fewer hours of sleep that night, which subsequently predicts higher levels of psychotic symptoms during the subsequent day. This escalating feedback loop might represent an important clinical target. Interestingly, the connection between higher levels of psychosis and an earlier sleep midpoint during the subsequent night is consistent with the baseline ribbon plot (Figure 1B) pattern in week 2.
When affect instability is included in the network analysis (Figure 3B), higher NA instability predicts higher concurrent PA instability. Higher NA instability predicts higher concurrent psychotic symptoms but lower psychotic symptoms over the subsequent day. Higher mean levels of psychotic symptoms predict lower PA instability for the subsequent day, suggesting a stabilizing feedback loop.
Symptom network plots with 12-month follow-up ESM data
Two additional symptom networks, using day-level symptom means and day-level affect instability (Figure 4A and 4B),
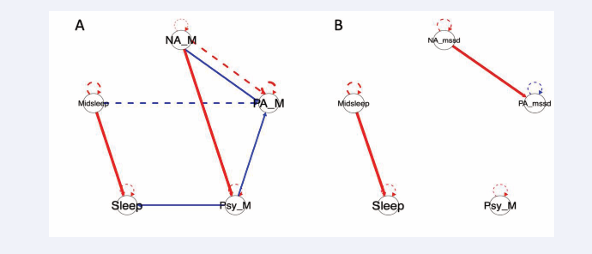
Figure 4: Symptom network plots of the case example’s 12-month ESM data A) Symptom network plot using daily means of affective data to show contemporaneous (solid line) and lagged (dashed line) relationships between positive and negative affect, psychotic symptoms, sleep duration, and midpoint sleep. B) Symptom network plot using affect variability measures (mean squared successive difference) to show contemporaneous (solid line) and lagged (dashed line) relationships between positive and negative affect, psychotic symptoms, sleep duration, and midpoint sleep. For both plots, red connections indicate positive relationships while blue connections indicate negative relationships. Line thickness indicates strength of relationship.
respectively, were estimated with CE’s 12-month ESM data. In (Figure 4A), higher NA predicts lower concurrent PA but higher subsequent day PA. Specifically, higher NA is associated with higher concurrent day psychotic symptoms, which in turn predict lower concurrent mean PA. In contrast to baseline, the 12-month follow-up plot may prompt a clinician and CE to explore possible mechanisms by which elevations in NA may trigger experiences of psychotic symptoms or lower PA.
Changes in symptom relations over time (and thus potential treatment targets) were also apparent when comparing CE’s baseline (Figure 3B) and 12-month follow-up (Figure 4B) plots including affective instability. In contrast to the number of connections estimated in the baseline plot, only two connections were detected in the follow-up network. Higher levels of PA instability still predict higher concurrent day-levels of NA instability but no connections were detected that included psychotic symptoms; reduced momentary and daily levels of psychotic symptoms may have reduced power for detecting such connections. However, given that this individual converted from CHR to EP, reductions in momentary and daily levels of psychotic symptoms in the absence of new or increased antipsychotic medication, whether reflective of changes in treatment (i.e., CE’s shift to a coordinated specialty care clinic) and/or interpersonal changes (i.e., initiation of romantic relationship) or other factors, is clearly of clinical import.
DISCUSSION
Early presentations of psychotic disorders are not easily captured by categorical diagnostic classifications which imply a level of stability or continuity of symptoms over time. Given the intersection of human and symptom development, the pattern and significance of symptom clusters is dynamic, with multiple pathways to a given state (equifinality) and a range of long-term clinical and diagnostic trajectories from that state (multifinality) [16,41,42]. Ideographic/within-person approaches are needed to understand the developmental psychopathology of psychotic disorders. The case example presented here illustrates the potentially rich clinical contribution of ideographic analyses, via the visualization of momentary- and day-level symptom data, estimation of symptom networks, and changes from one year to the next. Symptom relations vary according to the measurement type (i.e., mean levels versus day-level aggregates) and temporal frame of analysis (i.e., within day, across days, across a gap of 12 months) for an individual with emerging psychosis. Given the complexity of these relations and current limitations in analytic tools, ideographic approaches may be most relevant to clinical decision-making within the context of a collaborative treatment relationship in which hypotheses can be developed and tested.
Ideographic visualizations and analyses provide additional information that may help address the limitations of nomothetic (e.g., diagnostic category) approaches. First, visualizations of longitudinal data points may help a clinician/client dyad to identify symptoms not emphasized by the diagnostic category. For example, presuming that CE’s transition from CHR to EP was paramount might lead a clinician to focus primarily on psychotic symptoms, whereas the visualization of CE’s symptom reports might redirect the focus to affect or sleep. Second, ideographic visualizations and analyses can capture symptom changes in response to momentary events, which may prompt clinical exploration of antecedents of momentary symptom changes or of coping strategies to employ in the moment. Third, tracking symptom patterns across time (including transdiagnostic symptoms such as sleep), or even across changes in context, development, or treatment, can improve monitoring of trajectories or adjustment of treatment targets. Use of ESM methodology and ideographic analyses for symptom monitoring may be especially fruitful with psychotic or psychotic-like experiences, where symptoms may be experienced acutely during a finite period of time, intermittently, or with any number of other temporal patterns that are seldom captured by diagnostic classifications but are extremely relevant to treatment planning.
Ideographic assessment may enable clinicians to capture the clinical relevance of transdiagnostic symptoms and account for high rates of comorbidities prevalent in emerging psychosis [37]. The current study included measures of sleep based on prior nomothetic analyses of ESM data that indicated that sleep affects psychotic experiences [17,43,44]. Prior research with more traditional, nomothetic analyses have depicted homogeneous symptom relations between sleep, NA, and psychotic symptoms in individuals with schizophrenia [43], and with and without a psychotic disorder diagnosis [17]. In contrast, the ideographic analyses presented here depict distinct temporally-related connections between sleep, affect, and psychotic symptoms and changes within these connections over time.
A major strength of the current demonstration is its application of ideographic analyses and visualization of ESM data over different temporal scales in an individual who transitioned from a CHR syndrome to a diagnosed psychotic disorder. Importantly, these analyses cannot be used to justify definitive clinical conclusions. Recent work highlighted this, when 12 independent research teams selected different treatment targets based on the ESM data of a single individual [45]. This striking illustration of the ambiguity in both analysis and interpretation of intensive data might dampen enthusiasm for the utility of ideographic approaches. We present the CE illustrations to show case the value of intensive longitudinal data and ideographic analyses for generating personalized data driven clinical hypotheses that can be tested to inform clinical decision-making. These analytical approaches, however imperfect at this point in time, suggest the need to attend to psychopathological processes that are likely to be dynamic, multifactorial, and person-specific.
In recognizing the variety of analytic and interpretive choices illustrated by Bastiaansen and colleagues (2020), we will discuss a key decision in applying GIMME to ESM data. Moment-level ratings of symptoms (allowing for a possible 126 data points for the three-week ESM window) were aggregated into day-level means (possible 21 data points) in order to accommodate sleep variables, which are day-level variables. This decision may have reduced power and attenuated our ability to detect significant network connections, but enabled the inclusion of a variable of high interest in the emergence of psychosis. The number of data points available (n=21) is less than the optimal number (n=60) recommended by researchers evaluating the performance of GIMME within the context of day-level psychological data but even fewer data points (n=30) can yield valid and reliable estimated paths, albeit at the risk of missed connections [46]. Thus, the paths estimated in our reported analyses, relying on fewer data points, may be valid and reliable but may not include all valid connections. Additionally, the current ideographic demonstration is limited to one case example and with a limited number of symptom variables included in analyses. These analyses provide information only on symptom relations that occur during the window of time of data collection. This measurement strategy is not continuous or event-related, missing symptoms that occur between reported moments and outside of the data collection window.
Research in psychopathology often operates under the presumption that etiologies are discrete with the goal of eliding upon a single parsimonious explanation for mental health processes. Clinical reality reflects a myriad of contributing factors and complex causal pathways to mental health syndromes. Whereas current analyses emphasize affective and psychotic symptoms and sleep variables, a number of other possible symptom networks involving factors not assessed here, may exert influence on psychotic symptom experiences. Future researchers may prioritize different or additional variables including specific psychotic symptoms (e.g., hallucinations, delusions, disorganization, etc.). Other potential transdiagnostic symptoms may include substance use, suicidal ideation, and anxiety [47,48], all of which have been assessed within ESM paradigms in individuals with EP or CHR [49-51]. As ideographic approaches align with calls for personalized approaches to assess and treat psychopathology [52,53], variable selection may be guided by individuals’ clinical presentations and personal goals.
For clinical applications to be fully realized, future efforts will need to refine and standardize data collection procedures and analytic methods. Our case illustration offers an example to encourage this work. First, the collection of intensive longitudinal data may be facilitated through smartphone applications [54]. Second, the frequency, sampling, and duration of ESM data collection should accommodate the timescale (e.g., moments, days, weeks) by which symptoms may be thought to change while satisfying conditions of modeling tools such as GIMME [55]. When choosing the timescale in ESM studies, researchers should balance the need for more frequent or continuous prompts –more likely to capture symptom changes as they occur – with response burden. [56] For both research and clinical applications, comparison across different time scales and variables is likely to inform new and potentially testable hypotheses regarding the temporal dynamics of symptom change. Finally, in a clinical application, an iterative process may be most productive, stimulating collaboration between the clinician and client to identify appropriate symptoms and measurement intervals. Ideographic analyses have the potential to enhance clinical assessment by identifying temporal sequences and potentially causal associations between different symptoms. This unique dynamic frame can help clinicians tailor treatment to the individual and assist in evaluating the effectiveness of interventions on disrupting problematic patterns that maintain or exacerbate symptoms. To this end, existing trials have aimed to use ESM to tailor person-specific interventions and treatment priorities for individuals with mood and/or anxiety disorders [57,58]. Fewer efforts have incorporated ESM or ideographic analyses to develop personalized interventions for individuals with psychotic disorders. Ideographic applications are limited to the use of ESM to prompt individuals with psychotic disorders to use coping techniques in real-time [11, 59-61]. Symptom network analyses in psychosis have remained at the group level [62,63], providing generalizable information for the sample or population assessed. In contrast, ideographic symptom network analyses can provide information unique to an individual and thus inform personalized interventions that may differ for members of the group.
CONCLUSION
The adage that no two individuals are alike is widely accepted, but this has not yet translated to personalized treatment approaches for psychotic disorders. Intensive longitudinal data and ideographic analyses over different timeframes may help individuals and their clinicians identify and test hypotheses regarding patterns of suffering, find relief from symptom dynamics that are self-reinforcing, and maneuver a pathway of recovery. Novel methods such as these are key to improving individualized, hypothesis-driven assessment and selection of treatment priorities. Ongoing efforts are needed to refine analytic tools to further develop ideographic assessment and treatment applications for individuals experiencing psychosis. This unique approach can advance our understanding of mental health challenges, ultimately offering much-needed improvements to the ways in which we conceptualize and deliver mental healthcare.
ACKNOWLEDGEMENTS
DMW was responsible for visualizations, writing and editing original manuscript; EA for data analysis, software, visualization and editing manuscript; WLC for data curation, analysis, and editing manuscript; KAJ for data curation, investigation, methodology, project administration, and editing of manuscript; GL for conceptualization, methodology, and editing of manuscript; KME for data curation, investigation, and editing of manuscript; RIMG for project administration, supervision, and editing of manuscript; DR for conceptualization and review of manuscript; IMG for conceptualization, methodology, and editing of manuscript; and KAW for conceptualization, funding acquisition, methodology, project administration, resources, supervision, and writing and editing original draft. Institutional review boards at BIDMC and MMCRI approved study procedures.
FUNDING SOURCE
The National Institute of Mental Health (grant number R21 MH116240 provided support for DME, KAJ, RIMG, and KAW with funding for research activities.
REFERENCES
14. Hamaker EL, Wichers M. No Time Like the Present: Discovering the Hidden Dynamics in Intensive Longitudinal Data. Curr Dir Psychol Sci. 2017; 26: 10-15.
22. van der Tuin S, Nikita Groen R, Castro-Alvarez S, Oldehinkel AJ, Booij S, Wigman J, et al. Group, subgroup, and person-specific symptom associations in individuals at different levels of risk for psychosis: A combination of theory-based and data-driven approaches. Schizophr Bull. 2021; 2: sgab047.
32. Van Rossum G, Drake FL. Python reference manual. Indiana: iUniverse. 2000.
33. Lane S, Gates K, Molenaar P. Gimme: Group iterative multiple model estimation.
34. Beltz AM, Gates KM. Network Mapping with GIMME. Multivar Behav Res. 2017; 52: 789-804.


