Identification and Evaluation of Novel Candidate Biomarkers in Gastrointestinal Stromal Tumors (GIST) Tissue for Fluorescence Image-Guided Surgery (F-IGS)
- 1. Department of Surgery, Leiden University Medical Center, The Netherlands
- 2. Department of Radiology, Leiden University Medical Center, The Netherlands
- 3. Department of Urology, Leiden University Medical Center, The Netherlands
Abstract
Gastrointestinal stromal tumors are rare mesenchymal tumors for which complete surgical resection is the only curative treatment, but intraoperative discrimination between tumor and healthy tissue remains chal-lenging. This study aimed to identify molecular biomarkers suitable for fluorescence image-guided surgery in gastrointestinal stromal tumors beyond KIT and DOG1. Biomarker candidates were identified through integrated database mining (Euretos, Open Targets, and clinical trial registries). Candidate selection was refined based on overlap across datasets and membrane localization, resulting in selection of CD243 (ABCB1), PDE3A, PIK3CG, DDR2, and TEM1. Immunohistochemistry was performed on 23 patient-derived tumor samples with matched adjacent tissue, and tumor-to-normal ratios and expression patterns were analyzed. CD243 and PDE3A showed the most favorable tumor-to-normal ratios across multiple tissue types, while PIK3CG demonstrated intermedi-ate expression. TEM1 and DDR2 showed more variable expression and lower overall scoring. A composite scor ing system integrating expression patterns and tumor specificity identified CD243 and PDE3A as leading candi-dates. These results suggest that CD243 and PDE3A are promising targets for further development of fluores-cence-guided surgery in gastrointestinal stromal tumors, warranting validation in preclinical imaging models and clinical translation studies
Simple Summary
Gastrointestinal stromal tumors are rare cancers of the digestive tract that are usually treated with surgery. However, it is often difficult for surgeons to clearly distinguish tumor tissue from healthy tissue during an operation, due to minimal tactile feedback and intraluminal tumor depositions. Especially in patients with metastasized disease which can lead to incomplete removal or unnecessary removal of normal tissue. Fluo-rescence-guided surgery, in which tumor targeting molecules are linked to a fluorescent signal, may improve tumor visibility during surgery. In this study, we searched multiple biological databases and combined the re-sults with protein data from tumor tissues to identify potential molecular targets in gastrointestinal stromal tumors. We then validated several candidate targets in patient tumor samples using laboratory staining techniques. We identified several proteins that are highly expressed in tumor tissue compared to normal tissue, with some showing favorable characteristics for imaging applications. These findings may help develop new imaging tools to improve the precision of surgery for patients with gastrointestinal stromal tumors.
Keywords
• Gastrointestinal Stromal Tumor
• Fluorescence-Guided Surgery
• Biomarkers
• CD243
• PDE3A
• PIK3CG
• Tumor-to-Normal Ratio
• Image-Guided Surgery
Citation
Vogely CLA, Angelino MJ, Kalisvaart GM, Vahrmeijer AL, Van der Hage JA, et al. (2026) Identification and Evaluation of Novel Candidate Biomarkers in Gastrointestinal Stromal Tumors (GIST) Tissue for Fluorescence Image-Guided Surgery (F-IGS). J Cancer Biol Res 13(1): 1158.
INTRODUCTION
Gastrointestinal stromal tumors (GIST) are malignant mesenchymal tumors of the gastrointestinal tract that account for less than 1% of all gastrointestinal cancers. The incidence of approximately 1-1,5 per 100.000 worldwide, makes GIST a rare type of cancer [1-3]. GISTs can occur anywhere along the gastroin-testinal tract but arise mostly in in the stomach (50-60%) or the small intestines (30-35%) [4]. Surgical re-section is the only curative treatment option in GISTs [3]. However, the recurrence rate of GIST is high, with more than 50% chance of developing local recurrence and/or metastatic disease within 2-5 years without adjuvant treatment [5,6]. The five-year survival rate varies from 53%-93%, depending largely on whether disease is localized or advanced at diagnosis [7].
Currently, surgery is the only curative treatment for GIST [3]. Preoperative imaging such as x-ray, CT or MRI, intraoperative palpation and visual inspection are used to identify tumor tissue that is to be resected. However, these methods are not always sufficient for discrimination between malignant and healthy tissue leading to irradical resections or unnecessary removal of healthy tissue [8]. Fluorescence Image-Guided Surgery (F-IGS) has the potential to improve tumor identification and cancer surgery out-comes as it aids in tumor visibility. With F-IGS, a fluorescent label is conjugated to a tumor specific agent. In the body, the tumor specific agent binds to a biomarker that is highly expressed on membrane of malignant cells and is less or absent on the membrane of non-malignant cells. The fluorescent label emits light in the near-infrared fluorescent (NIRF) spectrum (wavelength between 700 and 900 nm). It has the advantage that it is invisible to the human eye, thus does not alter the conventional surgical field but can be picked up by special camera for direct visual feedback of the tumor during surgery [8]. Furthermore, it can penetrate tissue to a depth up to 10 mm making underlying structures visible. In general, the amount of clinical trials using biomarker-targeted fluorescent agents is increasing. In non-GIST malignancies the use of F-IGS shows to improve the detection of peritoneal lesions and was associated with improved survival [9]. However, for primary type tumors and detection of surgical margins and intraoperative staging more research is preferable [9]. Therefore, the potential of F-GIS in GIST is to be explored.
Approximately 95% of GISTs express KIT (CD117) and/or DOG1 [3]. Successful in vivo fluorescence imaging of GIST has been demonstrated using anti-KIT antibodies in mouse models [10]. However, several studies pointed out that tumors lose KIT expression after treatment with imatinib, a tyrosine kinases in-hibitor which is often used as (neo)adjuvant therapy in GISTs [11]. For DOG1 no clinical antibody is cur-rently available. Making them both potentially less reliable and feasible as a target for F-IGS.
The objective of this preclinical study is to identify suitable molecular biomarkers suitable for tumor-targeted imaging in GIST besides KIT and DOG1 and to examine the suitability of the identified potential biomarkers.
MATERIALS AND METHODS
Database Search
Euretos: Euretos is an AI platform which searches multiple databases. The search string used on the platform was ‘Gastrointestinal stromal tumors’. To only include proteins of genes which were expressed at the outer surface of the cell (essential for IGS), the search was narrowed down using the parameters: ‘related genes to gastrointestinal stromal tumors’, gene location: plasma membrane, references: all, min-imal number of references: 5, taxonomy: human.
Open Targets: Open Targets is a platform for therapeutic target identification (https://www.opentargets.org/). The search string used on the platform was ‘Gastrointestinal stromal tumor’. Selected data type filters were: ‘genetic associations, ‘somatic mutations’, ‘drugs’, ‘pathways & system biology’ and ‘animal models’. The selected target classes were: ‘enzyme’, ‘membrane receptor’, ‘structural protein’, ‘surface antigen’ and ‘unclassified protein’, to provide us with a list of target which were supposed to expressed at the plasma membrane of GISTs.
Clinical Trials: Data from ClinicalTrials.gov and the EU Clinical Trial Register were searched for clinical trials which used monoclonal antibodies in patients with GISTs. The EU Clinical Trials Register (www.clinicaltrialsregister. eu/) and clinical trials.gov (clinicaltrials.gov/) databases were searched with the keywords ‘gastrointestinal stromal tumor’ and ‘GIST’. Data from clinical trials were included to in-clude tumor biomarkers which were currently tested in a clinical setting.
Proteomics: An important aspect of tumor-targeted imaging is that the protein has to be upregulated in tumor tissue relative to adjacent non-tumor tissue. To assess which genes were upregulated in comparison to the surrounding tissue around the GIST, an article which describes the proteomic map around GIST was used. In this study, a quantitively analysis of the proteomics between tumor tissue (T) and adjacent non-tumor tissue (N) was performed (Appendix 1).
Patient and Tissue Selection
A total of 23 formalin-fixed, paraffin-embedded (FFPE) tissue samples containing GIST tumor with adjacent tissue from patients who underwent surgical resection in the Leiden University Medical Centre (LUMC) were collected from the Department of Pathology and the BWD Biobank. The tissue samples were sliced and stained using CD243 rabbit monoclonal antibody (ab170904) in 1:600, PDE3A rabbit polyclo-nal antibody (ab244337) in 1:400, PIK3CG mouse monoclonal antibody (ab140307) in 1:150, DDR2 mouse monoclonal antibody (ab63337) in 1:250 and TEM1 rabbit monoclonal antibody (ab204914) in 1:4000, all from Abcam. For antigen retrieval HRP-labeled anti mouse (K4001) and HRP-labeled anti-rabbit (K4003) from DAKO was used. (Appendix 2)(Supplementary Table 1 and Supplementary Table 2).
Evaluation of Immunohistochemical Staining
Expression of the potential biomarkers was scored independently by two observers of which a final agreement of score was determined. Kappa statistics were used to calculate agreement scores between the two observers. The intensity and proportion of the membranous expression of the tumor, muscle, mucosa, connective tissue and blood vessels were scored, based on a semi-quantitative assessment. The proportion score (PS) represents the amount of positively stained cells and was assessed on a scale from 1-5 (1 = absent, 2 = 1-24% positive cells, 3 = 25-49% positive cells, 4 = 50-75% positive cells, 5 = >75% positive cells) and the intensity score (IS) represents the staining intensity and was assessed on a scale from 1-4 (1 = absent, 2 = weak, 3 = moderate, 4 = strong). An overview of the different intensity scores can be found in the (Appendix 3). The total immunostaining score (TIS) was calculated by the multiplication of the propor-tion score and the intensity score (TIS = PS x IS). If the PS of the tissue was scored as absent, the IS was inherently scored as absent. The TIS score of the tumor and the adjacent tissue per type of tissue were used to calculate the tumor-to-normal (T/N) ratio to make relative comparisons between tissue types. A target selection scoring system was developed (Appendix 4) (Supplementary Table 3), where expression pattern of the biomarker, T/N of muscle, mucosa, connective tissue and blood vessels and percentage of biomarker positive GIST tumors were scored. Homogenous expression of the candidate biomarker in the GIST tumor would yield 2 points, while heterogenous expression would yield 1 point. The points would be awarded per tissue sample, resulting in an average. The amount of points for the T/N ratio are categorized. For muscle, mucosa and connective tissue if the T/N ratio would be below <1, negative points would be rewarded as the adjacent tissue would have a higher expression compared to the tumor and would clinically be bothersome. The amount of points rewarded for the T/N of blood vessels is lower than other tissue types due to the pattern of the vessels differentiation by eye would be possible. A maximum of 22 points could be acquired.
Statistical Analysis
Statistical analysis was performed using SPSS version 25 (IBM Corp., Armonk, NY, USA). Data is presented as the mean (± standard deviation), unless otherwise specified. Means of immunohistochemical staining scores and tumor to-normal ratios were compared using an Wilcoxon Signed Ranks test. A p-value of <0.05 was considered to indicate a statistical significant difference. Graphs were made using GraphPad Prism 9.0.1 (version 9.0.1, IBM Corp).
RESULTS
Database Research
Search and Selection of Biomarkers: The biomarker search for GIST identified 139 candidates via Euretos, 179 via Open Targets, and 47 from clinical trial databases. To assess tumor-specific upregulation, these datasets were integrated with a quantitative proteomics study by Liu et al., who profiled 9,177 proteins in 13 GIST patients and defined upregulation as a tumor-to-normal ratio >1.0 [12]. This resulted in 517 proteins consistently upregulated in GIST, forming the core proteomic dataset for further analysis.
We hypothesized that biomarkers appearing in multiple databases would have higher validity. KIT, a known diagnostic marker for GIST, was identified across all datasets, supporting the approach, whereas DOG1 was not consistently detected. Proteins present in the proteomic dataset and at least one additional source were further filtered for extracellular localization using the Human Protein Atlas.
Based on this integrated approach, CD243 (ABCB1), PDE3A, PIK3CG, and DDR2 were selected as primary candidates. TEM1 was additionally included based on prior evidence from a systematic review in soft tissue sarcomas by the Leiden image-guided surgery group (Figure 1).
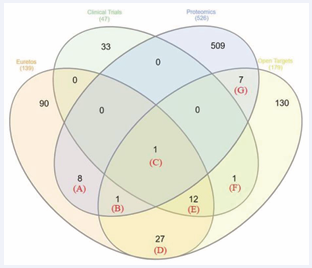
Figure 1: Venn diagram depicting overlap between identified genes through various resources. The labels (A), (B), (C), (D), (E), (F), (G) depict various overlap between proteins found in different databases. See appendix supplement 1.
Selected Biomarkers: CD243 (P-glycoprotein/ MDR1) is an ATP-dependent efflux transporter implicated in chemotherapy resistance and expressed in 68–86% of GISTs [13]. Its high expression and feasibility for fluorescence imaging support its potential as an image guided surgery target [14].
PIK3CG is a serine/threonine kinase involved in immune signaling and cytoskeletal regulation [15]. It is expressed in multiple GIST cohorts and has been associated with pro-oncogenic signaling in PI3K/AKT pathways [16].
TEM1 (CD248) is a transmembrane protein involved in angiogenesis and tumor stroma interaction [17,18]. Although not identified in the primary screen, prior sarcoma literature reports expres-sion in ~30% of GISTs, and it has shown promise as an imaging target in preclinical models [19].
PDE3A regulates intracellular cAMP/cGMP signaling and is involved in proliferation and apoptosis pathways relevant to tumor biology [20]. It is expressed in a high proportion of GISTs and has emerging therapeutic relevance, including sensitivity to PDE3A-modulating compounds [21,22].
DDR2 is a collagen-activated receptor tyrosine kinase involved in tumor cell–matrix interactions [23]. Although its expression in GIST is not well characterized, it is biologically plausible and targeted by imatinib, supporting further investigation [24].
Patient and Tumor Characteristics
Patient and tumor characteristics be found in (Table 1). The median age at diagnosis was 64.5 (range 38-83). In this population, localization of the tumor was preferably the stomach (70%). One tumor was presented as recurrence (4.3%) and one as metastasis (1.3%). Five patients (21.7%) underwent neo-adjuvant therapy (imatinib) prior to surgery.
Table 1: Patient and tumor characteristics
|
|
n = 23 |
|
Median age at diagnosis, years (range) |
64.5 (38-83) |
|
Gender, n (%) Male Female |
12 (52.2 %) 11 (47.8 %) |
|
Anatomical site of tumor, n (%) Stomach Small intestine Ileocecal Sigmoid Liver |
16 (70 %) 4 (17.4 %) 1 (4.3 %) 1 (4.3 %) 1 (4.3 %) |
|
Presentation status, n (%) Primary tumor Recurrence Metastasis |
21 (91.3 %) 1 (4.3 %) 1 (4.3 %) |
|
Neo-adjuvant therapy, n (%) Yes No |
5 (21.7 %) 18 (78.3 %) |
|
Median tumor size, cm (range) |
4.5 (1.7-9.0) |
|
Tumor size (cm), n (%) ≤ 2 > 2, ≤ 5 > 5, ≤ 10 > 10 |
1 (4.3%) 13 (56.5%) 7 (30.4%) 2 (8.7%) |
|
Mitotic count (per 5 mm²), n (%) < 5 > 5, ≤ 10 > 10 |
11 (47.8 %) 5 (21.7 %) 7 (30.4 %) |
|
Histological subtype, n (%) Spindle type Epithelioid Mixed type |
15 (65.2%) 4 (17.4%) 4 (17.4%) |
Immunohistochemistry
Tumor Intensity Score: CD243 expression was observed in 78% of the GIST tissues in moderate to high intensities with a mean Tumor Intensity Score (TIS) of 7.79 (SD 4.87) out of 22 maximum. DDR2 and PDE3A expression was observed in 100% of the GIST tissues with a mean TIS of 13.02 (SD 4.04) and 14.22 (SD 3.64). PIK3CG expression was observed in 69.3% of the GIST tissues in a mean TIS of 6 (SD 4.02). TEM1 expression was observed in 43.5% of the GIST tissues with a mean TIS of 4.65 (SD (4.89). Representative images of biomarker expression can be found in (Figure 2-6).
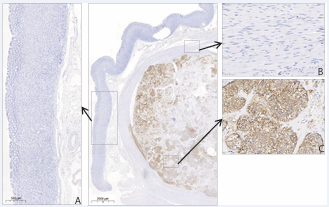
Figure 2: Representative image of CD243 expression of GIST tumor with adjacent tissue. A: mucosal and connec-tive tissue showing no CD243 expression. B: muscle tissue showing no CD243 expression. C: GIST-tumor ex pressing CD243 in high intensity.
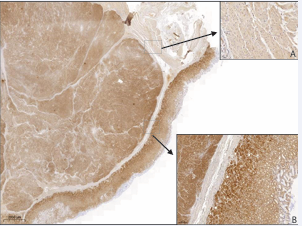
Figure 3: Representative image of DDR2 expression of GIST tumor with adjacent tissue. A: connective tissue with high DDR2 expression. B: GIST tumor (left) and mucosal tissue (right) with high DDR2 expression, connective tissue (middle) with minimal DDR2 expression.
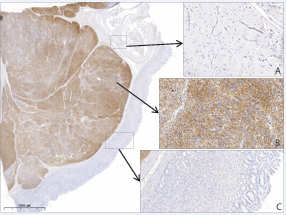
Figure 4: Representative image of PDE3A expression of GIST tumor with adjacent tissue. A: Muscle tissue with minimal PDE3A expression. B: GIST tumor with high PD3A expression. C: Connective tissue (left) and mucosal tissue (right) with minimal PDE3A expression.
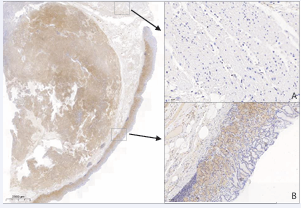
Figure 5: Representative image of PIK3CG expression of GIST tumor with adjacent tissue. A: Muscle tissue with minimal PIK3CG expression. B: Connective tissue (left) with minimal expression and mucosal tissue (right) with moderate expression.
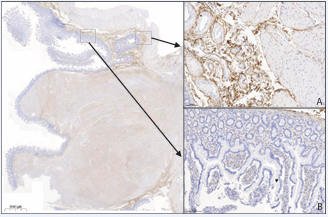
Figure 6: Representative image of TEM1 expression of GIST tumor with adjacent tissue. A: Muscle tissue with minimal PDE3A expression and surrounding connective tissue with high TEM1 expression. B: Mucosal tissue with minimal PDE3A expression.
The TIS score of the adjacent tissue per candidate biomarker and comparison with the TIS of the tumor is shown in (Table 2).
Table 2: Immunohistochemical Tumor Intensity Score (TIS) of different tissue types. Difference be-tween TIS of tumor and TIS of adjacent tissue.
|
Biomarker |
Tissue type |
TIS (SD) |
|
|
CD243 |
Tumor |
7.79 (4.87) |
- |
|
Muscle |
1.0 (0) |
p = 0.001 (Z -3.19) |
|
|
Connective tissue |
1.0 (0) |
p < 0.001 (Z -3.64) |
|
|
Blood vessels |
1.0 (0) |
p = 0.001 (Z -3.19) |
|
|
Mucosa |
1.24 (1.25) |
p < 0.001 (Z -2.64) |
|
|
DDR2 |
Tumor |
13.03 (4.04) |
- |
|
Muscle |
11.41 (4.04) |
p = 0.088 (Z -1.71) |
|
|
Connective tissue |
3.41 (3.85) |
p < 0.001 (Z -3.94) |
|
|
Blood vessels |
9.35 (5.02) |
p = 0.005 (Z -2.81) |
|
|
Mucosa |
15.11 (3.98) |
p = 0.133 (Z -1.50) |
|
|
PDE3A |
Tumor |
14.22 (3.64) |
- |
|
Muscle |
4.0 (3.74) |
p < 0.001 (Z -3.73) |
|
|
Connective tissue |
1.26 (0.86) |
p < 0.001 (Z -4.21) |
|
|
Blood vessels |
5.59 (4.91) |
p < 0.001 (Z -4.11) |
|
|
Mucosa |
3.06 (3.58) |
p < 0.001 (Z -3.63) |
|
|
PIK3CG |
Tumor |
6 (4.02) |
- |
|
Muscle |
1.27 (1.18) |
p = 0.003 (Z -2.96) |
|
|
Connective tissue |
1.43 (1.56) |
p = 0.001 (Z -3.38) |
|
|
Blood vessels |
1.0 (0) |
p < 0.001 (Z -3.55) |
|
|
Mucosa |
5.12 (5.10) |
p = 0.154 (Z -1.43) |
|
|
TEM1 |
Tumor |
4.65 (4.89) |
- |
|
Muscle |
1.0 (0) |
p = 0.017 (Z -2.93) |
|
|
Connective tissue |
10.5 (3.27) |
p < 0.001 (Z -3.75) |
|
|
Blood vessels |
1.0 (0) |
p = 0.005 (Z -2.83) |
|
|
Mucosa |
1.17 (0.71) |
p = 0.018 (Z -2.38) |
Tumor-to-Normal Ratio: The TIS of the tumor divided with the TIS of adjacent tissue resulted in Tumor-to Normal ratios (T/N) (Figure 7). In CD243 it resulted in an T/N of 7.04 (SD 4.89) for muscle, 7.45 (SD 4.72) for connective tissue, 7.45 (SD 4.72) for blood vessels and 7.36 (SD 5.01) for mucosa. In DDR2 the TIS resulted in a T/N of 1.26 (SD 0.5) for muscle, 9.01 (SD 5.93) for connective tissue, 3.18 (SD 4.51) for blood vessels and 0.9 (SD 0.33) for mucosa. In PDE3A resulted in a T/N of 8.34 (SD 6.1) for muscle, 13.26 (SD 4.53) for connective tissue, 5.64 (SD 5.34) for blood vessels and 10.74 (SD 6.27) for mucosa. In PIK3CG the TIS resulted in a T/N of 4.18 (SD 3.73) for muscle, 5.64 (SD 4.27) for connective tissue, 6.0 (SD 4.02) for blood vessels and 3.08 (SD 3.64) for mucosa. Finally, in TEM1 it TIS resulted in a T/N of 4.42 (SD 5.12) for muscle, 0.43 (SD 0.44) for con-nective tissue, 4.65 (SD 4.89) for blood vessels and 3.65 (SD 4.24) for mucosa.
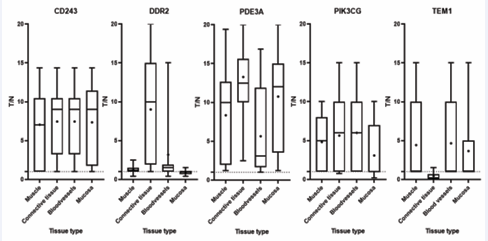
Figure 7: Tumor-to-normal (T/N) ratios of adjacent tissue, categorized per candidate biomarker. The dot represents the mean.
Tumor-to-Normal Ratio Comparison: Figure 8 shows the T/N ratio of the different candidate biomarkers categorized per tissue type. DDR2 had a mean T/N of 1.26 in muscle tissue, which is statistically lower than the highest three biomarkers; CD243 7.04 (p = .002, Z -3.04), PDE3A 8.34 ( p <.001, Z -3.15) and PIK3CG 4.81 (p = .017, z = -2.39). In connective tissue, the T/N ratio of TEM1 was statistically lower than the other the other biomarkers (CD243 p < 0.001, Z -4.12, DDR2 p < 0.001, Z – 4.11, PDE3A p < 0.001, Z – 4.11, PIK3CG p < 0.001, Z – 4.01). The T/N ratio of PDE3A of connective tissue was statistically higher than the other candidate biomarkers (CD243 p = 0.001, Z – 3.17, DDR2 p = 0.011, Z – 2.56, PIK3CG p < 0.001, Z -3.89, TEM1 p < 0.001, Z -4.20). In blood vessels there is a significant difference between the T/N ratio of DDR2 and CD243 (p = 0.019, Z – 2.25) and DDR2 and PIK3CG (p = 0.039, Z – 2.06). In mucosa CD243 and PDE3A had a T/N of 7.36 and 10.74 was statistically significant higher than DDR2 (p = .001, z = -3.24 and p = <.001, z = -3.42), PIK3CG (p = .002, Z -2.38 and p = .001, Z -3.244) and TEM1 (p = .021, Z -2.30 and p = .001, Z -3.29).
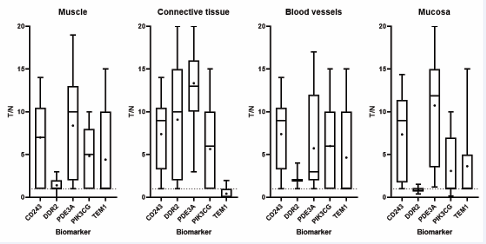
Figure 8: Tumor-to-Normal (T/N) ratios of the five candidate biomarkers, categorized per tissue type. The dot represents the mean.
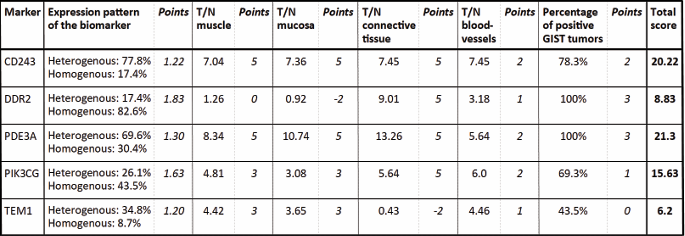
Comparison of Candidate Biomarkers: A target selection scoring system was developed where expression pattern of the biomarker, T/N of muscle, mucosa, connective tissue and blood vessels and percentage of biomarker positive GIST tumors were scored (Table 3). PDE3A and CD243 scored the most favorable with respectively 21.3 and 20.22 points as can be seen in (Table 4). Both candidate biomarkers achieved the maximum points for the T/N ratios. PIK3CG scored intermediate on the T/N ratio of muscle and mucosal tissue, resulting in a total of 15.63 points. Both DDR2 and TEM1 received negative points for one of the T/N ratio’s. DDR2 for the T/N for mucosa and TEM1 for the T/N of connective tissue. In total they received a total of 8.83 and 6.2 points.
Table 3: Scoring system used in this study to assess biomarkers. Tumor-to-normal ratio calculated as (PST *IST )/(PSN *ISN ). Maximum score = 22.
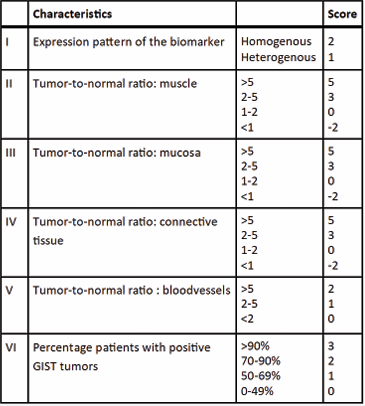
Table 4: Comparison of scores of CD243. DDR2. PDE3A. PIK3CG and TEM1 in GIST. T/N: tumor-to-normal
Sub-Analysis of Neo-Adjuvant Treatment: A large portion of the patients underwent neo-adjuvant therapy with imatinib prior to resection of the tumor (5 out of 23; 21.7%). As mentioned in the introduction, neoadjuvant therapy with imatinib could lead to loss of KIT expression. It was favorable to see if the population that underwent neo-adjuvant treatment showed different expression of the candidate biomarkers than the patients who did not received neo-adjuvant treatment. The sub-analysis showed that the T/N ratio with connective tissue of the candi-date biomarker PDE3A was significantly lower in patients who received neoadjuvant therapy (T/N 4.7) compared to patients who did not receive neoadjuvant treatment (T/N 8.7, p < 0.01, Z – 2.56). Additional-ly, the majority of the tissue types showed decrease in T/N in all biomarkers, with exception of TEM1 which showed increase after neoadjuvant treatment (Appendix 5) (Supplementary Table 4). The analysis was performed on a small group to illustrate a trend and more research is needed to determine the effect of neoadjuvant treatment on biomarker expression.
DISCUSSION
GIST has a high recurrence and metastatic rate. Clean margins during resection and early detection of small metastasis during surgery is essential to lower the chance of recurrence and improve patient outcome. F-IGS has the potential to improve tumor identification and cancer surgery outcomes as it aids in tumor visibility. The majority of GIST tumor express KIT. KIT and DOG1 are currently used in the pathological diagnosis of GISTs. In vivo imaging using anti-KIT antibodies has been demonstrated [11-25]. There is no literature describing the fluorescence imaging using anti-DOG1 antibodies. Moreover, no anti-DOG1 antibody is clinically available. Considering the loss of expression of KIT after neo-adjuvant treatment with imatinib and unavailability of DOG1, identifying new biomarkers with high sensitivity and specificity is imperative.
The results of this study provides additional insights to current literature, as it evaluates the expres-sion of these proteins in GIST tissue compared to normal tissue, and analyzed in tumor-to-normal ratios. All, with the focus on identifying candidate biomarkers for GIST. The found expression of CD243 in 78% of the GIST tumors corresponds with published research, which reported 68%-86% expression of CD243 in GIST [26,27].
This study might be susceptible to some bias due to subjectivity. The level of expertise on the im munohistochemical evaluation of tissue differ between the two observers as one is a pathologist at the LUMC with experience in GIST while the other is not. However, the two observers scored independently from each other, additional to reached consensus when scores differ between the two observers. In addi-tion, the overall kappa agreement score was 0.66. A possible shortcoming could be the relative small sample size of 23 tumors for evaluation of the candidate biomarkers with immunohistochemical research. However, as statistically significant differences were found on multiple results, it can indicate that the sample size was sufficient. Another shortcoming is the lack of direct comparison with KIT and DOG1, by including these tracers in parallel in the same analyses, as expression of these makers in both GIST as normal tissue has been researched.
This study might be susceptible to some bias due to subjectivity. The level of expertise on the im munohistochemical evaluation of tissue differ between the two observers as one is a pathologist at the LUMC with experience in GIST while the other is not. However, the two observers scored independently from each other, additional to reached consensus when scores differ between the two observers. In addi-tion, the overall kappa agreement score was 0.66. A possible shortcoming could be the relative small sample size of 23 tumors for evaluation of the candidate biomarkers with immunohistochemical research. However, as statistically significant differences were found on multiple results, it can indicate that the sample size was sufficient. Another shortcoming is the lack of direct comparison with KIT and DOG1, by including these tracers in parallel in the same analyses, as expression of these makers in both GIST as normal tissue has been researched.
The immunohistochemical scoring evaluated four adjacent tissue types; muscle, connective tissue, blood vessels and mucosa. Fat tissue was deliberately not scored as the GIST tissue was stored Forma-lin-Fixed Paraffin-Embedded blocks and during the process of deparaffinization fat dissolves. The remaining part of the adipocytes could not be distinguished with certainty from the adjacent connective tissue. As fat is highly present in the abdominal cavity, if the biomarker is also expressed on fat tissue it could intervene with the NIRF signal of the tumor and would not be usable. To determine the expression on fat tissue frozen sections should be stained. However, since it is an exploratory study and GIST tissue from the biobank was used, frozen sections were not possible but must be tested in future research.
CONCLUSIONS
To conclude, CD243 has the potential to provide intra operative guidance during GIST surgery, due the presence on human cell lines GIST-T1, GIST882 and GIST48B. Further research is needed to establish expression of CD243 and PDE3A on cells of GIST cell lines.
AUTHOR CONTRIBUTIONS
Conceptualization, C.V., M.A. and J.H.; methodology, C.V., M.A. and P.K.; software, n.a.; validation, C.V., M.A. and P.K.; formal analysis, C.V. and M.A. and G.M.; investigation, C.V. and M.A.; resources, C.V., M.A., A.V. and P.K.; data curation, C.V. and M.A.; writing—original draft preparation, C.V. and M.A.; writing—review and editing, C.V., M.A., G.K., A.V., J.H. and P. K.; visualization, C.V. and M.A.; supervision, G.K., J.H. and P. K.; project administration, C.V., funding acquisition, n.a., All authors have read and agreed to the published version of the manuscript.”
Institutional Review Board Statement
The study was conducted in accordance with the Declaration of Helsinki. It was conducted compliant with the LUMC Boten Wekedelen tumoren (BWD) statutes. All patients have given consent for the LUMC BWD Biobank. The LUMC Biobank BWD was approved by the Institutional Review Board (or Ethics Committee) of Leiden University Medical Centre, Leiden, the Netherlands (reference number: 3.4653/5274/09/FB/jr (IRB approval: BWD005/ SH/sh) on 11-12-2013).
ACKNOWLEDGMENTS
The authors would like to thank G. Dekker, D. Almandawi, R. van Vlierberghe, Dr. F. Graadt van Roggen, and Prof. dr. J.V.M.G Bovée for their valuable contributions, expertise, and support throughout this study.
Funding: This research received no external funding.
Conflicts of Interest: The authors declare no conflict of interest.
REFERENCES
- Gupta P, Tewari M, Shukla HS. Gastrointestinal stromal tumor. Surg Oncol. 2008; 17: 129-138.
- Pidhorecky I, Cheney RT, Kraybill WG, Gibbs JF. Gastrointestinal stromal tumors: current diagnosis, biologic behavior, and management. Ann Surg Oncol. 2000; 7: 705-712.
- Nishida T, Blay JY, Hirota S, Kitagawa Y, Kang YK. The standard diagnosis, treatment, and follow-up of gastrointestinal stromal tumors based on guidelines. Gastric Cancer. 2016; 19: 3-14.
- Joensuu H, Hohenberger P, Corless CL. Gastrointestinal stromal tumour. Lancet. 2013; 382: 973-983.
- Guerin A, Sasane M, Gauthier G, Keir CH, Zhdavana M, Wu EQ. The economic burden of gastrointestinal stromal tumor (GIST) recurrence in patients who have received adjuvant imatinib therapy. J Med Econ. 2015; 18: 241-248.
- DeMatteo RP, Lewis JJ, Leung D, Mudan SS, Woodruff JM, Brennan MF. Two hundred gastrointestinal stromal tumors: recurrence patterns and prognostic factors for survival. Ann Surg. 2000; 231: 51-58.
- Society A.C. Survival Rates for Gastrointestinal Stromal Tumors.
- Vahrmeijer AL, Hutteman M, van der Vorst JR, van de Velde CJ, Frangioni JV. Image-guided cancer surgery using near-infrared fluorescence. Nat Rev Clin Oncol. 2013; 10: 507-518.
- Hernot S, van Manen L, Debie P, Mieog JSD, Vahrmeijer AL. Latest developments in molecular tracers for fluorescence image-guided cancer surgery. Lancet Oncol. 2019; 20: e354-e367.
- Metildi CA, Tang CM, Kaushal S, Leonard SY, Magistri P, Tran Cao HS, et al. In vivo fluorescence imaging of gastrointestinal stromal tumors using fluorophore-conjugated anti-KIT antibody. Ann Surg Oncol. 2013; 20: S693-700.
- Charville GW, Longacre TA. Surgical Pathology of Gastrointestinal Stromal Tumors: Practical Implications of Morphologic and Molecular Heterogeneity for Precision Medicine. Adv Anat Pathol. 2017; 24: 336-353.
- Liu Y, Li Z, Xu Z, Jin X, Gong Y, Xia X, et al. Proteomic Maps of Human Gastrointestinal Stromal Tumor Subgroups. Mol Cell Proteomics. 2019; 18: 923-935.
- Nakai E, Park K, Yawata T, Chihara T, Kumazawa A, Nakabayashi H, et al. Enhanced MDR1 expression and chemoresistance of cancer stem cells derived from glioblastoma. Cancer Invest. 2009; 27: 901-908.
- Wang M, Mao C, Wang H, Ling X, Wu Z, Li Z, et al. Molecular Imaging of P-glycoprotein in Chemoresistant Tumors Using a Dual-Modality PET/Fluorescence Probe. Mol Pharm. 2017; 14: 3391-3398.
- Motegi A, Sakurai S, Nakayama H, Sano T, Oyama T, Nakajima T. PKC theta, a novel immunohistochemical marker for gastrointestinal stromal tumors (GIST), especially useful for identifying KIT-negative tumors. Pathol Int. 2005; 55: 106-112.
- Duensing A, Joseph NE, Medeiros F, Smith F, Hornick JL, Heinrich MC, et al. Protein Kinase C theta (PKCtheta) expression and constitutive activation in gastrointestinal stromal tumors (GISTs). Cancer Res. 2004; 64: 5127-5131.
- Rouleau C, Curiel M, Weber W, Smale R, Kurtzberg L, Mascarello J, et al. Endosialin protein expression and therapeutic target potential in human solid tumors: sarcoma versus carcinoma. Clin Cancer Res. 2008; 14: 7223-7236.
- Borah S, Vasudevan D, Swain RK. C-type lectin family XIV members and angiogenesis. Oncol Lett. 2019; 18: 3954-3962.
- Rijs Z, Shifai AN, Bosma SE, Kuppen PJK, Vahrmeijer AL, Keereweer S, et al. Candidate Biomarkers for Specific Intraoperative Near-Infrared Imaging of Soft Tissue Sarcomas: A Systematic Review. Cancers (Basel). 2021; 13: 557.
- Azevedo MF, Faucz FR, Bimpaki E, Horvath A, Levy I, de Alexandre RB, et al. Clinical and molecular genetics of the phosphodiesterases (PDEs). Endocr Rev. 2014; 35: 195-233.
- Vandenberghe P, Hagué P, Hockman SC, Manganiello VC, Demetter P, Erneux C, et al. Phosphodiesterase 3A: a new player in development of interstitial cells of Cajal and a prospective target in gastrointestinal stromal tumors (GIST). Oncotarget. 2017; 8: 41026-41043.
- Pulkka OP, Gebreyohannes YK, Wozniak A, Mpindi JP, Tynninen O, Icay K, et al. Anagrelide for Gastrointestinal Stromal Tumor. Clin Cancer Res. 2019; 25: 1676-1687.
- Shrivastava A, Radziejewski C, Campbell E, Kovac L, McGlynn M, Ryan TE, et al. An orphan receptor tyrosine kinase family whose members serve as nonintegrin collagen receptors. Mol Cell. 1997; 1: 25-34.
- Day E, Waters B, Spiegel K, Alnadaf T, Manley PW, Buchdunger E, et al. Inhibition of collagen-induced discoidin domain receptor 1 and 2 activation by imatinib, nilotinib and dasatinib. Eur J Pharmacol. 2008; 599: 44-53.
- Fujimoto S, Muguruma N, Okamoto K, Kurihara T, Sato Y, Miyamoto Y, et al. A Novel Theranostic Combination of Near-infrared Fluorescence Imaging and Laser Irradiation Targeting c-KIT for Gastrointestinal Stromal Tumors. Theranostics. 2018; 8: 2313-2328.
- Plaat BE, Hollema H, Molenaar WM, Torn Broers GH, Pijpe J, Mastik MF, et al. Soft tissue leiomyosarcomas and malignant gastrointestinal stromal tumors: differences in clinical outcome and expression of multidrug resistance proteins. J Clin Oncol. 2000; 18: 3211-3220.
- Théou N, Gil S, Devocelle A, Julié C, Lavergne-Slove A, Beauchet A, et al. Multidrug resistance proteins in gastrointestinal stromal tumors: site-dependent expression and initial response to imatinib. Clin Cancer Res. 2005; 11: 7593-7598.
- van Oosten M, Crane LM, Bart J, van Leeuwen FW, van Dam GM. Selecting Potential Targetable Biomarkers for Imaging Purposes in Colorectal Cancer Using Target Selection Criteria (TASC): A Novel Target Identification Tool. Transl Oncol. 2011; 4: 71-82.