Validation of a Dynamic T2 Preparation Pulse for Assessing Blood Oxygenation in a Clinical Setting
- 1. Department of Cardiology, University Hospital Duesseldorf, Germany
- 2. Linköping University, Sweden
- 3. UT Southwestern, USA
- 4. King’s College London, Division of Imaging Sciences, UK
Abstract
Purpose: Here, we used dynamic T2 preparation pulse in weighted subtraction magnetic resonance imaging (MRI) among adult patients with coronary artery disease (CAD) and children with congenital heart disease (CHD) to develop a new imaging method to non-invasively evaluate blood oxygenation, improve vascular imaging and provide additional functional information about CHD.
Methods: Thirty-one patients (mean age 75, range ±10 years) with CAD and 11 children (mean age 3, range ± 6.4 years) with CHD were enrolled.
Results: In images acquired with a T2 preparation pulse, the signal-to-noise ratio (SNR) of the right atrium and oxygen saturation were well correlated (r=0.674, p<0.0326). The contrast-to-noise ratio (CNR) of the pulmonary artery was comparable to invasive blood oxygenation measurements with a subtraction factor of 1.5 (indicated as B-1.5A, p<0.08). The SNR of the pulmonary artery was comparable to invasive blood oxygenation measurements with a subtraction factor of 1.8 (indicated as B-1.8A, p<0.03). The CNR of the ascending aorta was comparable to invasive blood oxygenation measurements with a subtraction factor of B-1.8A (p<0.05).
Conclusion: Dynamic T2 MRI is a feasible, competitive non-invasive imaging method to detect oxygenation levels without the use of a contrast agent in the clinical setting.
Keywords
• T2 preparation pulse
• Weighted subtraction
• Signal-to-noise ratio
• Contrast-to-noise ratio
• Blood oxygenation
CITATION
Elkenhans B, Henningsson M, Hussain TM, Botnar R, Greil G. Validation of a Dynamic T2 Preparation Pulse for Assessing Blood Oxygenation in a Clinical Setting. J Cardiol Clin Res. 2023; 11(2): 1191.
INTRODUCTION
Children with congenital heart disease (CHD) and adults with coronary artery disease (CAD) are affected by severe symptoms of heart failure, including dyspnoea and cyanosis, which hinder everyday life. These patients are frequently affected by enlarged collateral vessels between the aorta and pulmonary arteries, and this re-circulation of blood can cause cardiac strain and ischaemia; therefore, occlusion of the collateral vessels may be required to restore cardiac perfusion. Currently, to assess the need for treatment as well as the oxygen saturation in different main vessels and the heart, state-of-the-art coronary angiography and right heart catheterization are needed. However, these methods are accompanied by the risk of bleeding complications and exposure to radiation [1]. Thus, establishing a non-invasive imaging method to assess blood oxygenation would be valuable for making treatment decisions for children with CHD and adults with CAD.
Among the possible alternative imaging methods, cardiac MRI has some excellent advantages: no need for radiation, no bleeding risk and no potential harmful effects. Blood oxygenation level-dependent (BOLD) imaging is still state of the art, but its efficacy largely depends on the strength of the magnetic field. While the overall susceptibility to field homogeneity at higher field strengths may cause artefacts, it also leads to a higher sensitivity to changes induced by paramagnetic effects [2]. This has been illustrated by a study by Dharmakumar et al., in which the sensitivity for detecting changes in myocardial oxygenation could increase by a factor of approximately 2.5 when moving from 1.5T to 3T [3].
Other MRI methods have been investigated for their ability to detect blood oxygenation levels. Simonetti et al used T2 mapping to visualize different blood oxygenation levels via cardiac MRI [4]. Whether this method is flow independent is not yet clear. Recently, quantitative susceptibility mapping (QSM) has also demonstrated amazing results in high field strength but has not yet been used clinically [5-7]. The ability of a dynamic T2 preparation pulse to distinguish between deoxygenated and oxygenated blood was previously investigated in phantom scan studies and compared with blood gas analysis and in healthy volunteers with good results (data not shown yet).
To address this, we aimed to use a dynamic T2 preparation pulse, a flow-independent method with sufficient signal and adequate signal-to noise and contrast-to-noise differences [8], with weighted subtraction MRI in children with CHD and adults with CAD in a clinical setting to evaluate blood oxygenation in comparison to a conventional invasive measurement of oxygenation. Briefly, MRI with and without a T2 preparation was performed, and weighted subtraction of the images without T2 preparation from images with T2 preparation was performed. Then, we subtracted the images using subtraction factors of 1.5 or 1.8 (indicated as B-1.5A or B-1.8A) and measured the signal-to noise ratio (SNR) and contrast-to-noise ratio (CNR) [9]. This non invasive imaging technique could provide indicators of cardiac ischaemia that inform treatment and/or surgical decisions.
Both methods are described in the methods section. We compared the acquired images with oxygenation levels obtained by invasive heart catheterization.
Here, we scanned tubes of blood treated with extracorporeal membrane oxygenation (ECMO) with different blood oxygenation levels. We compared the acquired T2 images of the saturated oxygenation tubes with a standard blood analysis system. The acquired images showed good correlation with the standard blood analysis system. Afterwards, healthy volunteers were investigated with the dynamic T2 preparation pulse, and here, a good correlation with oxygen saturation was detected.
METHODS
Study population
Eleven children with CHD and 31 adult patients with known CAD were prospectively recruited. Patients were referred for assessment of CAD treatment between December 2012 and July 2013 at the University Hospital of Duesseldorf, Germany.
Approval from the Institutional Review Board (IRB) at XXX was obtained prior to commencement of recruitment, and patients or their guardians provided written informed consent.
Coronary angiography and right heart catheterization
Coronary angiography and right heart catheterization were performed in all patients [1] with invasive measurements of oxygen saturation in the ascending aorta, left ventricle, pulmonary artery, right atrium and right ventricle.
Cardiac MRI protocol
Patients were scanned on a 1.5-Tesla scanner (Achieva, Philips Healthcare, Best, the Netherlands) with a 32-channel, five-element sensitivity encoding (SENSE) cardiac receiver coil. An initial survey and reference scan were obtained adjacent to the position of the imaging area to yield coil sensitivity maps.
After this survey, either the end-systolic or end-diastolic cardiac rest period was identified using a high temporal resolution, balanced-SSFP, two-dimensional cine MRI sequence in a four chamber view orientation (repetition time = 4.7 ms, echo time = 2.3 ms, flip angle = 70°, slice thickness = 10 mm, field of view [FOV] = 400 mm). Either the mid-systolic or the mid-diastolic rest period was detected from the cine images and used to define the trigger delay and acquisition window for the dynamic T2 images.
Next, an electrocardiogram (ECG)-triggered and navigator gated dynamic T2-prepared, three-dimensional SSFP gradient echo sequence was applied. Multislice, multiphase cine imaging was performed using a standard SSFP pulse sequence in the short axis (slice thickness, 8 mm; gap, 0 mm; 76 phases; FOV, 350 × 370 × 96 mm) covering the entirety of the left and right ventricles. Three-dimensional gradient echo with a dynamic T2 preparation pulse was acquired (voxel size, 1.3 × 1.3 × 4; flip angle, 30°; TE, 1.4 ms; TR, 4.5 ms; 40 slices). Late gadolinium enhancement (LGE) imaging (10-12 short axis slices, 10 mm slice thickness, 250 × 180 mm matrix) was performed following a Look-Locker sequence (inversion time scout) 10 minutes after an administration of contrast agent (0.2 mmol/l Dotarem, Guerbet, Villepinte). The images were analysed on the scanner workstation to quantify left and right ventricular volumes, myocardial mass, and LGE areas.
A diaphragmatic one-dimensional respiratory navigator [17, 18] was used with a seven-mm window, and data were accepted only when both consecutive T2 prep acquisitions (on vs. off) were within the window. The T2 preparation prepulse [19] had a duration of 80 ms and consisted of two non-selective, adiabatic, 180° refocusing pulses [9].
Cardiac MRI analysis
Endocardial and epicardial borders were manually contoured at end-diastole and end-systole to allow the calculation of ventricular volumes and mass (epicardial volume – endocardial volume × myocardial density [1.05 g/cm3]), and the values were indexed for body surface area. LGE areas were measured and indexed for normal myocardium on the scanner workstation (EWS, release 3.2.2, Philips). Images were obtained by subtracting the images acquired with T2 prep from those without T2 prep. A subtraction factor of 1.8 was used for the images with T2 prep to obtain consistent blood signal subtraction (indicated as B-1.8A). Osirix software (version 5.9, Geneva, Switzerland) was used to measure signal intensity using the formula (meanmyocardium – meanair )/airStDev. [9].
All cardiac chambers and great vessels were quantitatively analysed for CNR and SNR using Osirix software. Regions of interest (ROIs) were defined to determine the signal (S) from blood (SBlood ) in the left ventricle (LV), right ventricle (RV), pulmonary artery (PA), ascending and descending aorta (Ao), and pulmonary veins (PV) relative to the reference tissue (SMyocardium ). Noise (N) was estimated according to the standard deviation of these respective ROIs. CNR was defined by using the following equation: CNR = (SBlood -SMyocardium )/(0.5 × [NBlood +NMyocardium ]), where all variables are mean values. SNR was defined using the equation SNR = (SBlood )/(NBlood ) [9]. Image processing and reformatting were performed with commercially available analysis software (View Forum; Philips Healthcare).The image gradient system was modified based on McConnell et al [20] (Figure 2). Consensus reading was performed for image quality scoring by two readers using the image quality scores defined in Table 2. The readers analysed all images independently in a blinded and random order. Disagreements were discussed before a single final grade was given. Visual inspection was performed to identify the intracardiac and extracardiac arterial and venous structures [21] (Figures 1, 2 and 3).
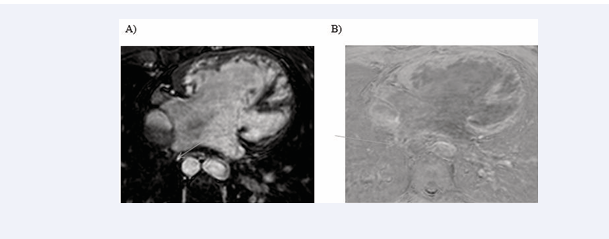
Figure 1: Identification of intracardiac and extracardiac arterial and venous structure
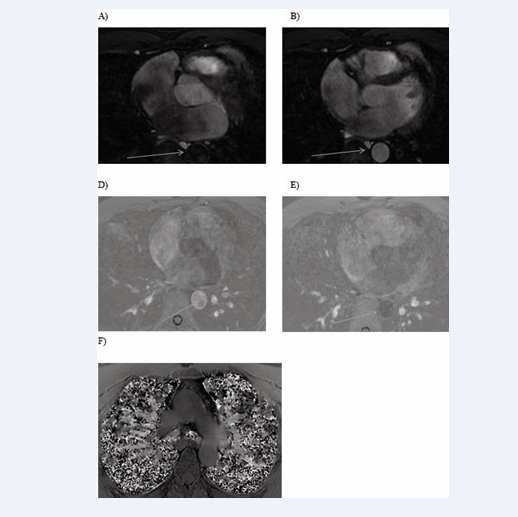
Figure 2: Identification of intracardiac and extracardiac arterial and venous structures
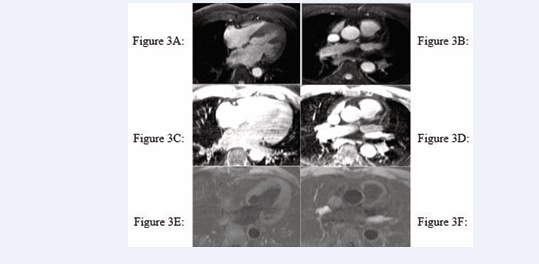
Figure 3: Identification of intracardiac and extracardiac arterial and venous structures
Statistical analysis
Signal-to-noise and contrast-to-noise results were compared with invasive measurements obtained through coronary angiography and right heart catheterization. A p-value less than 0.05 was treated as statistically significant. IBM SPSS Statistics 2017 was used to perform the analyses, and ANOVA was used to correlate invasive measurements of oxygen saturation with the SNR and CNR of the acquired MR images.
RESULTS
Study population
Thirty-one patients were enrolled in the study (Table 1).
SNR and CNR analyses
The SNR in the right atrium was positively correlated with oxygen saturation (r=0.674, p<0.0326) (Figure 4)
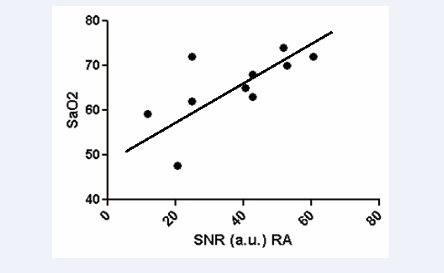
Figure 4: Correlation of SNR in dynamic T2 preparation pulse with invasive measurement of oxygenation saturation
in images acquired with a T2 preparation pulse. Furthermore, we observed a tendency for pulmonary artery CNR to be correlated with invasive measurements of oxygen saturation (p<0.08) (Figure 5 (B-1.5A)).
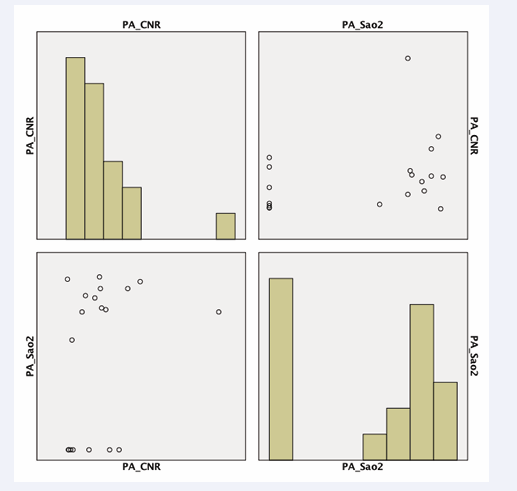
Figure 5: Correlation of CNR of the pulmonary artery in weighted subtraction (B-1,5A) and oxygen saturation via invasive measurement (p<0,08).
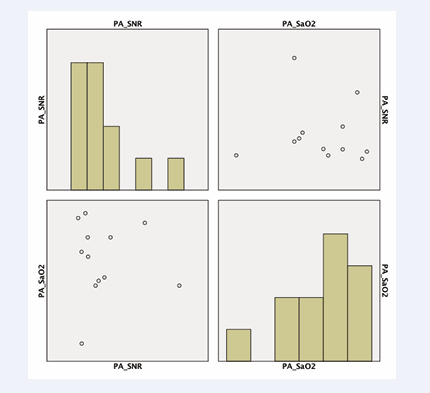
Figure 6: SNR of the pulmonary artery compared to invasive blood oxygenation measurements in weighted subtraction (B-1,5A)(p<0,03).
The SNR of the pulmonary artery was compared to invasive blood oxygenation measurements with a subtraction factor of B-1.8A (p<0.03) (Figure 6). The CNR of the ascending aorta was compared to invasive blood oxygenation measurements with a subtraction factor of B-1.8A (p<0.05) (Figure 7).
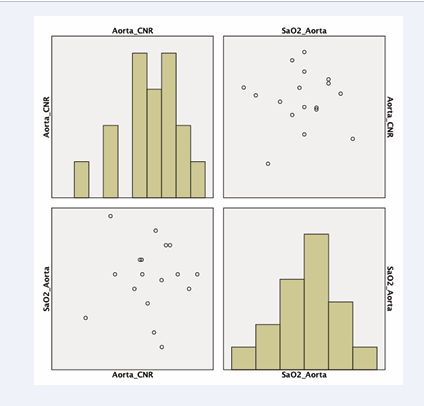
Figure 7: CNR of the ascending aorta compared to invasive blood oxygenation measurements in weighted subtraction (B-1,5A)(p<0,05).
DISCUSSION
In this study, blood oxygenation levels in children with CHD and adults with CAD were assessed using a conventional, invasive approach and a non-invasive MRI technique with a dynamic T2 preparation pulse and weighted subtraction. Our aim was to develop a competitive flow-independent imaging method for daily clinical use. This technique was previously evaluated by comparing phantom scans to a conventional blood oxygenation analysis with different oxygenation levels and imaging from healthy volunteers.
Rodriguez-Soto et al., also used balanced steady-state free precession (bSSFP) with a T2 preparation pulse to quantify whole-blood oxygenation at a field strength of 1.5T [10.]
In this study, we found that the right atrium SNR was significantly correlated with invasive measurements of oxygenation, the SNR of the pulmonary artery and the CNR of the ascending aorta. These results demonstrated that assessing blood oxygenation is feasible using a dynamic T2 preparation pulse in cardiac MRI as a competitive sequence to classic BOLD imaging, T2 mapping and QSM.
Signal intensity-based methods, such as T2 mapping, have been introduced by Simonetti et al. [4], demonstrated a valuable addition to estimate O2 saturation. Here, four T2 maps were acquired for arterial and venous blood and compared with oxygen saturation.
Here, we could have overlooked the discussion of flow dependency during blood pool acquisition and blood pool dependency during systole and diastole.
QSM is a recently developed MRI technique for quantifying the spatial distribution of magnetic susceptibility within biological tissue. Notably, it provides an improved CNR for certain tissues. QSM has been used mainly to image the brain, iron and myelin, although it has not been used in cardiac imaging.
Gradient-recalled echo phase images can provide better contrast between grey and white matter [11].
However, this type of imaging is still not for clinical use because it can be used only at high field strength.
BOLD is still considered state-of-the-art of imaging of blood oxygenation via MRI. Previously, Manka et al. [12], performed T2* BOLD cardiac magnetic resonance (CMR) at 3T in 46 patients with known or suspected CAD. However, the image quality was not consistent and was graded as moderate or poor in approximately 25% of patients. In additional, BOLD was used to assess suspected CAD in comparison to first-pass perfusion [16]. Nevertheless, the BOLD approach is still limited by the contrast-to-noise ratio. To overcome these problems with image quality, several in-human studies have used T2-prepared SSFP sequences at 1.5T and 3T [13-15]. Here, CMR was able to detect microvascular changes.
Our work produced stable results in a clinical setting in patients with CHD and with CAD. The applied sequence was validated before clinical use in a phantom scan compared to different oxygenation states and in healthy volunteers. Our method is easy to use and is not time consuming in routine clinical practice.
Our work is limited by a limited accuracy in measuring signal to-noise and contrast-to-noise ratios. Further work needs to be performed to increase the signal intensity.
DECLARATIONS
Funding
This work was not supported by funding sources; it was a subclinical study.
Availability of data and material: Transparency is given for the data in this study.
Code availability: Software application
Ethics approval: This study was performed in line with the principles of the Declaration of Helsinki. Approval was granted by the Ethics Committee of the University of Duesseldorf and King’s College London.
Consent to participate: Informed consent was obtained from all individual participants included in the study.
Consent for publication: The patients provided signed informed consent regarding publication of their data.


