Association between C-Reactive Protein-Triglyceride Glucose Index and Diabetic Nephropathy, with the Mediating Role of Oxidative Stress: A Cross-Sectional Study Based on the NHANES Database
- *. Both the authors contributed equally
- 1. Department of Clinical Laboratory, The First Affiliated Hospital of Zhejiang Chinese Medical University, China
- 2. The Third Sanatorium Department, Air Force Special Service Sanatorium, China
- 3. Medical Affairs Department, The First Affiliated Hospital of Zhejiang Chinese Medical University, China
- 4. Department of party and government comprehensive office, The First Affiliated Hospital of Zhejiang Chinese Medical University, China
Abstract
Background: Diabetic nephropathy (DN) is a severe microvascular complication of diabetes and a leading cause of end-stage renal disease. Inflammation, insulin resistance, and oxidative stress are key drivers of DN progression. The C-reactive protein-triglyceride-glucose index (CTI), which integrates inflammatory and metabolic signals, has shown prognostic value in multiple diseases, but its association with DN remains unclear. We aimed to explore the relationship between CTI and DN and the mediating role of oxidative stress.
Methods: Based on 7 cycles (2001-2010, 2015-2018) of NHANES, 2213 diabetic patients were included after excluding those with missing key data. Weighted logistic regression, restricted cubic spline, subgroup analysis, and Bootstrap mediation analysis were employed to evaluate the association between CTI and DN, non-linear relationships, stability, and the mediating effects of gamma-glutamyl transferase (GGT) and uric acid (UA).
Results: The DN prevalence was 43.11% in diabetes. CTI was independently and non-linearly associated with DN (OR = 1.49, P < 0.001), with a stronger association in the highest quartile (OR = 2.74, P < 0.001). Subgroup analysis confirmed stable associations across most populations. GGT and UA partially mediated the association, with mediation proportions of 6.95% and 9.70%, respectively.
Conclusion: CTI is significantly associated with increased DN risk in diabetic patients, with oxidative stress partially mediating this relationship. As an accessible composite biomarker, CTI may serve as a practical tool for DN risk stratification, underscoring the clinical importance of targeting inflammation, metabolic dysfunction, and oxidative stress in the prevention of DN.
Keywords
• Diabetic nephropathy
• CTI
• Inflammation
• Metabolize
• Oxidative stress
Citation
Wang Y, Zou L, Chen S, He Y, Wu Y, et al. (2026) Association between C-Reactive Protein-Triglyceride-Glucose Index and Diabetic Nephropa thy, with the Mediating Role of Oxidative Stress: A Cross-Sectional Study Based on the NHANES Database. J Clin Nephrol Res 13(1): 1127.
ABBREVIATIONS
DN: Diabetic Nephropathy; DM: Diabetes Mellitus; ESRD: End-Stage Renal Disease; eGFR: Estimated Glomerular Filtration Rate; CRP: C-Reactive Protein; IR: Insulin Resistance; TyG: Triglyceride-Glucose Index; CTI: C-Reactive Protein-Triglyceride-Glucose Index; OS: Oxidative Stress; ROS: Reactive Oxygen Species; NHANES: National Health And Nutrition Examination Survey; FPG: Fasting Plasma Glucose; UACR: Urinary Albumin-to Creatinine Ratio; TG: Triglycerides; GGT: Gamma-Glutamyl Transferase; UA: Uric Acid; PIR: Poverty-to-Income Ratio; OR: Odds Ratio; CI: Confidence Interval; RCS: Restricted Cubic Spline; PKC: Protein Kinase C
INTRODUCTION
Diabetic nephropathy (DN), one of the most severe microvascular complications of diabetes mellitus (DM), is characterized by progressive deterioration of renal function and serves as the leading cause of end-stage renal disease (ESRD) [1]. With the continuous rise in the incidence of diabetes worldwide, the disease burden of DN has become increasingly heavy [2]. According to statistics from the International Diabetes Federation (IDF), approximately 30%-40% of diabetic patients will progress to DN, which seriously threatens patients’ health and quality of life [3]. Currently, the clinical diagnosis of DN is based on persistent albuminuria and/or a decline in estimated glomerular filtration rate (eGFR) [4]. However, effective early prediction and intervention methods are still lacking. Therefore, exploring biomarkers that can accurately assess the risk of DN and revealing their potential mechanisms of action are of great clinical and public health significance for improving patient prognosis.
In recent years, in-depth research on the pathogenesis and prevention strategies of DN has revealed that its pathological process involves complex interactions of multiple factors. A growing body of evidence suggests that inflammation and insulin resistance play significant roles in the development and progression of the disease. C-reactive protein (CRP), a classic acute-phase reactant, can increase up to 1000-fold at sites of infection or inflammation [5]. Studies have shown that elevated serum CRP levels are closely associated with increased microalbuminuria and renal dysfunction, suggesting a strong link between CRP and the development of DN [6,7]. Another study confirmed that under diabetic conditions, high glucose levels can induce CRP expression, and elevated CRP levels may promote the infiltration of inflammatory cells, leading to the release of cytokines, chemokines, and transforming growth factor-β1 (TGF-β1), thereby accelerating renal inflammation and fibrosis [8]. Additionally, metabolic disorders, especially insulin resistance (IR) and impaired insulin signaling function, are also key factors contributing to renal function damage [9]. IR is defined as a decrease in cellular sensitivity to insulin, resulting in reduced effectiveness of insulin in promoting glucose uptake and utilization [10]. It can drive DN progression through multiple biological mechanisms, including exacerbating renal hemodynamic disorders, impairing podocyte function, inhibiting normal tubular function, and promoting glomerular hypertrophy and tubulointerstitial fibrosis [11]. To accurately assess and manage insulin resistance in diabetic patients, researchers have developed a series of non-insulin-based insulin resistance indices, among which the triglyceride glucose index (TyG) is a reliable and relatively easily accessible indicator for evaluating IR [10]. A large cohort study showed that the TyG index is significantly associated with the risk of advanced kidney disease and serves as an important intermediate factor mediating obesity and diabetic nephropathy [12]. Inflammatory factors can weaken insulin signaling through downstream effects [13], while IR can increase oxidative stress (OS) and amplify inflammatory responses [14,15]. Inflammation and IR form a vicious cycle, ultimately driving disease progression [16].
OS is closely related to inflammation and glucose-lipid metabolism. Inflammation and OS have been identified as key drivers of the persistent progression of DN [17]. There is a mutually reinforcing relationship between OS and inflammation: OS can activate pro-inflammatory cytokines and trigger inflammation, while inflammation further promotes the production of reactive oxygen species (ROS), thereby exacerbating cellular and tissue damage [18]. Additionally, studies have shown that abnormal glucose lipid metabolism can increase OS levels [19]. In the diabetic state, elevated plasma free fatty acids and increased renal uptake of fatty acids can induce fatty acid ω-oxidation and peroxisomal β-oxidation, the latter of which can promote lipid and ROS accumulation in the diabetic kidney [20].
The C-reactive protein-triglyceride-glucose index (CTI) is constructed based on CRP and the TyG index, reflecting both inflammatory and IR states. It is an easily accessible, economical, and rapid biochemical detection index. Previous studies have shown that CTI can significantly stratify the risk of various diseases, such as depression and cardiovascular diseases [16-22]. However, the correlation between CTI and DN has not been thoroughly explored. This study aims to comprehensively investigate the association between CTI and DN and analyze the mediating role of OS based on data from the National Health and Nutrition Examination Survey (NHANES), a nationally representative database in the United States.
METHODS
Study Population
NHANES is a comprehensive cross-sectional study initiated and conducted by the National Center for Health Statistics (NCHS) to collect data on the health and nutritional status of adults and children in the United States. The study adopts a complex, stratified, multi-stage probability sampling design, recruiting a demographically representative sample of the U.S. population each year, with all participants providing informed consent. Detailed study design and data of NHANES can be accessed through the official website (https://wwwn.cdc.gov/nchs/nhanes/ default.aspx). Due to the missing CRP data in the 2011 2012 and 2013-2014 cycles, this study included 14 years of survey data from 7 cycles (2001-2010 and 2015-2018), initially recruiting 71,420 participants. Participants were excluded based on the following criteria: (1) age < 18 years (n=29,641); (2) non-diabetic patients (n=36,797); (3) incomplete laboratory data related to CTI (n=2,447); (4) incomplete OS indicator data (n=6); (5) missing covariate data (n=316). Finally, 2,213 participants were included for comprehensive statistical analysis (Figure 1).

Figure 1 Flowchart of participant selection.
Outcome Variable
The definition of DM in this study adopted the following criteria: (1) definite diagnosis by a healthcare professional; (2) fasting plasma glucose (FPG) ≥ 126 mg/ dl; (3) glycated hemoglobin (HbA1c) ≥ 6.5%; (4) currently receiving antidiabetic drugs or insulin therapy. For renal function assessment, two core indicators were selected: urinary albumin-to-creatinine ratio (UACR) and eGFR. The eGFR was calculated using the formula recommended by the Chronic Kidney Disease Epidemiology Collaboration (CKD-EPI). DN was diagnosed if either of the following conditions was met: UACR ≥ 30 mg/g or eGFR < 60 mL/ min/1.73 m².
Exposure Variable
CTI was calculated based on blood biochemical test data, including CRP, triglycerides (TG), and FPG, where TG and FPG were used to reflect insulin response status. All biochemical samples were collected in the early morning after participants fasted for 8 hours and sent to NCHS certified laboratories for testing. CRP was measured by latex-enhanced immunoturbidimetry on a Behring Nephelometer, TG by enzymatic method on a Roche Cobas 6000 chemical analyzer, and FPG by oxygen rate method on a Beckman DxC800. The formula for calculating CTI was as follows: CTI = 0.412 × Ln (CRP) (mg/dL) + Ln ([triglycerides (mg/dL) × fasting plasma glucose (mg/ dL)] / 2), with all variables in mg/dL. CTI was treated as a continuous variable in the preliminary analysis and later divided into quartiles for further analysis.
Mediator Variables
Through literature review, gamma-glutamyl transferase (GGT) and uric acid (UA) were selected as markers for evaluating OS and designated as mediator variables. Both were directly determined based on biochemical results: GGT was measured by the rate method on a Roche Cobas 6000 chemical analyzer, and UA by the uricase colorimetric method on a Beckman DxC800, with units of U/L and mg/ dL, respectively. Detailed laboratory methods can be found on the NHANES official website.
Covariates
To clarify the independent association between CTI and DN, this study constructed a multivariable adjusted model to control for the influence of confounding factors. Included covariates were gender, age, race, educational level, marital status, family economic status, smoking behavior, and medical history of a series of important chronic diseases, including hypertension and heart disease. Race was categorized into Mexican American, Non Hispanic White, Non-Hispanic Black, Other Hispanic, and Other. Educational level was divided into three categories based on the number of years of education completed: less than 9th grade, 9-12th grade, and more than 12th grade. Marital status was simplified into two categories: married or cohabiting, and living alone, to explore the role of family structure factors. Family economic status was divided into three categories based on the poverty-to-income ratio (PIR) officially defined by the U.S. government: low (PIR ≤ 1.3), medium (1.3 < PIR ≤ 3.5), and high (PIR > 3.5). Smoking status was defined based on whether participants had smoked ≥ 100 cigarettes in their lifetime and whether they were current smokers. For hypertension, participants were asked if they had ever been told by a healthcare professional that they had hypertension or were currently taking antihypertensive medications, and judgment was also made based on the average of collected systolic and diastolic blood pressure. Heart disease included heart failure, coronary heart disease, angina pectoris, myocardial infarction, etc., which were determined based on participants’ self-reported medical history.
Statistical Analysis
All data were analyzed using appropriate weights to ensure national representativeness of the results for the U.S. population. The “survey” package in R software was used for weighted analysis of NHANES data. Descriptive statistics were used to compare the overall characteristics of the population between the DN group and the non-DN group: continuous variables were expressed as “mean ± standard deviation”, and intergroup differences were analyzed using weighted linear regression; categorical variables were described as “frequency (percentage)”, and intergroup differences were compared using a weighted chi-square test. Weighted logistic regression analysis was performed to determine the independent association between CTI and DN. The corresponding results were expressed as odds ratio (OR) and 95% confidence interval (95% CI), and three regression models were constructed: Model 1 was unadjusted for any confounding factors; Model 2 adjusted for age, gender, and race; Model 3 further adjusted for educational level, marital status, PIR, smoking status, hypertension, and heart disease. Also, the continuous variable CTI was converted into quartiles, and the correlation trend between CTI quartiles and DN was verified by weighted multivariable logistic regression. A restricted cubic spline (RCS) model was further applied to intuitively visualize the non-linear association between CTI and DN. In addition, to explore the impact of CTI on DN in different contexts, stratified subgroup analyses were performed by age, gender, race, educational level, marital status, PIR, smoking status, hypertension, and heart disease, and interaction p-values were calculated to evaluate the stability of the association between CTI and DN. Finally, a Bootstrap-based mediation model was used to study the direct effect of CTI on DN risk and the indirect effects mediated by GGT and UA. All statistical analyses were performed using R software (version 4.3.0), and a p-value < 0.05 was considered statistically significant.
RESULTS
Participant Characteristics According to the Outcome Variable
A total of 2,213 participants were enrolled in this study, among whom 954 were diagnosed with DN (43.11%). The average age of the eligible participants was 61.61 ± 13.88 years, including 1,177 males (53.2%) and 1,036 females (46.8%). Compared with the non-DN group, the DN group had a higher proportion of participants with educational level less than 9th grade, living alone, low income, and comorbid hypertension and cardiovascular diseases (P < 0.05); additionally, the DN group exhibited significantly higher age and levels of CRP, TyG, CTI, GGT, and UA in the DN group were significantly higher than those in the non DN group (P < 0.05). The baseline characteristics of the study population are shown in Table 1.
Table 1: Baseline characteristics according to outcome variable (DN).
|
|
Level |
Overall |
DN |
p |
|
|
No |
Yes |
||||
|
Age |
61.61 ± 13.88 |
58.16 ± 13.48 |
66.15 ±13.08 |
<0.001 |
|
|
Gender |
Male |
1177 (53.2%) |
674 (53.5%) |
503 (52.7%) |
0.738 |
|
|
Female |
1036 (46.8%) |
585(46.5%) |
451 (47.3%) |
|
|
Race |
Mexican American |
463 (20.9%) |
268 (21.3%) |
195 (20.4%) |
0.164 |
|
|
Non-Hispanic White |
932 (42.1%) |
505 (40.1%) |
427 (44.8%) |
|
|
|
Non-Hispanic Black |
513 (23.2%) |
297 (23.6%) |
216 (22.6%) |
|
|
|
Other Hispanic |
188 (8.5%) |
118 (9.4%) |
70 (7.3%) |
|
|
|
Other |
117 (5.3%) |
71 (5.6%) |
46 (4.8%) |
|
|
Education level |
Less than 9th grade |
811 (36.6%) |
422 (33.5%) |
389 (40.8%) |
0.002 |
|
|
9 -12th grade |
521 (23.5%) |
306 (24.3%) |
215 (22.5%) |
|
|
|
More than 12th grade |
881 (39.8%) |
531 (42.2%) |
350 (36.7%) |
|
|
Marital status |
Married or living with a partner |
1333 (60.2%) |
791 (62.8%) |
542 (56.8%) |
0.005 |
|
|
Living alone |
880 (39.8%) |
468 (37.2%) |
412 (43.2%) |
|
|
PIR |
Low (≤1.3) |
725 (32.8%) |
383 (30.4%) |
342 (35.8%) |
<0.001 |
|
|
Medium (1.3-3.5) |
940 (42.5%) |
526 (41.8%) |
414 (43.4%) |
|
|
|
High (>3.5) |
548 (24.8%) |
350 (27.8%) |
198 (20.8%) |
|
|
Smoking status |
Never |
1046 (47.3%) |
602 (47.8%) |
444 (46.5%) |
0.005 |
|
|
Former smoker |
793(35.8%) |
421 (33.4%) |
372 (39.0%) |
|
|
|
Current smoker |
374 (16.9%) |
236 (18.7%) |
138 (14.5%) |
|
|
Hypertension |
No |
603 (27.2%) |
439 (34.9%) |
164 (17.2%) |
<0.001 |
|
|
Yes |
1610 (72.8%) |
820 (65.1%) |
790 (82.8%) |
|
|
Heart disease |
No |
1755 (79.3%) |
1078 (85.6%) |
677 (71.0%) |
<0.001 |
|
|
Yes |
458 (20.7%) |
181 (14.4%) |
277 (29.0%) |
|
|
CRP (mg/dL) |
2.03 ± 7.65 |
1.70 ± 4.46 |
2.47 ± 10.45 |
0.02 |
|
|
TyG |
9.25 ± 0.77 |
9.19 ± 0.72 |
9.34 ± 0.82 |
<0.001 |
|
|
CTI |
8.97 ± 1.00 |
8.88 ± 0.97 |
9.09 ± 1.02 |
<0.001 |
|
|
GGT (U/L) |
40.13 ± 67.10 |
36.56 ± 43.47 |
44.84 ± 88.98 |
0.004 |
|
|
UA (mg/dL) |
5.87 ± 1.59 |
5.59 ± 1.39 |
6.24 ± 1.76 |
<0.001 |
|
Participant Characteristics According to CTI Quartiles
The characteristics of participants grouped by CTI quartiles are shown in Table 2. Compared with the CTI Q1 group, participants in the Q4 group were younger and had higher levels of CRP, TyG, GGT, and UA (P < 0.05); in addition, the Q4 group had a significantly higher proportion of DN prevalence, females, Mexican Americans, and low-income individuals than the Q1 group (P < 0.05).
Table 2: Baseline characteristics according to CTI quartiles.
|
|
Level |
CTI |
|
|
|
p |
|
|
|
Q1 |
Q2 |
Q3 |
Q4 |
|
|
DN |
No |
344 (61.1%) |
325(59.3%) |
337(58.6%) |
253(48.0%) |
<0.001 |
|
|
Yes |
219(38.9%) |
223(40.7%) |
238(41.4%) |
274(52.0%) |
|
|
Age |
|
63.36 ± 13.48 |
62.74 ± 13.57 |
61.65 ± 14.20 |
58.51 ± 13.82 |
<0.001 |
|
Gender |
Male |
333(59.1%) |
286(52.2%) |
300(52.2%) |
258(49.0%) |
0.006 |
|
|
Female |
230(40.9%) |
262(47.8%) |
275(47.8%) |
269(51.0%) |
|
|
Race |
Mexican American |
84(14.9%) |
106(19.3%) |
137(23.8%) |
136(25.8%) |
<0.001 |
|
|
Non-Hispanic White |
242(43.0%) |
245(44.7%) |
238(41.4%) |
207(39.3%) |
|
|
|
Non-Hispanic Black |
164(29.1%) |
133(24.3%) |
115(20.0%) |
101(19.2%) |
|
|
|
Other Hispanic |
37(6.6%) |
35(6.4%) |
58(10.1%) |
58(11.0%) |
|
|
|
Other |
36(6.4%) |
29(5.3%) |
27(4.7%) |
25(4.7%) |
|
|
Education level |
Less than 9th grade |
184(32.7%) |
210(38.3%) |
228(39.7%) |
189(35.9%) |
0.274 |
|
|
9-12th grade |
139(24.7%) |
121(22.1%) |
130(22.6%) |
131(24.9%) |
|
|
|
More than 12th grade |
240(42.6%) |
217(39.6%) |
217(37.7%) |
207(39.3%) |
|
|
Marital status |
Married or living with a partner |
351(62.3%) |
328(59.9%) |
347(60.3%) |
307(58.3%) |
0.584 |
|
|
Living alone |
212(37.7%) |
220(40.1%) |
228(39.7%) |
220(41.7%) |
|
|
PIR |
Low (≤1.3) |
150(26.6%) |
172(31.4%) |
202(35.1%) |
201(38.1%) |
0.001 |
|
|
Medium (1.3-3.5) |
244(43.3%) |
250(45.6%) |
236(41.0%) |
210(39.8%) |
|
|
|
High (>3.5) |
169(30.0%) |
126(23.0%) |
137(23.8%) |
116(22.0%) |
|
|
Smoking status |
Never |
291(51.7%) |
267(48.7%) |
255(44.3%) |
233(44.2%) |
0.052 |
|
|
Former smoker |
186(33.0%) |
200(36.5%) |
219(38.1%) |
188(35.7%) |
|
|
|
Current smoker |
86(15.3%) |
81(14.8%) |
101(17.6%) |
106(20.1%) |
|
|
Hypertension |
No |
171(30.4%) |
136(24.8%) |
151(26.3%) |
145(27.5%) |
0.194 |
|
|
Yes |
392(69.6%) |
412(75.2%) |
424(73.7%) |
382(72.5%) |
|
|
Heart disease |
No |
442(78.5%) |
426(77.7%) |
453(78.8%) |
434(82.4%) |
0.249 |
|
|
Yes |
121(21.5%) |
122(22.3%) |
122(21.2%) |
93(17.6%) |
|
|
CRP (mg/dL) |
|
0.26 ± 0.57 |
0.71 ± 1.07 |
1.78 ± 3.15 |
5.57 ± 14.69 |
<0.001 |
|
TyG |
|
8.59 ± 0.48 |
9.02 ± 0.44 |
9.37 ± 0.52 |
10.06 ± 0.75 |
<0.001 |
|
GGT (U/L) |
|
34.06 ± 54.12 |
32.77 ± 30.45 |
42.32 ± 78.02 |
51.87 ± 89.21 |
<0.001 |
|
UA (mg/dL) |
|
5.69 ± 1.44 |
5.95 ± 1.58 |
5.91 ± 1.66 |
5.93 ± 1.67 |
0.021 |
Association between CTI and DN
To explore the relationship between CTI and DN, three multivariable adjusted models were constructed for analysis (Table 3).
Table 3: Relationship between CTI and DN in patients with diabetes mellitus in different models:
|
|
Model 1 |
Model 2 |
Model 3 |
|||
|
|
OR (95% CI) |
p |
OR (95% CI) |
p |
OR (95% CI) |
p |
|
CTI |
1.31(1.17,1.47) |
<0.001 |
1.51(1.33,1.72) |
<0.001 |
1.49(1.32,1.69) |
<0.001 |
|
CTI |
|
|
|
|
|
|
|
Q1 |
Ref |
Ref |
Ref |
Ref |
Ref |
Ref |
|
Q2 |
1.14(0.85,1.55) |
0.366 |
1.23(0.91,1.68) |
0.181 |
1.15(0.83,1.60) |
0.390 |
|
Q3 |
1.19(0.84,1.70) |
0.324 |
1.29(0.89,1.87) |
0.173 |
1.23(0.86,1.75) |
0.262 |
|
Q4 |
2.00(1.45,2.75) |
<0.001 |
2.92(2.06,4.14) |
<0.001 |
2.74(1.95,3.84) |
<0.001 |
|
P for trend |
|
<0.001 |
|
<0.001 |
|
<0.001 |
Model 1: unadjusted; Model 2: adjusted for gender, age, and race; Model 3: adjusted for gender, age, race, education level, marital status, PIR, smoking status, hypertension, and heart disease. CTI: C-reactive protein.
The results showed that CTI was significantly associated with the risk of DN in all models (P < 0.001): in Model 1, each 1-unit increase in CTI was associated with a 31% increase in the risk of DN (OR = 1.31, 95% CI: 1.17-1.47); after adjusting for age, gender, and race in Model 2, the association was enhanced (OR = 1.51, 95%CI: 1.33-1.72); after further adjusting for all covariates in Model 3, each 1-unit increase in CTI was associated with a 49% increase in the probability of DN (OR = 1.49, 95% CI: 1.32-1.69). Quartile analysis revealed that compared with the lowest CTI quartile (Q1), the highest CTI quartile (Q4) group had a significantly higher risk of DN (Model 3: OR = 2.74, 95% CI: 1.95-3.84), with a significant dose-response trend (P < 0.001).
Restricted cubic spline curve analysis showed that after adjusting for all covariates, CTI not only had a significant overall correlation with DN risk (P < 0.001) but also exhibited a significant non-linear characteristic (non-linear P = 0.006), that is, wherein the strength of the association gradually increased with elevated CTI levels (Figure 2).
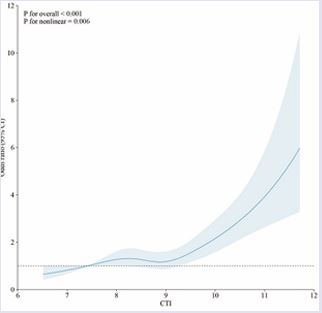
Figure 2 Nonlinear relationships between CTI and DN risk. The solid blue line displays the.
Subgroup Analysis
In the fully adjusted Model 3, stratified subgroup analyses were performed by age, gender, race, educational level, marital status, PIR, smoking status, hypertension, and heart disease, and interaction effects were tested (Figure 3). The results showed that, except for the subgroups of Mexican Americans, participants with educational level less than 9th grade, and those with comorbid heart disease, CTI elevation was significantly associated with DN risk in all other subgroups (P < 0.05). However, for subgroup interactions, a p-value > 0.05 was considered more statistically significant. Except for age, the p-values for all subgroup interactions were > 0.05, indicating that the association between CTI and DN was relatively stable and, apart from age, not significantly influenced by the aforementioned covariates.
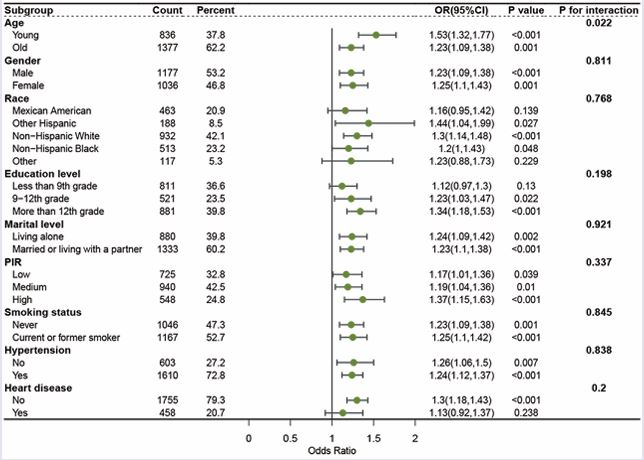
Figure 3 Subgroup analysis of the relationship between CTI and diabetic nephropathy. Adjusted variables: gender, age, race, education level, marital status, PIR, smoking status, hypertension, and heart disease. The model was not adjusted for the stratification variables themselves in the corresponding stratification analysis. PIR, Poverty-to-income ratio; OR, odds ratio; CI, confidence interval.
Association between OS Indicators and DN
Three multivariable adjusted models were constructed to analyze the association between GGT, UA, and DN (Table 4).
Table 4: Relationship between oxidative stress indicators and DN in patients with diabetes mellitus in different models
|
|
Model 1 |
Model 2 |
Model 3 |
|||
|
|
OR (95% CI) |
p |
OR (95% CI) |
p |
OR (95% CI) |
p |
|
GGT |
1.00(1.00,1.01) |
0.005 |
1.00(1.00,1.01) |
<0.001 |
1.00(1.00,1.01) |
0.001 |
|
GGT |
|
|
|
|
|
|
|
Q1 |
Ref |
Ref |
Ref |
Ref |
Ref |
Ref |
|
Q2 |
0.91(0.65,1.28) |
0.607 |
0.95(0.67,1.35) |
0.784 |
0.88(0.62,1.26) |
0.498 |
|
Q3 |
0.90(0.61,1.34) |
0.609 |
1.11(0.76,1.62) |
0.601 |
1.01(0.69,1.47) |
0.961 |
|
Q4 |
1.14(0.78,1.67) |
0.511 |
1.46(0.98,2.17) |
0.064 |
1.29(0.87,1.94) |
0.212 |
|
P for trend |
|
0.472 |
|
0.027 |
|
0.107 |
|
|
|
|
|
|
|
|
|
UA |
1.31(1.23,1.40) |
<0.001 |
1.29(1.20,1.39) |
<0.001 |
1.26(1.17,1.36) |
<0.001 |
|
UA |
|
|
|
|
|
|
|
Q1 |
Ref |
Ref |
Ref |
Ref |
Ref |
Ref |
|
Q2 |
1.20(0.87,1.66) |
0.273 |
1.09(0.76,1.56) |
0.656 |
1.04(0.72,1.50) |
0.845 |
|
Q3 |
1.47(1.13,1.91) |
0.005 |
1.37(1.02,1.85) |
0.038 |
1.32(0.98,1.77) |
0.072 |
|
Q4 |
2.76(2.06,3.70) |
<0.001 |
2.55(1.86,3.50) |
<0.001 |
2.32(1.68,3.21) |
<0.001 |
|
P for trend |
|
<0.001 |
|
<0.001 |
|
<0.001 |
Model 1: unadjusted; Model 2: adjusted for gender, age, and race; Model 3: adjusted for gender, age, race, education level, marital status, PIR, smoking status, hypertension, and heart disease.GGT: gamma-glutamyl transferase; UA: uric acid; DN: diabetic nephropathy; OR: odds ratio; CI: confidence interval The results showed that UA was significantly associated with the risk of DN in all models (P < 0.001): in Model 3, each 1-unit increase in UA was associated with a 26% increase in the risk of DN (OR=1.26, 95%CI: 1.17-1.36); compared with the UA Q1 group, the Q4 group had a significantly higher risk of DN (Model 3: OR = 2.32, 95% CI: 1.68-3.21), with a significant dose-response trend (P < 0.001). After adjusting for covariates, GGT had no independent association with DN ((OR = 1.29, 95% CI: 0.87-1.94, P = 0.212 for the GGT Q4 group in Model 3).
Mediation Analysis

Figure 4 Mediating effects of oxidative stress indicators on the association between CTI and DN. (a) Mediating effect of GGT on the association between CTI and DN. (b) Mediating effect of UA on the association between CTI and DN. DN, diabetic nephropathy; CTI, C-reactive protein triglyceride-glucose index; GGT, gamma-glutamyl transferase; UA, uric acid; OR, odds ratio.
The results of mediation analysis showed that GGT and UA partially mediated the association between CTI and DN (Figure 4): the mediating proportion of GGT was 6.95% (indirect effect OR=4.43×10?³, 95%CI: 1.97×10?³- 7.41×10?³, P<0.001); the mediating proportion of UA was 9.70% (indirect effect OR=6.10×10?³, 95%CI: 6.80×10??-1.22×10?², P=0.026).
DISCUSSION
Based on a cross-sectional analysis of the large-scale NHANES database, this study found that the composite biomarker CTI had an independent and non-linear association with DN in diabetic patients. With the increase in CTI levels, the risk of DN in diabetic patients increased significantly. After multivariable adjustment, each 1-unit increase in CTI was associated with a 49% increase in the probability of DN, and this association was more pronounced in the high CTI quartile population (2.74-fold higher risk compared with the lowest quartile). Subgroup analysis confirmed that this association remained stable in most population subgroups and was not significantly affected by covariates such as gender, race, educational level, and marital status. In addition, mediation analysis first confirmed that OS indicators (GGT, UA) played a partial mediating role in the association between CTI and DN, further revealing the potential mechanism of CTI involved in the pathogenesis of DN. To the best of our knowledge, this study is the first large-scale population based study focusing on the association between CTI and DN, providing a new biomarker and theoretical basis for the risk assessment of DN.
The results of this study are consistent with previous research conclusions, further verifying the core role of inflammation and metabolic abnormalities in the development and progression of DN. As a classic inflammatory marker, elevated CRP levels are closely associated with an increased incidence of DN and have been used to evaluate the effect of drug therapy, playing an important role in the early detection and disease monitoring of DN [23,24]. Moreover, as a reliable indicator for evaluating IR, multiple multicenter studies have confirmed a significant association between TyG and DN risk [25]. By integrating the core information of CRP and TyG, CTI reflects both inflammatory and metabolic disorders, capturing the key pathophysiological characteristics of DN more comprehensively than single indicators. Previous studies have confirmed that CTI is significantly associated with various diseases, such as rheumatoid arthritis and cardiovascular diseases [26,27], suggesting its potential value as a cross-disciplinary prognostic marker. This study is the first to apply it to the field of DN, providing important data support for the expansion of its clinical application scenarios.
The biological mechanism underlying the association between CTI and DN remains incompletely understood and requires further research. However, several reasonable physiological pathways may explain this correlation. Pathological conditions such as hyperglycemia and hypoxia can induce OS and inflammatory responses in renal tissues, which mutually promote each other through an “oxidative stress-inflammation” positive feedback loop, jointly exacerbating renal injury [28]. On the one hand, excessive release of ROS can recruit the infiltration of inflammatory cells such as lymphocytes and macrophages, and activate key transcription factors such as nuclear factor κB (NF κB), promoting the expression of pro-inflammatory factors and adhesion molecules such as MCP-1, ICAM-1, IL-1β, and TNF-α [29]. Meanwhile, hyperglycemia can upregulate the expression of NOX4 and P22phox through the NF-κB receptor activator pathway to enhance ROS production [30-32], on the other hand, persistently activated inflammatory responses can further increase ROS levels through regulating OS-related pathways, exacerbating oxidative-antioxidative imbalance [33]. In addition, as a core pathophysiological characteristic of diabetes, IR plays a key role in the progression of DN [34,35]. IR can lead to metabolic abnormalities, activate protein kinase C (PKC), which induces OS by activating mitochondrial NADPH oxidase; it also increases the expression of NF-κB and its pro-inflammatory genes, and activates plasminogen activator inhibitor-1 (PAI-1) to inhibit fibrinolysis, ultimately leading to ESRD [36]. Thus, both inflammation and IR are heavily involved in the progression of DN, and both are inseparable from OS. This study verified this conclusion at the data level through mediation analysis, showing that multiple OS indicators partially mediated the association between the composite indicator CTI and DN.
This study has several significant advantages: first, based on the large-scale nationally representative NHANES database, 2,213 participants were enrolled, with samples covering multiple demographic characteristics, ensuring the generalizability and extrapolation of the study results; second, it innovatively focused on CTI, a composite biomarker, overcoming the limitation that single indicators can only reflect local pathological states; third, through rigorous statistical methods such as multivariable adjusted models, subgroup analysis, and restricted cubic spline curves, the independence, stability, and non-linear characteristics of the association between CTI and DN were systematically verified; finally, the partial mediating role of OS was clarified through mediation analysis, and the biological rationality of the association was explained in combination with existing pathophysiological mechanisms, realizing the organic combination of statistical analysis and mechanism exploration.
However, this study also has some limitations. First, due to the cross-sectional study design, although various statistical methods were used to control confounding factors, the causal relationship between CTI and DN cannot be clearly established. Whether CTI is a risk factor for DN or a concomitant phenomenon of disease progression requires further verification by prospective intervention studies. Second, NHANES data are mainly from the U.S. population, whose dietary structure and medical background are different from those in other regions. The extrapolation of the study results to non U.S. populations (especially Asian populations) needs to be considered cautiously, and subsequent multicenter studies are required for verification. Third, although the mediating role of OS was confirmed in the mechanism exploration, the specific molecular targets of CTI regulating OS were not thoroughly analyzed, which may miss some key mediating links. Finally, stratified analysis was not performed for clinical characteristics such as diabetes duration and treatment regimens (e.g., hypoglycemic and anti-inflammatory drugs), and it remains unclear whether the predictive efficacy of CTI differs in different clinical subgroups.
CONCLUSION
Based on the large-scale NHANES database, this study confirmed that the composite biomarker CTI has an independent and non-linear association with DN in diabetic patients, and OS plays a partial mediating role. As a new indicator integrating inflammatory and metabolic information, CTI is simple to operate, economical, and efficient, and is expected to become a potential clinical biomarker for identifying high-risk populations of DN. Incorporating CTI into the routine evaluation system of diabetic patients may facilitate early identification of high risk individuals, provide targets for precise intervention, and thereby improve the disease outcomes and prognosis of DN patients.
DECLARATIONS
Ethics approval and consent to participate
The research protocol received approval from the NCHS Ethics Review Board (refer to https://www.cdc. gov/nchs/nhanes/about/erb.html). It was conducted in accordance with the Declaration of Helsinki, with every NHANES participant providing written informed consent.
Data availability
The original data of this study have been deposited on the NHANES website (https://wwwn.cdc.gov/nchs/ nhanes/default.aspx). The code and data generated during the study were available from the corresponding author on reasonable request.
Author Contributions
CWY, ZZZ, and HYB designed the study; WY, CSL, and WY collected the data; WY and ZLL analyzed the data; WY completed the initial manuscript; ZLL, CSL, WY, and HYB revised the manuscript, and all authors read and approved the final manuscript.
Acknowledgments
We would like to acknowledge all participants and investigators of the National Health and Nutrition Examination Survey.
REFERENCES
- Zhang S, Zhang S, Bai X, Wang Y, Liu Y, Liu W. Thonningianin A ameliorated renal interstitial fibrosis in diabetic nephropathy mice by modulating gut microbiota dysbiosis and repressing inflammation. Front Pharmacol. 202; 15: 1389-1654.
- Zhang C, Zhao H, Yan Y, Li Y, Lei M, Liu Y, et al. LncRNA evf-2 Exacerbates Podocyte Injury in Diabetic Nephropathy by Inducing Cell Cycle Re-entry and Inflammation Through Distinct Mechanisms Triggered by hnRNPU. Adv Sci Weinh. 2024; 11: 2406-2532.
- Song C, Zhu Z, Liu L, Liu S, Li Y, Xiao Y, et al. The efficacy and safety of Niaoduqing granules in the treatment of diabetic kidney disease: a systematic review and meta-analysis. Front Pharmacol. 2023; 14: 210-271.
- Hung PH, Hsu YC, Chen TH, Lin CL. Recent Advances in Diabetic Kidney Diseases: From Kidney Injury to Kidney Fibrosis. Int J Mol Sci. 2021; 21:118-157.
- Sproston NR, Ashworth JJ. Role of C-Reactive Protein at Sites ofInflammation and Infection. Front Immunol. 2018, 139-154.
- Wang C, Yatsuya H, Tamakoshi K, Uemura M, Li Y, Wada K, et al. Positive association between high-sensitivity C-reactive protein and incidence of type 2 diabetes mellitus in Japanese workers: 6-year follow-up. Diabetes Metab Res Rev. 2013; 5: 398-405.
- Sinha SK, Nicholas SB, Sung JH, Correa A, Rajavashisth TB, Norris KC, et al. hs-CRP Is Associated With Incident Diabetic Nephropathy: Findings From the Jackson Heart Study. Diabetes Care. 2019; 11: 208- 209.
- You YK, Huang XR, Chen HY, Lyu XF, Liu HF, Lan HY. C-Reactive Protein Promotes Diabetic Kidney Disease in db/db Mice via the CD32b-Smad3-mTOR signaling Pathway. Sci Rep. 2016; 6: 267-340.
- Hou G, Dong Y, Jiang Y, Zhao W, Zhou L, Cao S, et al. Immune inflammation and metabolic interactions in the pathogenesis of diabetic nephropathy. Front Endocrinol Lausanne. 2025; 16: 1502-1594.
- Zhang F, Han Y, Mao Y, Li W. Associations between non-insulin-based insulin resistance indices and diabetic nephropathy in patients with diabetes mellitus in US adults: a cross-sectional study of NHANES 1999–2018. Front Endocrinol (Lausanne). 2024; 15: 1458-1521
- Bjornstad P, Nehus E, El Ghormli L, Bacha F, Libman IM, McKay S, et al. Insulin Sensitivity and Diabetic Kidney Disease in Children and Adolescents With Type 2 Diabetes: An Observational Analysis of Data From the TODAY Clinical Trial. Am J Kidney Dis. 2018; 1: 65-74.
- Fritz J, Brozek W, Concin H, Nagel G, Kerschbaum J, Lhotta K, et al. The Triglyceride-Glucose Index and Obesity-Related Risk of End- Stage Kidney Disease in Austrian Adults. JAMA Netw Open. 2021; 3: e212-612.
- Püschel GP, Klauder J, Henkel J. Macrophages, Low-Grade Inflammation, Insulin Resistance and Hyperinsulinemia: A Mutual Ambiguous Relationship in the Development of Metabolic Diseases. J Clin Med. 2022; 15: 43-58.
- Li T, Wang P, Wang X, Liu Z, Zhang Z, Zhang Y, et al. Inflammation and Insulin Resistance in Diabetic Chronic Coronary Syndrome Patients. Nutrients. 2023; 12: 28-38.
- Goldsmith DR, Bekhbat M, Le NA, Chen X, Woolwine BJ, Li Z, et al. Protein and Gene Markers of Metabolic Dysfunction and Inflammation Together Associate with Functional Connectivity in Reward and Motor Circuits in Depression. Brain Behav Immun. 2020; 88: 193-202.
- Huang C, You H, Zhang Y, Li Z, Li M, Feng X, et al. Association betweenC-reactive protein-triglyceride glucose index and depressive symptoms in American adults: results from the NHANES 2005 to 2010. BMC Psychiatry. 2024; 24: 88-90.
- Li R, Yan X, Zhao Y, Liu H, Wang J, Yuan Y, et al. Oxidative Stress Induced by Nuclear Factor Erythroid 2-Related Factor 2 (NRF2) Dysfunction Aggravates Chronic Inflammation Through the NAD+/ SIRT3 Axis and Promotes Renal Injury in Diabetes. Antioxidants (Basel). 2025; 3: 130-267.
- Charlton A, Garzarella J, Jandeleit-Dahm KAM, Jha JC. Oxidative Stress and Inflammation in Renal and Cardiovascular Complications of Diabetes. Biology (Basel). 2020; (1): 17-18.
- Li X, Zhang Y, Xing X, Li M, Liu Y, Xu A, et al. Podocyte injury of diabetic nephropathy: Novel mechanism discovery and therapeutic prospects. Biomed Pharmacotherap. 2023; 168: 115-170.
- Wang Y, Zhang X, Yao H, Chen X, Shang L, Li P, et al. Peroxisome- generated succinate induces lipid accumulation and oxidative stress in the kidneys of diabetic mice. J Biol Chem. 2022; 3:101-160.
- Huo G, Tang Y, Liu Z, Cao J, Yao Z, Zhou D. Association between C-reactive protein-triglyceride glucose index and stroke risk in different glycemic status: insights from the China Health and Retirement Longitudinal Study (CHARLS). Cardiovasc Diabetol. 2025; 26; 124-142.
- Sun Y, Guo Y, Ma S, Mao Z, Meng D, Xuan K, et al. Association of C-reactive protein-triglyceride glucose index with the incidence and mortality of cardiovascular disease: a retrospective cohort study. Cardiovasc Diabetol. 2025; 1: 113-123.
- Luna E, Álvarez Á, Rodriguez-Sabiñón J, Villa J, Giraldo T, Martín MV, et al. Long-Term Effect of Semaglutide on the Glomerular Filtration Rate Slope in High-Risk Patients with Diabetic Nephropathy: Analysis in Real-World Clinical Practice. Pharmaceutics. 2025; 7: 29-43.
- Lin CC, Li CI, Liu CS, Liao LN, Yang CW, Lin CH, et al. Association of high-sensitivity C-reactive protein and diabetic nephropathy in patients with type 2 diabetes: a Mendelian randomization study. BMJ Open Diabetes Res Care. 2023; 1: e1003-2197.
- Ou YL, Lee MY, Lin IT, Wen WL, Hsu WH, Chen SC. Obesity-related indices are associated with albuminuria and advanced kidney disease in type 2 diabetes mellitus. Ren Fail. 2021; 1: 125-128.
- Xie H, Liu Q, Xu X, Wu Y, Liu J, Lin D, et al. Nonlinear Association Between the C-Reactive Protein-Triglyceride-Glucose Index and Rheumatoid Arthritis Risk: The Mediating Role of Body Mass Index. Mediators Inflamm. 2025; 729-780.
- Ding W, Shi F, Wang Z, Wang L, Fang C. The Relationship between C-Reactive Protein-Triacylglycerol-Glucose Index and All-Cause Mortality in Patients with Cardiovascular Disease: A Retrospective Cohort Study and Development of a Machine Learning Prediction Model. Cardiovasc Ther. 2025; 91-98.
- Jin Q, Liu T, Qiao Y, Liu D, Yang L, Mao H, et al. Oxidative stress and inflammation in diabetic nephropathy: role of polyphenols. Front Immunol. 2023; 14: 1185-1317.
- Haddad Y, Couture R. Localization and Interaction between Kinin B1 Receptor and NADPH Oxidase in the Vascular System of Diabetic Rats. Front Physiol. 2017; 8: 58-61.
- Sun HJ, Xiong SP, Cao X, Cao L, Zhu MY, Wu ZY, et al. Polysulfide- mediated sulfhydration of SIRT1 prevents diabetic nephropathy by suppressing phosphorylation and acetylation of p65 NF-κB and STAT3. Redox Biol. 2021; 101-113.
- Ke G, Chen X, Liao R, Xu L, Zhang L, Zhang H, et al. Receptor activator of NF-κB mediates podocyte injury in diabetic nephropathy. Kidney Int. 2021; 2: 377-390.
- Wang Z, Liu B, Zhu J, Wang D, Wang Y. Nicotine-mediated autophagy of vascular smooth muscle cell accelerates atherosclerosis via nAChRs/ ROS/NF-κB signaling pathway. Atherosclerosis. 2019; 284: 9-10.
- Bai B, Yang Y, Wang Q, Li M, Tian C, Liu Y, et al. NLRP3 inflammasomein endothelial dysfunction. Cell Death Dis. 2020; 9: 67-76.
- Zhang F, Han Y, Mao Y, Li W. Associations between non-insulin-based insulin resistance indices and diabetic nephropathy in patients with diabetes mellitus in US adults: a cross-sectional study of NHANES 1999–2018. Front Endocrinol (Lausanne). 2024; 15: 458-521.
- Pham H, Robinson-Cohen C, Biggs ML, Ix JH, Mukamal KJ, Fried LF, et al. Chronic kidney disease, insulin resistance, and incident diabetes in older adults. Clin J Am Soc Nephrol. 2012; 4: 588-594.
- Sahakyan G, Vejux A, Sahakyan N. The Role of Oxidative Stress- Mediated Inflammation in the Development of T2DM-Induced Diabetic Nephropathy: Possible Preventive Action of Tannins and Other Oligomeric Polyphenols. Molecules. 2022; 24: 30-35.