Ftir Spectroscopy used in Covid-19 Analysis
- 1. S.C. AAB_IR research S.R.L, Bragadiru – Ilfov district, Romania
- 2. Department of Pharmaceutical and Medicinal Chemistry, Pharmaceutical and Drug Industries Research Division, National Research Center, Egypt
Citation
Bunaciu AA, Aboul-Enein HY. (2025) Ftir Spectroscopy used in Covid-19 Analysis. J Drug Des Res 12(1): 1099.
INTRODUCTION
Humans and viruses have been neighbors from the beginning of life on Earth, and there has always been an argument for protection from viruses through vaccination and antiviral medications. During public health, viral illnesses are a major concern. These days, the environment is full of viruses; biologists know most of them, but some remain unidentified.
By the end of 2019, Severe Acute Respiratory Syndrome Coronavirus 2 (SARS-CoV-2) was one of the biggest continuing risks to humans. According to the most recent statistics from the World Health Organization (WHO), on 2 March 2025, COVID-19 has already been diagnosed in 777,594,331 cases and caused 7,089,989 deaths [1]. The global economy, quality of life, and life expectancy have all suffered significantly as a result of the high infection and fatality rates of COVID-19.
Infecting humans, animals, and birds, the largest singlestranded RNA viruses are members of the Coronaviridae family [2,3]. Coronaviruses, which belong to the family Coronaviridae, can cause neurological and respiratory disorders [4]. Severe acute respiratory syndrome coronavirus (SARS-CoV), Middle East respiratory syndrome coronavirus (MERS-CoV), HCoV-229E, HCoVHKU1, HCoV-OC43, and HCoV NL63 are the six human coronaviruses (HCoVs) that have been identified. Positive single-stranded RNA viruses, known as coronaviruses, are members of the coronavirus family and are categorized into four families based on genetics: α, β, γ, and δ coronavirus [5,6]. The beta-coronavirus genus is the source of the SARS-CoV-2 coronavirus.
The need for a rapid point-of-care testing (POCT), tool to assist in diagnosing COVID-19 absent from a laboratory setting is essential due to the virus’s rapid transmission and limited capacity of laboratory-based molecular detection. The current gold standard for diagnosing COVID-19 is RT-PCR [7,8]. RT-PCR is highly sensitive and accurate for detecting viral genomes because it can identify a single RNA molecule in a single reaction. This method’s main drawbacks were the dearth of professionals in the field and the elevated risk of nosocomial infections to which they are subjected. It also takes a long time because the approach requires sample preparation before analysis. Mass testing is inappropriate for this procedure because the assay takes around 4 hours and requires expensive equipment and consumables. The most important idea is that without standard curves, which are rarely performed in diagnostic labs, RT-PCR cannot generate quantitative data. The approach presents high specificity, sensitivity, and accuracy values (100% and 95.45%).
Historically, the first biologist was Rhazes (865-925), also known as Al-Razi, Abu Bakr Muhammad ibn Zakariya al-Razi, from ancient Persia. He reported measles and smallpox and developed the theory of acquired immunity [9]. There are other important researchers in virology and immunology, such as Edward Jenner [10], Louis Pasteur [11], and many others with significant contributions to developing this science [12].
The sense-strand RNA genome of SARS-CoV-2 has a large number of molecular targets that are suitable for PCR detection. Sample transportation, sample testing, sample collecting, and test result analysis are all included in the standardized plan that the WHO created. The sensitivity, stability, and detection time of the quantitative RT-PCR (RT-qPCR) tests that are now on the market, however, differ greatly. Additionally, the cost of the test is rather significant. The time needed for sample transportation is significantly longer than the time needed for testing, which further delays the diagnosis [13].
In the early days of the epidemic in China, research on SARS-CoV-2 began, and the virus’s structure was identified. Figure 1 shows that SARS-CoV-2 is round (60–140 nm) and has spike proteins and genetic material on its surface.
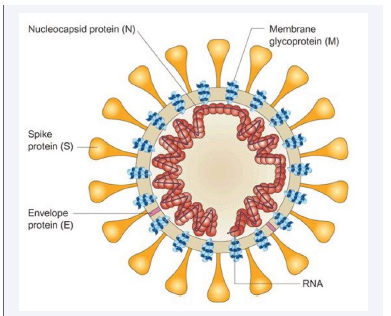
Figure 1: Schematic structure and TEM image of the SARS-CoV-2 virus.
Its structure is similar to that of viruses in the Coronaviridae family [14].
As the global pandemic spreads in new waves, many technology advancements have been investigated worldwide for quick, portable, and affordable COVID-19 testing to meet ongoing and changing testing requirements.
With excellent specificity and sensitivity, FTIR sampling could differentiate between healthy controls and proven COVID-19 cases using transflection (slide mount) or attenuated total reflectance (ATR, directly printed onto
a highly reflecting crystal) [15,16].
The standard methods for detecting COVID-19 can be classified based on the biomarkers. These are radiology, serology, and nucleic acid amplification-based tests. A promising method for COVID-19 detection is the
spectroscopy technique [17,18].
One quick and nondestructive method of characterizing viruses is infrared spectroscopy, which may identify various viral proteins based on spectral features. However, when assessing samples with low concentrations,
conventional infrared spectroscopy lacks the contrast in absorption signal strength. FTIR spectroscopy was recently reported as a promising point-of-care approach for COVID-19 detection using a pharyngeal swab or saliva, as an alternative to employing particular reagents (i.e., PCR primers, antibodies) to detect SARS-CoV-2 viral RNA or proteins [19,20].
It has been noted that infrared and Raman spectroscopies can help diagnose bacterial and viral infections. Infrared spectroscopy is a low-cost method of virus detection that benefits the community [21].
FTIR spectroscopy is a widely accepted and applied method for determining the identity and investigation of biological materials. It detects molecular vibrations caused by shifts in the electric dipole moment in chemical
bonds, which are brought about by light absorption in the electromagnetic spectrum’s 400–5000 cm−1 infraredregion. A virus can be identified on the spectrum if itaffects blood composition, either through the virus itself
or by the infection’s impact on the host. This alteration will only be visible if it falls within the technique’s LOD (limits of detection) [18].
This mini-review aims to highlight some of the most significant research released after our previous review [22]. If the first review was focused on COVID-19 analysis in saliva, this will try to present some new applications
that are applied to detect SARS-CoV-2–COVID-19 infection in all other bodily fluids. To create a highly sensitive and accurate point-of-care COVID-19 detection system, the research community can refer to several publications that offer broad guidance [23-29].
INFRARED SPECTROSCOPY IN COVID-19 ANALYSIS
Fourier transform infrared (ATR-FTIR) spectroscopy can classify different diseases using a multivariate statistical model. It is based on the vibrational signatures of chemical structures. Several reviews related to ATR-FTIR
spectroscopy as a quick screening test to find COVID-19 have been published in the last period [30-33].
ATR−FT-IR was demonstrated to be feasible for COVID-19 screening and primary diagnosis by Zhang and colleagues [34]. Multivariate and statistical analysis was used to determine the spectrum differences between COVID-19 and healthy controls as well as the potential spectral markers. Healthy controls and a few typical respiratory viral illnesses or inflammations were considered for the performance test, which focused mostly
on the specificity of the suggested model.Figure 2 presents spectral profiles of COVID-19 and control serum samples and some abundant constituents in human serum.
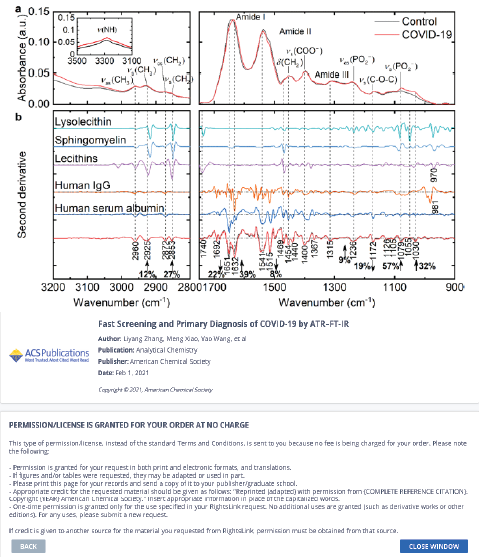
They noticed that the amide I band of the COVID-19 group had a significant red shift of roughly 6 cm−1 compared to the control (p < 0.001, Figure 2a), suggesting the transitions in protein secondary structures.
Numerous publications have confirmed the observations made by the Second Derivative IR spectra in Figure 2b, which showed increases in Ig levels and decreases in albumin levels in the sera of COVID-19 patients. IgG titers are four times higher in 19.5% of COVID-19 patients, according to research by Long et al [35].
In addition to clinical data that are known to the physician at the time of admission, a predictive algorithm for COVID-19 disease stratification into severe and nonsevere COVID-19 was carried out utilizing ATR-FTIR spectra [36]. Using 75% ethanol for viral inactivation, a straightforward plasma processing and ATR-FTIR datacollecting method was developed. Next, using data from 130 and 30 patients, respectively, partial least squaresdiscriminant analysis (PLS-DA) models were created and evaluated.
Figure 3: displays the mean spectra of the severe and non-severe groups, which are often fairly close to prior reports of FTIR of serum and plasma [37,38].
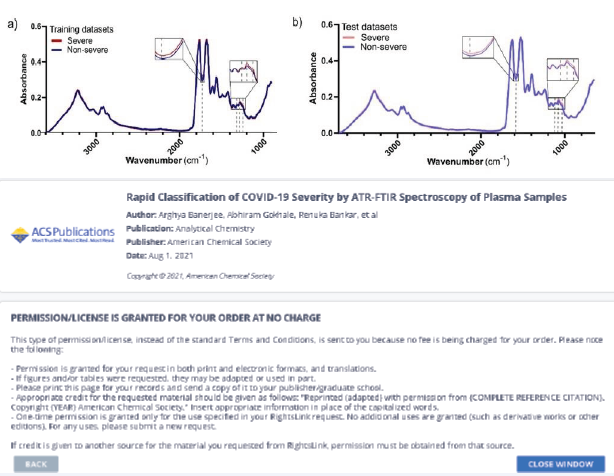
Figure 3 PLS-DA model for COVID-19 disease severity from plasma ATR-FTIR spectra.
A study utilizing FTIR spectroscopy, laboratory indexes, machine learning-based modeling, and Lissajous curves was published [39]. The study involved women infected with COVID-19 and at varying stages of pregnancy. They demonstrated how the FTIR spectra’s absorbance maxima indicate whether a condition is symptomatic or not. As a result, this enables researchers to identify the specific chemical components in the body that cause COVID-19 in pregnant women to progress symptomatically or asymptomatically. The completed computations may serve as a foundation for the creation of viable spectrochemical research models for diagnostic purposes.
Representative FTIR spectra of serum collected from COVID-19 infected pregnant women: T2 (black spectrum – pregnant women in the second trimester with asymptomatic COVID-19); T3 (red spectrum - pregnant women in the third trimester with asymptomatic COVID-19); T2s (blue spectrum - pregnant women in the second trimester with severe COVID-19 symptoms) and without COVID-19 disease (green spectrum).
The FTIR spectra that were obtained demonstrated notable distinctions between COVID-19 women exhibiting light and severe symptoms. In the former, shifts in peak positions resulting from asymmetric stretching vibrations of CH3 groups from lipids were observed, in contrast to the results discovered for COVID-19 women exhibiting light symptoms.
In Figure 4, visible peaks were marked in the collected FTIR spectra. These peaks correspond to functional groups building protein and lipid structures. The peak at 1401 cm-1 corresponds to CH2, as well as scissoring vibrations of CH2 groups from carbohydrates and proteins were observed. Amide II and amide I vibrations were located at 1537 cm-1 and 1628 cm-1, while vibrations of lipid functional groups were noticed at 1737 cm-1, 2893 cm-1, and 2981 cm-1, respectively [40-42].
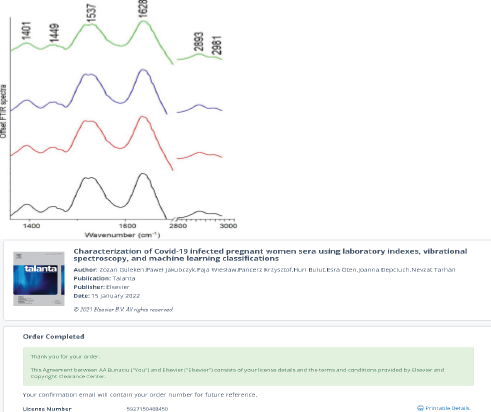
Figure 4: Representative FTIR spectra of serum collected from COVID-19 infected pregnant women: T2 (black spectrum); T3 (red spectrum); T2s
(blue spectrum) and without COVID-19 disease (green spectrum).
The ability to detect severe acute respiratory syndrome coronavirus 2 (SARS-CoV-2), from nasopharyngeal swab samples originally collected for polymerase chain reaction (PCR) analysis was investigated using Fourier-transform infrared (ATR-FTIR) spectroscopy in conjunction with machine learning-based partial least squares discriminant analysis (PLS-DA) [43] Figure 5 and Figure 6 presents the average spectra for positive and negative samples.
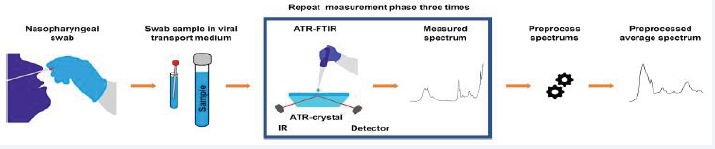
Figure 5: Data acquisition for a routine nasopharyngeal swab sample.
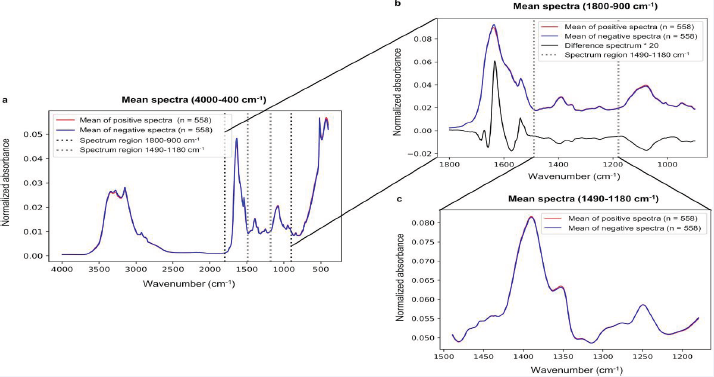
Figure 6 Average spectra for positive and negative samples of COVID-19.
Even though the entire fingerprint range (1800–900 cm−1), is frequently employed in previous studies, it appears from the analysis of the study’s results that the spectral region of 1490–1180 cm−1 contains adequate information to categorize ATR–FTIR spectra. Conversely, it was not possible to determine distinct wavenumbers to classify spectra. The ATR-FTIR measurement with machine learning-based analysis can detect the SARSCoV- 2 infection with a reasonable level of performance, the sensitivity was reported to be around 84%, the specificity around 65%, and the accuracy around 77%. The modestperformance could be attributed to the viral particles’ low concentration in the viral lysis buffer and transport medium.
In another study, the nasopharyngeal swab samples were studied based on the FTIR spectra of the extracted RNAs [44] — a 100% accuracy of all samples with concentrations as low as 10 copies/μl was obtained. In
addition, a weak detection with concentrations below 10 copies/μl was observed on synthetic samples, which is consistent with the results obtained on clinical samples. It was demonstrated in this work that the use of FT-IR
spectroscopy on RNA extracts and machine learning is highly convenient and appropriate for the diagnosis of Covid-19 disease.
Spectroscopic data collection and processing using artificial intelligence algorithms are used in a novel approach that combines fast and accurate label-free diagnosis of SARS-CoV-2 infection in clinical samples [45].The findings indicate that nasopharyngeal swab samplesfrom asymptomatic or mildly symptomatic patients had an accuracy of 85% for SARS-CoV-2 identification, while tracheal aspirate samples from critically ill COVID-19
patients on mechanical ventilation had an accuracy of 97%. Additionally, the information can be collected and analyzed more quickly, easily, and affordably than with conventional methods, indicating that this technology
holds promise as a biomedical diagnostic tool in the face of future risks from SARS-CoV-2 variants that are emerging and reviving.
Saliva serves as a frequent and temporary vector for the spread of viruses. Large saliva droplets that are produced by breathing, talking, and sneezing readily fall to the ground and only allow for short-distance transmission
among the various-sized droplets that are produced [46]. Saliva is a sensitive way to identify SARS-CoV-2 [47], and a different kind of sample for testing antibodies and antigens [48,49].
According to several recent research, SARS-CoV-2 can be found in saliva, offering a more scalable and noninvasive method of collecting specimens [50,51].
A comparison of the effectiveness of various Machine Learning (ML) techniques was conducted to determine which would yield the best results for the characterizationof (ATR)-FTIR saliva spectra [52]. Of the samples, somewere reliably assigned to the control group because they were obtained and processed during 2019, a year with no cases of SARS-CoV-2 virus infection being reported in Mexico, and some were confirmed as carriers of the virus.
Figure 7 illustrates how drying the sample affects the various biological macromolecules present in the sample, including lipids (3000–2800 cm-1), proteins (1700–1600cm-1 and 1560–1500 cm-1, where vibrations related toamides I and II are reported), and nucleic acids (1250–1000 cm-1) [53,54], while Figure 8 presents the averaged spectra comparatively, in the full spectrum and for clarity using the specific regions: amide protein regions (1700 -1500 cm-1) and nucleic acid region(1240 - 1000 cm-1).
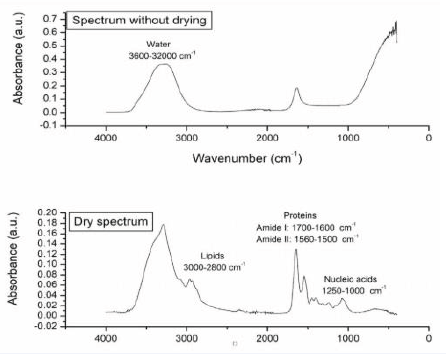
Figure 7: FTIR spectra for healthy and COVID-19-infected patients
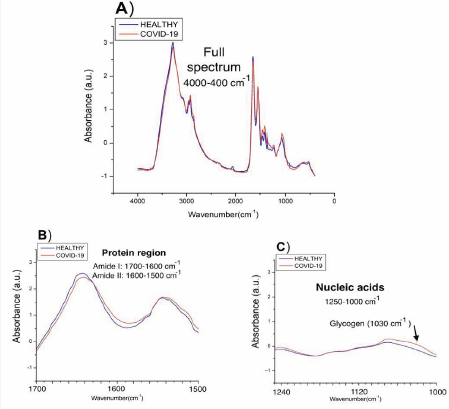
Figure 8: FTIR spectra for healthy and COVID-19-infected patients
Another study comparing the outcomes of saliva and nasopharyngeal swabs was conducted [55]. The diagnostic sensitivity for saliva NAAT (Nasopharyngeal swab nucleic acid amplification testing) was determined to be roughly 83.2% (95% CrI (credible interval), 74.7%-91.4%), which is similar to the results of our latent class model analysis (84.8%; 95% CrI, 76.8%-92.4%) and the nasopharyngeal swab NAAT [56]. Saliva should be the first sample chosen by testing facilities due to its ease of collection and improved patient comfort, particularly in community mass screening programs.
When it comes to detecting SARS-CoV-2 infections in patients who present later in the clinical course, saliva testing is perfect for large-scale, routine screening programs when sample collection logistics and supply
constraints represent a considerable capacity strain [57].
Blood samples from 47 COVID-infected patients collected in the first, third, and sixth months following the identification of COVID-19 infection were studied comparatively [58]. Two spectroscopy techniques, FTIR
and Raman, were utilized to distinguish between COVID patients with varying antibody levels. Neural network, machine learning, and multivariate analytic techniques were used to examine the spectroscopy data. It was
demonstrated that by utilizing spectrum biomarkers of amides II and I, serum examination performed with the aforementioned spectroscopic techniques may distinguish antibody levels between one and six months.
The serum FTIR spectra obtained from patients at various time points following COVID-19 are displayed in Figure 9.
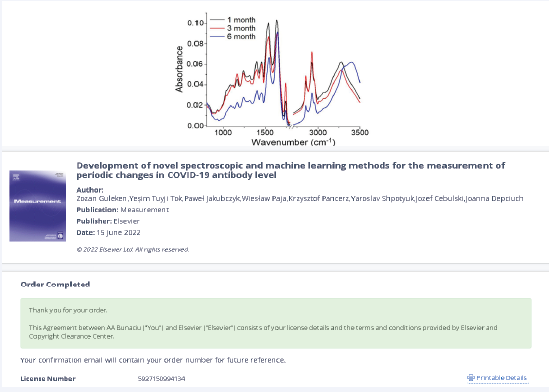
Figure 9: FTIR spectra of serum collected from patients 1, 3, and 6 months after COVID-19 infection
When the three examined groups were compared, it became clear that group III had the lowest absorbance of all the functional groups that had been reported in the serum’s FTIR spectra, and this was six months following COVID-19. Patients 3 months after COVID-19 (group II), showed the maximum absorbance of C–O–H groups from carbs and C–O, CH2, and CH3 from lipids, while patients one
month after COVID-19 (group I), showed a slightly lower absorbance in the spectrum.
The study and results obtained show that FTIR and Raman spectroscopy have great promise as novel diagnostic techniques for differentiating SARS-CoV-2antibody levels at various time points following COVID-19 infection in patients.
Consider using a quick COVID-19 breath test instead of swabbing your nose. Since the pandemic started, finding chemical indicators of SARS-CoV-2 infection in exhaled breath has been a priority. The US Food and Drug Administration (FDA) announced the first emergency use authorization (EUA) for a COVID-19 breath test [59]. Based on study data submitted to the FDA, InspectIR Systems’ COVID-19 Breathalyzer has a sensitivity and specificity that can compete with the gold standard, PCR tests..
As a quick and non-invasive method of COVID-19 detection, breath analysis has demonstrated promising results. By analyzing carbonyl compounds in breath, a study was conducted to identify patients who were infected with SARS-CoV-2 and even to screen for distinct SARS-CoV-2 variants [60]. The carbonyl compounds seen in exhaled breath are metabolites linked to oxidative stress and inflammation brought on by illnesses. The research results demonstrate that carbonyl compounds in exhaled Of course, FTIR spectroscopy was tested with good results in the detection of COVID-19 infections. To determine volatile organic compounds (VOCs), in exhaled breath that may be used at point-of-care (POC), settings, researchers have proposed new analytical technologies such as gas-phase infrared spectroscopy (IR), that are sensitive, specific, portable, and affordable [63] (Figure 10).
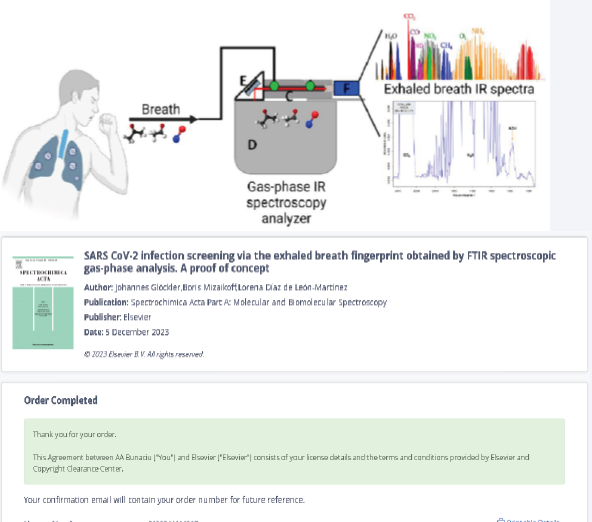
Figure 10: The FTIR spectra for a breath infrared analysis of patients with COVID-19 virus infection
It was demonstrated that a unique approach of using a panel of thirty-four carbonyl compounds detected in all exhaled breath samples for detection of COVID-19 can be used for differentiation of the Alpha from Delta variant and detection of asymptomatic COVID-19 infection [60]. Carbonyls are an organic molecule class derived from lipid oxidation [64], and are essential for many biological processes, including oxidative stress and inflammation, which are dramatically triggered by SARS-CoV-2 infection [65].
The most often detected VOCs in the exhaled breath of people infected with COVID-19 include nitric oxide, alcohols, aldehydes, and ketones [63]. As for acetaldehyde, a recent investigation using GC-MS found that patients with COVID-19 had simultaneous increases in acetaldehyde and acetone in their exhaled breath [66]. Additionally, acetaldehyde, propanal, and n-propyl acetate abundances in the exhaled breath of children infected with COVID-19 were found to rise during acute infection and fall as the illness subsided, according to another study [62].
CONCLUSIONS
FTIR spectroscopy represents a promising potential for mass testing since it is reagent-free, fast, and provides strong prediction performances. The obtained data and analysis demonstrate the great potential of FTIR spectroscopy as a novel diagnostic technique for differentiating SARS-CoV-2 antibody levels at various time points following COVID-19 infection in patients.
Even though the standard method of identification of COVID-19 remains RT-PCR, infrared spectroscopy can serve as an assistant diagnosis tool as a supplement to inuse techniques. The feasibility of other common specimens such as saliva, serum, and nasopharyngeal swabs, identification and interpretation of the spectral markers, the potential of FTIR spectroscopy on antibody responsemonitoring, and COVID-19 severity prediction require further investigations.
Infrared spectroscopy methods proposed are logistically easier to perform, rapid, and minimize the risk of transmission to health workers. Furthermore, selfcollection of saliva would reduce patient discomfort and
improve community participation rates in testing. The infrared technique is eminently suited to the analysis of body fluids samples because it requires no additional reagents or consumables, is very rapid (less than 5 min
to record spectra from three replicate samples and do the computation), the sample dries to a homogenous deposit, and the data can be directly transferred to a machine learning model for diagnosis.
One promising technology for quick, real-time COVID-19 triaging is ATR-FTIR. Clinical laboratory staff can readily perform the straightforward sample preparation and spectral acquisition method developed here. Clinical
decision making could be aided by the quick delivery of results from the multivariate prediction model created in this work, which could be used on the same data collecting machine.
The spectroscopic techniques proposed were the fastest of all the methods, allowing the viral content to be detected in just two minutes. The methods’ accuracy was determined to be around 90%. Because it doesn’t call
for any further steps or reagents, these methods can also be used to test people on-site. This technique’s LOD was comparatively low (1582 copies/mL).
DECLARATIONS
Data Availability Statement
The data that support the findings of this study are available from the corresponding author upon reasonable
request.
Author Contribution
Andrei A. Bunaciu contributed to the conceptualization, methodology, sampling, sample analysis, and writing the original draft. Hassan Y. Aboul Enein contributed to data curation, supervision, writing-reviewing, and editing.
REFERENCES
- Organization WH. WHO COVID-19 dashboard. 2024.
- Chan JF, Lau SK, To KK, Cheng VC, Woo PC, Yuen KY. Middle East respiratory syndrome coronavirus: another zoonotic betacoronavirus causing SARS-like disease. Clin Microbiol Rev. 2015; 28: 465-522.
- Forni D, Cagliani R, Clerici M, Sironi M. Molecular Evolution of Human Coronavirus Genomes. Trends Microbiol. 2017; 25: 35-48.
- Ma L, Zeng F, Cong F, Huang B, Huang R, Ma J, et al. Development of a SYBR green-based real-time RT-PCR assay for rapid detection of the emerging swine acute diarrhea syndrome coronavirus. J Virol Methods. 2019; 265: 66-70.
- He J, Tao H, Yan Y, Huang SY, Xiao Y. Molecular Mechanism of Evolution and Human Infection with SARS-CoV-2. Viruses. 2020; 12: 428.
- Yan R, Zhang Y, Li Y, Xia L, Guo Y, Zhou Q. Structural basis for the recognition of SARS-CoV-2 by full-length human ACE2. 2020; 367: 1444-1448.
- Spackman E, Senne DA, Myers TJ, Bulaga LL, Garber LP, Perdue ML, et al. Development of a real-time reverse transcriptase PCR assay for type A influenza virus and the avian H5 and H7 hemagglutinin subtypes. J Clin Microbiol. 2002; 40: 3256-3260.
- Wang L, Wang Y, Ye D, Liu Q. Review of the 2019 novel coronavirus (SARS-CoV-2) based on current evidence. Int J Antimicrob Agents. 2020; 55:105948.
- Hashempur MH, Hashempour MM, Mosavat SH, Heydari M. Rhazes- His Life and Contributions to the Field of Dermatology. JAMA Dermatol. 2017; 153: 70.
- Riedel S. Edward Jenner and the history of smallpox and vaccination.Proceedings (Baylor University Medical Center). 2005; 18: 21-5.
- Berche P. Louis Pasteur, from crystals of life to vaccination. ClinMicrobiol Infect. 2012; 18: 1-6.
- Burrell CJ, Howard CR, Murphy FA. History and Impact of Virology: Fenner and White’s Medical Virology. 2017: 3-14.
- Shereen MA, Khan S, Kazmi A, Bashir N, Siddique R. COVID-19 infection: Emergence, transmission, and characteristics of human coronaviruses. J Adv Res. 2020; 24: 91-98.
- Peiris JS, Guan Y, Yuen KY. Severe acute respiratory syndrome. NatMed. 2005; 10: S88-97.
- Fathi Karkan S, Maleki Baladi R, Shahgolzari M, Gholizadeh M, Shayegh F, Arashkia A. The evolving direct and indirect platforms for the detection of SARS-CoV-2. J Virol Methods. 2022; 300: 114381.
- Guo J, Ge J, Guo Y. Recent advances in methods for the diagnosis of Corona Virus Disease 2019. J Clin Lab Anal 2022; 36: e24178.
- Sheridan C. Coronavirus and the race to distribute reliable diagnostics. Nature Biotechnol. 2020; 38: 382-384.
- Roy S, Perez-Guaita D, Andrew DW, Richards JS, McNaughton D, Heraud P, et al. Simultaneous ATR-FTIR Based Determination of Malaria Parasitemia, Glucose and Urea in Whole Blood Dried onto a Glass Slide. Anal Chem. 2017; 89: 5238-5245.
- Barauna VG, Singh MN, Barbosa LL, Marcarini WD, Vassallo PF, Mill JG, et al. Ultrarapid On-Site Detection of SARS-CoV-2 Infection Using Simple ATR-FTIR Spectroscopy and an Analysis Algorithm: High Sensitivity and Specificity. Anal Chem. 2021; 93: 2950-2958.
- Wood BR, Kochan K, Bedolla DE, Salazar-Quiroz N, Grimley SL, Perez- Guaita D, et al. Infrared Based Saliva Screening Test for COVID-19. Angew Chem Int Ed Engl. 2021; 60: 17102-17107.
- Roy S, Perez-Guaita D, Bowden S, Heraud P, Wood BR. Spectroscopy goes viral: Diagnosis of hepatitis B and C virus infection from human sera using ATR-FTIR spectroscopy. Clin Spectroscopy. 2019; 1: 100001.
- Bunaciu AA, Aboul-Enein HY. Determination of COVID-19 viruses in saliva using Fourier transform infrared spectroscopy. Chin J Anal Chem. 2022; 50: 100178.
- Cagnani GR, Macedo LJA, da Costa Oliveira T, Crespilho FN. Fourier- Transform Infrared Spectroscopy and Spectromicroscopy Studies for Diagnosis of Covid-19 Infection. In: Crespilho FN, editor. Covid-19 Metabolomics and Diagnosis: Cham: Springer Nature Switzerland. 2023; 2: 1-14.
- Zhang Q, Zhao L, Qi G, Zhang X, Tian C. Raman and fourier transform infrared spectroscopy techniques for detection of coronavirus (COVID-19): a mini review. Front Chem. 2023; 11: 1193030.
- Raypah ME, Faris AN, Mohd Azlan M, Yusof NY, Suhailin FH, Shueb RH, et al. Near-Infrared Spectroscopy as a Potential COVID-19 Early Detection Method: A Review and Future Perspective. Sensors (Basel). 2022; 22: 4391.
- Mollarasouli F, Zare-Shehneh N, Ghaedi M. A review on corona virus disease 2019 (COVID-19): current progress, clinical features and bioanalytical diagnostic methods. Mikrochim Acta. 2022; 189: 103.
- Filchakova O, Dossym D, Ilyas A, Kuanysheva T, Abdizhamil A, Bukasov RJT. Review of COVID-19 testing and diagnostic methods. Talanta. 2022; 244: 123409.
- Ustao?lu ?G, Kaygusuz H, Bilgin MD, Severcan F. Novel approaches for COVID-19 diagnosis and treatment: a nonsystematic review. Turk J Biol. 2021; 45: 358-371.
- Naseer K, Ali S, Qazi J. ATR-FTIR spectroscopy as the future of diagnostics: a systematic review of the approach using biofluids. Appl Spectr Rev. 2020; 56: 85-97.
- Ilkhani H, Hedayat N, Farhad S. Novel approaches for rapid detection of COVID-19 during the pandemic: A review. Anal Biochem. 2021; 634: 114362.
- Chavda VP, Vuppu S, Mishra T, Kamaraj S, Patel AB, Sharma N, et al. Recent review of COVID-19 management: diagnosis, treatment and vaccination. Pharmacol Rep. 2022; 74: 1120-1148.
- Guenduez AA, Walker N. A Literature Review of Covid-19 Research: Taking Stock and Moving Forward. Int J Public Administration. 2025; 48: 1-17.
- Derruau S, Robinet J, Untereiner V, Piot O, Sockalingum GD, LorimierS. Vibrational Spectroscopy Saliva Profiling as Biometric Tool for Disease Diagnostics: A Systematic Literature. Molecules. 2020; 25: 4142.
- Zhang L, Xiao M, Wang Y, Peng S, Chen Y, Zhang D, et al. Fast Screening and Primary Diagnosis of COVID-19 by ATR-FT-IR. Anal Chem. 2021; 93: 2191-9.
- Long Q-X, Liu B-Z, Deng H-J, Wu G-C, Deng K, Chen Y-K, et al. Antibody responses to SARS-CoV-2 in patients with COVID-19. Nat Med. 2020; 26: 845-848.
- Banerjee A, Gokhale A, Bankar R, Palanivel V, Salkar A, Robinson H, et al. Rapid Classification of COVID-19 Severity by ATR-FTIR Spectroscopy of Plasma Samples. Anal Chem. 2021; 93: 10391-10396.
- Butler PA, Gaffney LP, Spagnoletti P, Konki J, Scheck M, Smith JF, et al. The observation of vibrating pear-shapes in radon nuclei. Nat Commun. 2019; 10: 2473.
- Gajjar K, Trevisan J, Owens G, Keating PJ, Wood NJ, Stringfellow HF, et al. Fourier-transform infrared spectroscopy coupled with a classification machine for the analysis of blood plasma or serum: a novel diagnostic approach for ovarian cancer. Analyst. 2013; 138: 3917-3926.
- Guleken Z, Jakubczyk P, Wieslaw P, Krzysztof P, Bulut H, Oten E, et al. Characterization of Covid-19 infected pregnant women sera using laboratory indexes, vibrational spectroscopy, and machine learning classifications. Talanta. 2022; 237: 122916.
- Bujok J, G?sior-G?ogowska M, Marsza?ek M, Trochanowska-Pauk N, Zigo F, Pav?ak A, et al. Applicability of FTIR-ATR Method to Measure Carbonyls in Blood Plasma after Physical and Mental Stress. BioMed Res Int. 2019; 2019: 2181370.
- Simmons G, Reeves JD, Grogan CC, Vandenberghe LH, Baribaud F, Whitbeck JC, et al. DC-SIGN and DC-SIGNR Bind Ebola Glycoproteins and Enhance Infection of Macrophages and Endothelial Cells. Virol. 2003; 305: 115-123.
- Butler DL, Gildersleeve JC. Abnormal antibodies to self-carbohydrates in SARS-CoV-2 infected patients. Bio Rxiv. 2020; 2020; 10; 15:341479.
- Heino H, Rieppo L, Männistö T, Sillanpää MJ, Mäntynen V, SaarakkalaS. Diagnostic performance of attenuated total reflection Fourier- transform infrared spectroscopy for detecting COVID-19 from routine nasopharyngeal swab samples. Sci Rep. 2022; 12: 20358.
- Kitane DL, Loukman S, Marchoudi N, Fernandez-Galiana A, El Ansari FZ, Jouali F, et al. A simple and fast spectroscopy-based technique for Covid-19 diagnosis. Sci Rep. 2021; 11: 16740.


