QSAR Analysis of Tipifarnib Analogues for Anti-Chagas Disease
- 1. Department of Chemistry, DBF Dayanand College of Arts & Science, India
- 2. Department of Chemistry, RDIK and NKD College, Badnera-Amravati, Maharashtra, India
- 3. Department of Chemistry, Vidya Bharati Mahavidyalaya, Amravati 444602, Maharashtra, India
- 4. Department of Chemistry, Government Polytechnic College, India
- 5. Sangameshwar College, India
Abstract
The cancer drug trial candidate Tipifarnib and its derivatives were subjected to a thorough QSAR analysis in the current study for the undertreated disease anti-Chagas. The study was effective in identifying the crucial structural elements that regulate the anti-Chagas profile of tipifarnib derivatives as a potential treatment. The genetic algorithm-multilinear regression (GA-MLR) method was used to create many models employing multiple splits in order to determine the greatest number and set of significant molecular descriptors. The created QSAR models have R2 > 0.85, Q2 > 0.82, and R2ext > 0.90, making them tri-parametric and statistically robust. The models are both internally and externally predictively strong. The models show a correlation between nitrogen’s interaction with lipophilic atoms and the anti-Chagas activity of tipifarnib analogues.
Keywords
• QSAR
• Tipifarnib
• Anti-Chagas Disease
• Drug Designing
CITATION
Gawali R, Thakur S, Masand VH, Phadatare R, Diwate A (2023) QSAR Analysis of Tipifarnib Analogues for Anti-Chagas Disease. J Drug Des Res 10(1): 1093.
ABBREVIATIONS
QSAR = Quantitative Structure-Activity Relationship; GA MLR= Genetic Algorithm-Multilinear Regression; CYP51 = Cytochrome P450 51; ADMET = Absorption; Distribution; Metabolism; Excretion; and Toxicity; EC50 = Median Effective Concentration; pEC50 = negative logarithm of the EC50 ; OECD = Organisation for Economic Co-operation and Development; GA = Genetic Algorithm; CV = Cross-validation; LOO = Leave-one-out; LMO = Leave-many-out; AD = Applicability Domain; FSM = Full Set Model; RMSE = Root Mean Square Error ; MAE = Maximal Absolute Error; MSA = Molecular Surface Area
INTRODUCTION
Chagas disease commonly spread by contact with an infected triatomine bug also known as “Kissing bug,” “Benchuca,” “Vinchuca,” “Chinche,” or “Barbeiro,” is one of the most underdiagnosed parasitic diseases that can lead to life threatening cardiac and stomach conditions [1]. It is often communicated through contact with an infected triatomine bug. Each year, the disease affects about ten million individuals, with the majority of cases concentrated in tropical areas like Africa and Latin America [2]. The protozoan parasite Trypanosoma cruzi (T. cruzi), a kinetoplastid hemoflagellate, is the cause of Chagas disease. Because there is no effective treatment available during the chronic stage of the illness, those who have been infected typically become a permanent host to the parasite. Nitrofuran, nifurtimox, benznidazole, and nitroimidazole are only a few of the very toxic medications that are commonly used in chemotherapy. The situation has worsened with the advent of resistance against nifurtimox [1,3-7]. Therefore, search for a new therapeutic agent or modification of existing one to curb Chagas disease is essential [8,9].
T. cruzi was recently discovered to be successfully inhibited by tipifarnib, a well-known anti-cancer drug created by Johnson & Johnson Pharmaceuticals [1]. The inhibition of endogenous sterol biosynthesis and binding to recombinant T. cruzi CYP51 provided further evidence that the target enzyme, CYP51, was implicated in the mechanism of bio-action in T. cruzi. T. cruzi amastigotes, which are the stage of the parasite’s life cycle that develop in mammalian host cells, use ergosterol as a crucial component in the creation of their membranes because they are unable to utilise cholesterol from the host cells. It is a desirable lead molecule due to a number of benefits including excellent oral bioavailability, acceptable pharmacokinetic characteristics, and good human tolerance. But because tipifarnib has a chiral centre, it can exist in two stable isomeric forms [1]. Therefore, choosing a therapeutic candidate would require a separate examination of the pharmacokinetic and toxicity characteristics of both molecules. Additionally, it binds to the human protein farnesyl transferase, which poses a hazardous problem for the use of tipifarnib as a T. cruzi inhibitor. To increase its potential as a drug candidate against T. cruzi, these problems must be resolved. Tipifarnib needs to be further optimized in order to remain a potent T. cruzi inhibitor with the appropriate ADMET profile. In order to continue the optimization, it would be appealing to create QSAR (Quantitative structure-activity relationship) models using the data that is now available for the detection of lead/drug similarity properties. For the purpose of identifying the pharmacophoric patterns and structural characteristics that control the bio-activity profile of congeneric series of compounds, QSAR is a well-known chemometric approach [10-14]. It is a ligand-based approach to drug design that heavily relies on mathematical, statistical, and algorithmic techniques combined with computer science. For example, risk assessment, toxicity prediction, and drug/lead optimisation have all been successful uses of QSAR [15-18].
In the current study, a thorough QSAR analysis was conducted to identify the structural characteristics that control tipifarnib and its analogues’ anti-Chagas action.
Experimental methodology
Data set: The data set includes 33 Tipifarnib analogues with various substituents at various locations [1]. The electron donating/-withdrawing groups in the substituents cause a positive alteration in the molecules’ steric and electrostatic profiles (Table 1, Figure 1).
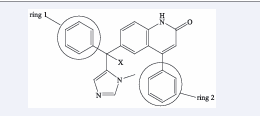
Figure 1: Tipifarnib analogues with a variety of substituents at different positions
The T. cruzi amastigote was used to test the Tipifarnib analogues. Prior to QSAR analysis, the EC50 (nM) values were transformed to pEC50 (M) values [16,17]. Table 1 lists the structures, EC50 (nM), and pEC50 (M).
QSAR methodology
The standard methodology and guidelines recommended and put into practise by many researchers and the OECD (Organisation for Economic Co-operation and Development) have been followed in the current work for successful QSAR analysis [10-12, 18-20]. The structures were created using the free ChemSketch 10 software, and then the energy consumption was reduced using TINKER and MMFF94 (Cut-off: 0.01). Then, a large number of descriptors were calculated using PowerMV, CDK and PADEL, PyDescriptor (a custom PyMOL plugin), and e-Dragon. More than 29,000 different 1D- to 3D -descriptors are included in the descriptor pool. After removing the constant, almost constant, highly correlated (|R| > 0.80), and redundant variables using objective feature selection in QSARINS 2.2.4 using default settings [21], Weka’s genetic algorithm (GA) was used to conduct a heuristic search for selecting subjective features using default settings, except number of generations =10000 and number of features = 3. The data set was split into training (80%) and prediction (20%) sets at random for external validation before feature (descriptor) selection [18]. To obtain the most information possible, numerous splittings were used to generate multiple models.
Validation of the model: Effective QSAR model creation requires model validation. Therefore, for the purpose of model validation, OECD rules and suggested threshold values for a number of statistical parameters were used. The following characteristics were often taken into account: Using the prediction set, data randomization, or Y-scrambling, cross-validation (CV) via leave-one-out (LOO) and leave-many-out (LMO) procedures, and (d) determining whether the following requirements are met [16-19]: R2 tr ≥ 0.6, Q2 loo ≥ 0.5, Q2 LMO ≥ 0.6, R2 > Q2, R2 ex ≥ 0.6, RMSEtr < RMSEcv , ΔK ≥ 0.05, CCC ≥ 0.80, Q2-Fn ≥ 0.60, r2 m ≥ 0.6, (1-r2/ro 2) < 0.1, 0.9 ≤ k ≤ 1.1 or (1-r2/r’o 2) < 0.1, 0.9 ≤ k’ ≤ 1.1,| ro 2− r’o 2| < 0.3 with RMSE and MAE close to zero. Any model not satisfying these criteria were subsequently rejected.
Applicability Domain (AD): AD assessment of a QSAR model is essential criterion for QSAR model development. In the present work, Williams plot have been plotted to assess the AD of the developed model. QSARINS-Chem 2.2.1 was used for getting the Williams plot using the default setting [11-14].
RESULTS AND DISCUSSION
Our team recently demonstrated that using multiple modelling to capture less-privileged chemical characteristics is a wise decision. Therefore, to ensure the capture of dominant and less prominent structural features that influence the bio-activity of PBIs, the same stated technique has been applied in the current study. As a result, various QSAR models were created utilising both the entire data set (referred to in the present study as the full set model, or FSM) and the divided data set (80% training and 20% prediction sets). The data set was randomly divided before model building when employing a divided data set to prevent developer bias in choosing the training and prediction sets. One model’s prediction set for a chemical might or might not include it. QSARINS-Chem 2.2.1 was operating with the default parameters for OFS and SFS. The heuristic search for variables was restricted for simplicity to a collection of only three descriptors. There was no appreciable improvement in the statistical quality of the model after three variables. The following are the statistical parameters for the tri-parametric GA-MLR models:
Model-1 (FSM) pEC50 = 20.013 (± 3.350) + 3.285 (± 1.131) * O_don_8Ac – 0.563 (± 0.249) * N_lipo_5B − 0.009 (± 0.003) * QXXm
Ntr = 33, Q2 loo = 0.823, R2 tr = 0.865, R2 adj = 0.851, Kxx = 0.310, ΔK = 0.203, RMSEtr = 0.315, RMSEcv = 0.358, s = 0.336, F = 61.714, CCCtr = 0.927, CCCcv = 0.906, MAEtr = 0.264, MAEcv = 0.301, Q2 LMO = 0.820
Model-2 (Divided data set) pEC50 = 20.993 (± 3.988) – 0.095 (± 0.044) * da_H_9B – 0.540 (± 0.289) * N_lipo_5B − 0.010 (± 0.003) * QXXm
Ntr = 27, Nex = 6, Q2 loo = 0.831, R2 tr = 0.870, R2 adj = 0.853, Kxx = 0.303, ΔK = 0.202, RMSEtr = 0.306, RMSEcv = 0.348, RMSEex = 0.394, s = 0.331, F = 51.151, Q2-F1 = 0.809, Q2-F2 = 0. 0.801, Q2-F3 = 0.783, CCCtr = 0.930, CCCcv = 0.909, CCCex = 0.897, r2m av = 0.794, r2m de = 0.093, MAEtr = 0.249, MAEcv = 0.288, MAEex = 0.338, R2 ext = 0.918, Q2 LMO = 0.811
Model-3 (Divided data set) pEC50 = 35.716 (± 9.621) – 0.319 (± 0.182) * accminus_MSA – 0.690 (± 0.261) * N_lipo_5B − 0.010 (± 0.003) * QXXm
Ntr = 27, Nex = 6, Q2 loo = 0.837, R2 tr = 0.870, R2 adj = 0.853, Kxx = 0.470, ΔK = 0.077, RMSEtr = 0.291, RMSEcv = 0.325, RMSEex = 0.451, s = 0.315, F = 51.403, Q2-F1 = 0.826, Q2-F2 = 0. 0.756, Q2-F3 = 0.688, CCCtr = 0.931, CCCcv = 0.913, CCCex = 0.885, r2m av = 0.698, r2m de = 0.069, MAEtr = 0.243, MAEcv = 0.280, MAEex = 0.373, R2 ext = 0.786, Q2 LMO = 0.794
The statistical symbols have their typical meanings, which are also provided in the accompanying data. Table 2 displays the pEC50 values as well as the descriptor values that were employed. Based on the statistical characteristics, it appears that the produced models have good internal fitting and meet the cutoff values for a number of statistical parameters that are crucial for determining internal resilience and external predictability. The models’ strong external prediction capacity is indicated by the high value of several external validation parameters, including CCCex, Q2-Fn, R2ext, etc., and the low values of RMSE, s, and MAE, etc. An adequate number of descriptors are present in the model, according to the close value of R2adj. And R2. Similar to how similar R2 and Q2 values indicate that the models do not exhibit over-fitting. The low value of RMSE and MAE (fitting, cross validation and external validation) specifies that the developed models have statistical acceptability.
DISCUSSION
In the developed models, the common descriptor is QXXm, which is a geometrical descriptor and corresponds to COMMA2 value/weighted by atomic masses activity, has negative correlation with the activity. Therefore, its value must be kept as low as possible to enhance the activity. The second common descriptor N_lipo_5B (number of lipophilic atoms within five bonds from Nitrogen atoms) has negative coefficient in all the developed models. Hence, the value of this descriptors must be restricted for enhanced activity. da_H_9B corresponds to number of Hydrogen atoms within nine bonds from such a group which can act as H-bond donor as well as acceptor such as -OH, -NH2 , etc. the negative coefficient for this descriptor in model 2 indicates that lowering the value of this descriptor would result in better activity profile.
A molecular descriptor with negative coefficient in model 3 is accminus_MSA (molecular surface area of negatively charged H-bond acceptor atoms). Therefore, the molecular surface area of negatively charged H-bond acceptor atoms must be constrained to increase the anti-Chagas activity. The molecular descriptors accminus_MSA, N_lipo_5B and da_H_9B have been depicted in Figure 2 using the most and least active molecules (molecule number 16 and 32), as the representatives only.
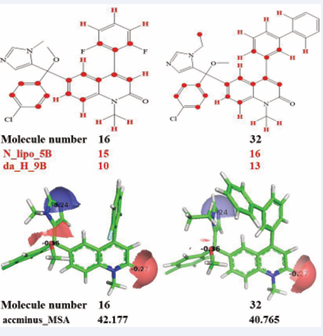
Figure 2: Representation of accminus_MSA, N_lipo_5B and da_H_9B using molecule number 16 (most active) and 32 (least active) as the representatives only (red filled circles for N_lipo_5B and red coloured hydrogen atoms for da_H_9B).
The only molecular descriptor with a positive coefficient in model 1 is O_don_8Ac, which stands for sum of partial charges on H-bond donor atoms which are present within 8Å from oxygen atoms. In case of compound number 2, 3 and 26 the oxygen atom of -OMe group (with lesser negative charge) is within a distance of 8Å from oxygen atom of quinolinone moiety. Whereas for compound number 20, 19 and 27, though, the oxygen atom of -OH group is within a distance of 8Å from oxygen atom of quinolinone moiety but possesses a higher negative charge. This could be one of the possible reasons for better activity of 2 (EC50 = 0.6 nM) than 20 (EC50 = 112 nM), 3 (EC50 = 3.1 nM) than 19 (EC50 = 17 nM), and 26 (EC50 = 3 nM) than 27 (EC50 = 228 nM). This points out another observation that -OMe is a better substituent at -X than -OH for increasing the activity.
In Table 3, the status of the molecule, predicted and the residual values by developed models 1-3 have been tabulated.
The fitting curve, residual plot, Y-scrambling and Williams plots are available in the supporting information.
CONCLUSIONS
In conclusion, the robust QSAR models with good predictive ability indicate that activity has good relation with -OCH3 group, lipophilic atoms within five bonds from Nitrogen atoms, presence of less negatively charged donor atom from oxygen atom of quinolinone ring and molecular surface area of negatively charged H-bond acceptor atoms.
AUTHOR CONTRIBUTIONS
R.G. and S.T.: conceptualization, project design, and experimental studies; R.G., S.T. and V.H.M.: drafting, resources, and funding management; R.G., S.T. and R.P.: data collection and curation, drafting, and data compilation; R.G., V.H.M. and R.P.: draft revision and analysis. All authors have read and agreed to the published version of the manuscript.
ACKNOWLEDGMENTS
Authors are grateful to Dr. Paola Gramatica and QSARINS developing team for providing QSARINS.
REFERENCES
2. Technical report of the TDR disesase reference group on Chagas Disease, Human African Trypanosomiasis and Leishmaniasis; World Health Organisation.
3. McKerrow JH, Doyle PS, Engel JC, Podust LM, Robertson SA, Ferreira R, et al. Two approaches to discovering and developing new drugs for Chagas disease. Mem Inst Oswaldo Cruz. 2009; 104: 263-269.
10. Gramatica P. On the development and validation of QSAR models. Methods Mol Biol. 2013; 930: 499-526.


