Statistical Control of the Production of Blood Components: Use of Process Capability Indexe
- 1. Portuguese Institute of Blood and Transplantation, R&D Department, Portugal
- 2. International Consultancy in Blood Components Quality/Safety Improvement, UK
Abstract
Controlling the production of blood components is required by regulations such as the European and North American. All production processes have a predictable error under stable conditions. This error is recognized as an expected error. When special causes influence this error, it can be significant. Capability indexes allow measuring production performance by ranking it. When special causes are involved, these indexes suggest production instability. In this situation, taking action is required to return the process conditions to stability. The article introduces a series of capability indices. It discusses, in some depth, their mathematical models as well as their classification levels. A statistical technique for the control of blood component production is suggested.
Citation
Pereira P, Seghatchian J (2021) Statistical Control of the Production of Blood Components: Use of Process Capability Indexes. J Hematol Transfus 8(2): 1097.
Keywords
• Assessment
• Blood bank
• Capability
• Manufacturing
• Sigma
INTRODUCTION
Control of the production of blood components is required in the European Union [1] in the United States for blood banks and transfusion services [2]. The “Guide to the Preparation, Use and Quality Assurance of Blood Components” [3] include in Annex 4 a statistical process control (SPC) methodology. It suggests some practices, such as schemes for statistical sampling, control sampling frequency, and a set of cases. It is suggested to use graphs, statistical scanning methods, and statistical process control for dichotomous results.
All production processes have an expected error caused by common / natural / expected error sources. When it is significant, it is assumed that there are special causes of error [4].
Monitoring and improvement should not focus solely on the expected causes of uncertainty. They should also include tools that allow detecting minor problems but with an enormous impact on manufacturing. These failures affect not only product or service compliance but budget as well. Production is “acceptable” based on criteria, as in other industrial fields.
Two statistical measures of central tendency are proposed: random error (2.19 of [5]) and systematic error (2.17 of [5]). Whenever a normal distribution is not available, for example, with a number of samples less than or equal to 30, data transformation or an attribute approach as an alternative to a variable method is suggested.
Specification limits are selected according to requirements, e.g., legal applicable to blood components.
Often a sampling control is used. If you control lots without statistical sampling, the control is only valid for tested samples. In this case, the control is only on the tested samples and not on the production. Each sample should have an equal chance of being selected to be representative with a certain margin of confidence [6-7].
Statistical Process Control (SPC) uses charts to monitor product or batch data performance through sampling techniques. Control charts include limits so that you can identify whether the process is operating within or outside the limits. Out-of-bounds events have a significant probability of being associated with special causes of error.
The evidence-based SPC. It allows improving the performance of production batches, which allows the systematic delivery of a compliant production. An in-depth discussion of variable and attribute maps is published in [7-8].
Capability indexes measure the level of production performance. Allow to classify it and the possible taking of actions. A process under control may not meet specifications or vice versa. Note that individual sample results are checked against specifications, legal or internal, and not control limits. For example, specifications published by EDQM suggest the acceptance / rejection of whole blood or its derivatives.
Different statistical models for determining the capability indexes are briefly discussed. A statistical technique for manufacturing blood components is suggested.
MATERIAL AND METHODS
Process capability index
ˆ Index:
a) Mathematical model: Process capability indexes rank the ability of a process under control to meet goals. They should only be applied to stable / controlled processes. The indexes tell you how often the process meets specifications. It is determined original using ˆCp what is determined by the model:
where USL is the specified upper limit, LSL is the specified lower limit and is the estimated process variability (within standard deviation limits). As the standard deviation is skewed, σˆ is more accurate to determine if it is the result of dividing R for each rational subgroup by d2 , which is the statistical correlation coefficient selected according to the rational subgroups in the table of control charts constants for sigma estimation [9]. If an average and standard deviation chart is used, the division is similar, where R it is replaced by s and d2 by C4 (see table of control charts constants for sigma estimation).
b) Interpretation of levels: If ˆCp = 1, it indicates that the process variation only meets the specifications, that is, the production process of a specific blood component is minimally capable;
If ˆCp < 1, it indicates that the process variation is outside the specification range, that is, the process is not capable of producing a particular blood component within the specification and needs to be improved, and;
If ˆCp > 1, it indicates that the process variation is more restricted than the specifications and exceeds the minimum capability, i.e., the process is capable and current practices should be maintained.
Cpk Index:
a) Mathematical model: ˆCpk is another model for determining the capability index. It represents how centralized the data is between specification limits. To determine ˆCpk when a single-limit specification range is used, the upper specification limit or lower specification limit is determined , ˆCpk upper using the templates:
where µˆ is the mean of the production process andσˆ is the estimated variability of the process (within the standard deviation). ˆCpk is equal to the lower index. To determine ˆCpk when a specification range with double limits is used, the , upper ˆCpk and , lower ˆCpk is first determined. Then, the minimum index is selected:
where µˆ is the mean of the production process andσˆ is the estimated variability of the process (within the standard deviation). ˆCpk is equal to the lower index. To determine ˆCpk when a specification range with double limits is used, the , upper ˆCpk and , lower ˆCpk is first determined. Then, the minimum index is selected:
b) Interpretation of levels
If ˆCpk < 1, indicates that the process is inadequate, i.e., the process is not capable of producing reliable blood components;
If 1 ≤ ˆCpk < 1.33, indicates that the process is capable, rigorous quality control is required, i.e., the process produces a specific blood component that is minimally capable;
If 1.33 ≤ ˆCpk < 1.5, indicates that the process is someone, indicating that no severe quality control is required;
If 1.5 ≤ ˆCpk < 2, indicates that the process is excellent, no stringent quality control is required;
If ˆCpk ≥ 2, indicates that the process is super, minimal quality control is required.
Sigma metrics:
a) Mathematical model:
b) Interpretation of levels
6-sigma ( ˆCpk = 2) is classified as “world-class quality”;
5-sigma ( ˆCpk = 1.66) as the goal related to quality improvement;
4-sigma ( ˆCpk = 1.33) as the typical sigma level in the industry, and;
3-sigma ( ˆCpk = 1) as the minimum acceptable quality level.
Process performance index
Pp Index: Process performance indexes, ˆ Pp and ˆ Ppk , rank how well the data fits within the specification boundaries, and rank how centralized the data is within the specification boundaries. They should be used when total production is known, and the laboratory is testing the performance of a production method. Mathematical models differ in using standard deviation rather than an 2 R d/ or 4 s C/ ratio.
Pp is calculated using a model similar to ˆCp :
where USL is the specified upper limit, LSL is the specified lower limit, and s is the standard deviation of the overall results (general standard deviation).
Ppk Index
The calculation of ˆ Ppk is identical to ˆCpk , also differing in the use of s. It is determined using the models:
where x is the average of the production process. ˆ Ppk is equal to the lower index. To determine ˆ Ppk when a specification range with double limits is used, the , upper ˆ Ppk and , lower ˆ Ppk is first determined. Then the minimum index,
RESULTS
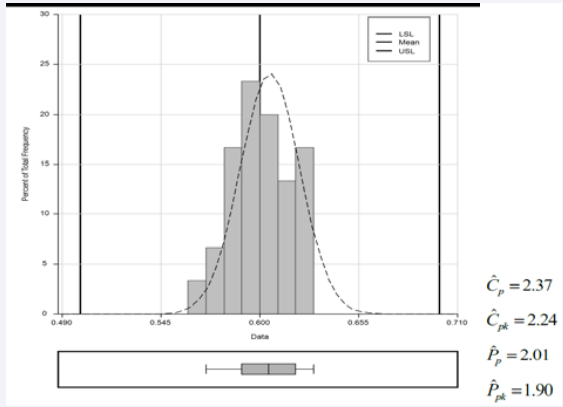
Figure 1 illustrates a process capability histogram with lower and upper specifications and a boxplot for hematocrit (ratio) in a sampling of 30 red cells, leucocyte depleted in additive solution components.
DISCUSSION
The ˆCp model is adapted from the Cp model as the sigma σ process is practically immeasurable and is replaced by a standard deviation estimate.
Cp classifies how the distribution of results fits within the specification limits. This index represents the relationship between the range of specification limits and the process range. There is no information if the process is within specifications. The value is always positive.
This can be interpreted as the index with the mean closest to the specification limit. The Cpk index is the ratio of the difference between the specification limit range (or vice versa) and the process mean for the process range. If the value is less than one, there are values out of specification. If the value is exactly zero, half of the values are out of specification.
Regularly, ˆCpk it is chosen ˆCp because it has a recognized limitation, assuming that the variability of the process is centered on the extent of the specification, which is not true in all cases. ˆCpk is statistically reliable in this condition. When a process is centered, ˆCp is equal to ˆCpk . Both indexes should never be estimated from a small number of samples, as the results are unrealistic due to the sampling not being statistically representative of the production. If the Cp index is greater than Cpk, the process is decentralized.
Like the ˆCp , ˆ Pp is not useful to identify in the process out of specification. The results for Pp and Cp differ because the standard deviation within the rational subgroup is less than 2 R d/ . Both have the same limitation on centralization, which no one considers. They can be uniquely determined when USL and LSL limits exist, so they cannot be applied to some of the parameters used to control the production of blood components.
The process performance index estimates the process capability of a manufacturing process during its initial setup before being placed into a state of statistical control. However, it can also be used with capability indexes, given the small samples taken in transfusion medicine services, but never as an alternative to these. In the examples ˆ Pp and ˆ Ppk , the indexes are not significantly different from ˆCp and ˆCpk . Larger values of Ppk can be interpreted to indicate that a process is more capable of producing an output within the specification limits, although this interpretation is not consensual. Statistically, Ppk is meaningless if the process under study is not in control because one cannot reliably estimate the underlying probability distribution process.
Figure 2 shows a set of examples where Ppk analysis is valuable to understand process capability better. Figures 2-a to d show a set of cases where the mean is around the centerline.
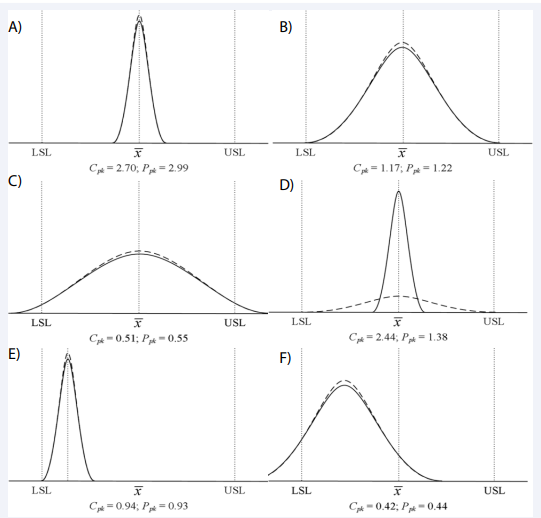
Figure 2 Four cases of process capability and performance indexes.
Figure 2-a illustrates a case where the process is super with Cpk and Ppk indexes greater than two. Figure 2-b shows an example of the process with Cpk and Ppk indexes between one and 1.33. Figure 2-c demonstrates the case of a process not capable due to the two lower indexes. Figure 2-d shows an example where according to Cpk the process is classified as super, but according to Ppk, the process is not capable. The difference is due to the standard deviation and general standard deviation computation models. The process should be carefully monitored through control charts and decision rules. Figure 2-e illustrates a case of centerline deviation with data with low variance (similar to the results of Figure 2-a standard deviation) with an insignificant difference between the estimates. Finally, Figure 2-f illustrates the case where the internal and overall standard deviations are close (identical to the estimates in Figure 2-b and less than one. Capability is influenced in this example by a shift in the centerline.
Figure 1 shows a manufacturing process histogram with lower and upper limits. ˆCpk of 2.24 indicates that the process is super, so minimal quality control is required. The ˆCpk index is in agreement with ˆCp , ˆ Pp , and ˆ Ppk favoring a statistically stable process.
Sigma represents the standard deviation number of a given process. A 3-sigma process has 2600 parts per million (ppm) defective and is recognized as the minimum capability index in production. A 6-sigma process has an exclusively 3.4 ppm defect. Consequently, a 6-sigma process has a lower chance of manufacturing products out of specification when compared to a 3-sigma process. Sigma can be calculated simply by multiplying Cpk by three, being analogous to the Cpk performance in Figure 2.
Consequently, the performance typically required is around 4 sigma. As can be seen, the ratings approach Cpk levels. The production of blood components has some parameters with performance higher than 6-sigma, equivalent to “world-class quality”. However, some never reach a high sigma level, mainly due to the biological variation of the tested parameters. For further details on the 6-sigma concept, see [10]. Typically, a manufacturing process is classified as “world-class quality” when the average results are “on target” with “minimal variation”. Working with “minimal variation” is only practicable when the process shows a reasonable degree of statistical control.
The difference between Cp and Pp and Cpk and Ppk is not significant if the distribution is normal and the process is under control since the difference between the internal standard deviation ( 2 R d/ ) and the general standard deviation it’s smaller. However, in cases with unnatural sources of variation, the Cpk index is greater than the Ppk. We suggest using it together with Cp and Cpk. The Cp and Cpk indexes should be close in the Pp and Ppk results. If Cp and Cpk are significantly higher than Pp or Ppk (minimum one-third higher), the process may not be stable enough to calculate capability ratings. In this case, the assessment of process stability is mainly done through graphs rather than process capability indexes, using a rigorous quality control strategy.
A strict corrective-action/preventive-action (CAPA) policy should be implemented, focusing on opportunities for improvement. These actions are critical for the continuous improvement of production processes.
In conclusion, the use of the Cpk or Sigma metric for production control is suggested. The use of the process performance index is only suggested as a complement to the Cpk or Sigma index. Furthermore, the approaches can be transposed to functions in spreadsheets, such as small transfusion medicine services. For more extensive services or those involving statistically complex techniques, it is suggested to use commercial software which can be found anywhere. Under certain conditions, the use of quality control/biostatistics consultancy can be recommended.
REFERENCES
- Commission Directive 2002/98/EC of the European Parliament and of the Council as regards setting standards of quality and safety for the collection, testing, processing, storage and distribution of human blood and blood components and amending Directive 2001/83/EC. Official Journal of the European Union L33/30-40.
- American Association of Blood Banks. Standards for blood banks and transfusion services. 32nd ed. Bethesda (MD): AABB. 2020.
- European Directorate for the Quality of Medicines and HealthCare. Guide to the preparation, use and quality assurance of blood components. 20th ed. Strasbourg: EDQM; 2020.
- Statistical quality control handbook. 2nd ed. Western Electric Company. 1958.
- Bureau International des Poids et Mesures. JCGM 200:2012 International vocabulary of metrology - Basic and general concepts and associated terms, 2008 version with minor corrections. BIPM; 2012.
- Pereira P, Seghatchian J, Caldeira B, Santos P, Castro R, et al. Sampling methods to the statistical control of the production of blood components. Transfus Apheresis Sci 2017; 56: 914-919.
- Pereira P, Seghatchian J, Caldeira B, Xavier S, Sousa G. Statistical methods to the control of the production of blood components: principles and control charts for variables. Transfus Apheresis Sci. 2018; 57: 132-142.
- Pereira P, Seghatchian J, Caldeira B, Xavier S, Sousa G. Statistical control of the production of blood components by control charts of attribute to improve quality characteristics and to comply with current specifications. Transfus Apheresis Sci. 2018; 57: 285-290.
- Table of Control Chart Constants. 2021.George, M. Lean
- 6-sigma: combining 6-sigma quality with Lean production speed. New York : The McGraw-Hill Companies. 2012.


