Relative Strength, Rate of Force Development, and Body Mass Ratios Correlate to Dynamic Sports Performance in Youth Athletes
- 1. Exsurgo Technologies, 20202 Incas Ter, Ashburn, VA 20147, USA
Abstract
Recreational youth athletes (n = 50) ages (14.58 years ± 3.1) were assessed to evaluate relationships between isometric strength, isometric rate of force development, total body mass and dynamic sports performance assessments. Athletes performed isometric mid-thigh pull, counter-movement jump, drop jump, 20 meter sprint with a 10m split gate as well as the 5-10-5 agility shuttle. Relative Strength Ratios (RSR), Relative Rate of Force Development ratios (RRFD) and isometric rate of force to Max Force Ratios (RFM) were developed and compared to each of the dynamic performance assessments. K-means clustering analysis to create 3 groups for RSR RRFD and RFM were found to correlate to dynamic sports assessments. RSR was found to show moderate correlations, both positive and negative, with dynamic sports assessments. The results show moderate to strong correlations, both positive and negative, with dynamic sports assessments in all but 2 assessments for RRFD. RFM results had very weak, nonsignificant results. Results of ANOVA of each of the ratios to performance outcome measures were found to be significant with small effect sizes. The primary finding of this investigation suggests youth athletes with RSRhigh (2.0+) and RRFDhigh (1.5+) with RFMlow (0.79) performed better than all other youth athletes. Utilizing RSR alone, youth athletes with RSRhigh (2.0+) performed better than all other athletes. The secondary finding of this investigation suggests that thresholds do exist for RSR, RRFD and RFM when compared to dynamic sports assessments which could be used for intake assessments and age-appropriate program design for youth athletes.
Assessing youth athletes via relative strength ratios considering isometric force production and total body mass with respect to lean body mass and percent body fat may provide additional insight into training programming and body composition modifications to increase dynamic sports performance.
Citation
Lutton G, Giles G (2024) Relative Strength, Rate of Force Development, and Body Mass Ratios Correlate to Dynamic Sports Performance in Youth Athletes. J Muscle Health 6(1): 1015.
INTRODUCTION
Performance assessments in sport and research commonly compare data captured during isometric assessments to dynamic assessments such as the Isometric Mid-Thigh Pull (IMTP) to sprint times and jump heights [1-3]. Many contain the basic anthropometric elements of body composition as a descriptive measure for the sample studied, yet they often overlook the impact of body composition as it relates to assessments comparing relative strength and Rate of Force Development (RFD) to dynamic performance assessments [4]. Previous literature highlights the relationship of an athlete’s strength to mass ratio, relative strength, as being a key factor in body weight movements where sprinting or jumping are involved [5-7]. In some cases, well trained Olympic athletes’ relative strength averaged 4.32 times the athletes’ mass and as their mass increased, regardless of muscle or fat composition, their relative strength decreased [5]. As mass increases due to hypertrophy, so does the ability to produce force, making those with more muscle mass having greater absolute strength than those with more fat mass [5,7]. There is evidence highlighting increases in strength have a positive impact on jumping and sprinting performance which could indicate increases in relative strength could be associated with better performance in those tasks [7]. Many of these studies do not focus specifically on the youth population.
The ability to produce maximal force and rapidly express force relative to body composition are essential qualities for athletes to reach their maximal athletic potential, thus deeming maximal strength and rate of force production important biomotor abilities to assess and monitor [1,8-10]. Advancements in assessment technology, the means in which to capture, analyze and present findings are evolving to include more sophisticated methods of statistical analysis to include gradient boosting, feature analysis and machine learning to assess relationships. Previous investigations highlight a relationship between strength to mass Ratios or Relative Strength Ratios (RSR), Relative Rate of Force Ratio (RRFD), Rate of Force to Max Force (RFM) and dynamic sports performance assessments in youth athletes [11,12]. The use of the Isometric Mid-Thigh Pull (IMTP) using a commercially available strain gauge allows data to be collected during intake assessments and is found to be easy to perform with very little familiarity with the assessment procedure making it a great choice for youth assessments [13]. Several studies demonstrate learning the IMTP can be done in one session as it is a quick and relatively easy assessment that requires little to no skill to perform and can be conducted on testing day without negatively impacting the integrity of the assessment [14-16]. Traditional One Rep Maximum (1RM) tests may not be suitable for youth athletes due to the physical demands and lack of training age and physiological development with which to perform 1RM tests making the IMTP assessment protocol a suitable choice for youth athletes [17-19].
perform and can be conducted on testing day without negatively impacting the integrity of the assessment [14-16]. Traditional One Rep Maximum (1RM) tests may not be suitable for youth athletes due to the physical demands and lack of training age and physiological development with which to perform 1RM tests making the IMTP assessment protocol a suitable choice for youth athletes [17-19].
METHODS
Participants
Fifty youth athletes (n = 50, males = 39, females = 11) ranging in age, height and mass (14.58 yrs ± 3.1, 166.90 cm ± 12.1, 61.01 kg ± 19.3) were included in this study with backgrounds from various sports as shown in figure 1 and figure 2. Lean Body Mass (LBM) and Percent Body Fat (PBF) were 50.49 kg ± 15.6 and 12.50% ± 12.0 respectively. This study used historical data captured during assessments of athlete’s abilities prior to beginning a training program. All athletes had to be part of an organized sports program with some resistance training experience, >1year.
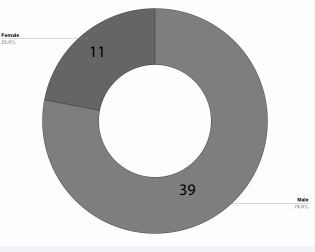
Figure 1 Sample gender distribution.
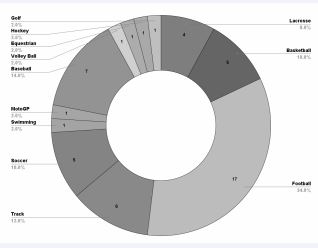
Figure 2 Sample sport distribution.Inclusion criteria
- Active, healthy, in a recreational sports program.
- Some resistance training or sport training.
- Athletes must be between 10-19 years of age.
Exclusion criteria
- No injuries within the last six months
- Not in physical therapy or rehabilitation for an injury.
- No limitations/restrictions from the doctor.
- Sedentary, no resistance or sport training.
- Not currently on a team.
PROCEDURES
Athletes arrived at Exsurgo Strong and Fit (Ashburn, VA) on their assessment day. Athletes were given an explanation of testing protocols and procedures.
Anthropometric data was collected for each athlete. Height was captured using a portable stadiometer (PUSH InLab S50) from InBody (Cerritos, CA). Body composition including weight, lean body mass, body fat percentage, were collected via bioimpedance analysis (BIA) using the InBody 570 (Cerritos, CA). Multiple studies validate BIA using the InBody570 as a reliable and practical alternative to other methods of assessing body composition [20-22].
Athletes were then given a general warm-up and dynamic warm-up lasting no longer than 10-15mins. The warmup consisted of 3mins on a stationary bike, walkout to pushups, walking lunges with a twist, lateral lunges, high knees, butt kickers, double leg and single leg pogos.
Testing then proceeded in the order outlined below with two minutes of rest given between each assessment.
Isometric Mid-Thigh Pull Max (IMTPmax)
An explanation and demonstration were given on how to perform the test following standardized methods [23,24].
Athletes performed three gradual ramping efforts for five seconds followed by three seconds of rest in succession. Athletes then rested 60 seconds before performing a maximum IMTPmax effort. Athletes were given 60 seconds of rest between each effort until the force output decreased for two consecutive repetitions. The gStrength from Exsurgo Technologies (Ashburn, VA) was used for this assessment.
Isometric Midthigh Pull Rate of Force Development (IMTPrfd)
An explanation was given on how to perform the test. Athletes then proceeded to perform a fast effort until two consecutive reps showed a decrease in RFD. Athletes were given 60 seconds of rest between each effort until the force output decreased for two consecutive repetitions. The gStrength from Exsurgo Technologies (Ashburn, VA) was used for this assessment.
Counter Movement Jump (CMJ)
An explanation and demonstration were given on how to perform the test. The athlete then did 3 counter movement jumps followed by 60 seconds of rest until the max jump height was reached and 2 consecutive jumps decreased. The gFlight from Exsurgo Technologies (Ashburn, VA) was used for this assessment.
Drop jump: An explanation and demonstration were given on how to perform the test. A 30cm box was used along with a line of tape on the ground for athletes to target and land. The gFlight from Exsurgo Technologies (Ashburn, VA) was used for this assessment. Drop Jump Height (DRJh ) in centimeters, Ground Contact Time (DRJgct) in milliseconds and Reactive Strength Index (DRJrsi) were captured and recorded.
20m sprint: An explanation and demonstration was given on how to perform the test. The athlete did 3 efforts with 60 seconds of rest in between until two consecutive efforts were above the fastest time. The gSprint from Exsurgo Technologies (Ashburn, VA) was used for this assessment with a split gate at 10m.
COD 5-10-5: An explanation and demonstration was given on how to perform the test. The athlete did 3 efforts with 60 seconds of rest in between until two consecutive efforts were above the fastest time. The gSprint from Exsurgo Technologies (Ashburn, VA) was used for this assessment. The finish gate was set up at the midpoint and athletes ran back and forth through the gate capturing their time.
All data was saved in the Exsurgo Performance System (EPS) from Exsurgo Technologies (Ashburn, VA) for later extraction and analysis.
Data preparation
Extraction, Transformation and Loading (ETL) of the data was done by exporting data from the InBody and EPS systems, imported to Google Docs (Mountain View, CA). Data was formatted for ease of use and saved as comma-separated values for analysis.
Statistical analysis
Exploratory Data Analysis (EDA) was done using R R Core Team (Vienna, Austria) RStudio RStudio Team (Boston,MA) and the psych package Revelle, W.(Evanston, Illinois) to produce a correlation matrix to investigate what relationships, if any, were present. This was used to develop a more comprehensive investigative strategy to analyze the data for correlations, strength of relationships as well as effect sizes. As correlation does not imply a causal association between the variables investigated, further analysis such as K-means clustering, gradient boosting, principal component analysis and ANOVA were performed [25]. Within the correlation analysis, the larger associations suggest the two variables are related but there could be other unknown influences [26]. Negative correlations suggest as one variable increases, the other decreases whereas positive correlations suggest as one variable increases, so does the other variable [26].
Ratios were created for RSR by dividing IMTPmax by mass, RRFD by dividing IMTPrfd by mass, and RFM by dividing IMTPrfd by IMTPmax. Using python and scikit-learn, K-means clusters were determined using 3 groups and the mean of each group was reported for further analysis [27]. Data was then analyzed using a gradient boosting technique to rank feature importance of each of the variables RSR, RRFD and RFM with relation to each of the dynamic assessments. Cohen’s d effect sizes were then calculated and reported. Additional K-means clustering was performed on each assessment and then ANOVA was performed on each of the ratio clusters and assessment clusters to assess if a significant difference is present.
RESULTS
The initial correlation matrix provides an overview of the relationship between all variables at a high level where the researchers could target specific variables or groups of variables for further analysis. Pearson correlation analysis was done to determine if relationships between each of the variables existed while also determining if the results were significant and not based on random chance. The correlation matrix results were consistent with prior research suggesting ratio analysis should then be compared to each of the assessments [2,11,12,28]. The correlation of mass and lean body mass to IMTPmax was found to be 0.73, p < 0.001, 0.78, p < 0.001, and is reinforced by prior research that athletes with higher mass, specifically lean body mass can produce more force [5-7]. The correlation between percent body fat and IMTPmax was very low and not significant, 0.12, p>0.05. Similarly, the correlation of mass and lean body mass to IMTPrfd was found to be 0.77, p < 0.001, 0.77, p < 0.001 respectively. This suggests there is a direct relationship between mass, lean body mass, IMTPmax and IMTPrfd. Percent body fat did not correlate with IMTPmax and IMTPrfd nor any of the dynamic performance assessments except COD5-10-5, 0.47, p < 0.01. Percent body fat did correlate to mass, 0.34, p < 0.05 and is consistent that as total mass increases so does body fat.
Pearson correlation analysis was performed and results of the analysis of each ratio compared to the dynamic sports assessment is explained in table 1.
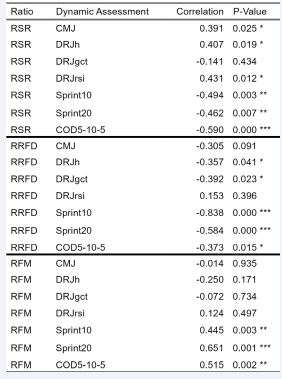
Table 1 Correlation of ratio to dynamic performance assessment. P-Value ≤
For RSR, in all but one case, RSR was found to show moderate correlations, both positive and negative, with dynamic sports assessments. Only DRJgct was weak and negative, -0.14, p=0.434. For RRFD, results show moderate to strong correlations, both positive and negative, with dynamic sports assessments in all but 2 assessments. RRFD to CMJ had a weak, negative correlation and was not significant, -0.305, p=0.091. RRFD to DRJrsi had a very weak correlation and was not significant, 0.153, p=0.396. For RFM, results were mixed with 4 of the 7 performance variables having very weak, nonsignificant results. RFM to Sprint10, Sprint20, and COD5-10-5 showed moderate, positive and significant correlations, 0.445, p=0.003, 0.651, p=0.001, 0.515, p=0.002.
Cohen’s d effect size was calculated for each of the ratios, RSR, RRFD and RFM which are outlined in table 2.
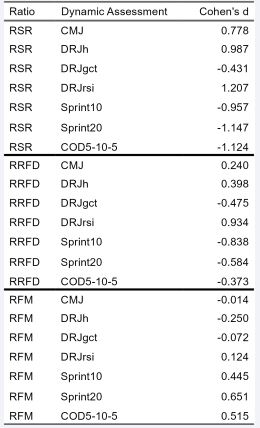
Table 2 Cohen’s d effect sizes of ratios to dynamic performance assessment.
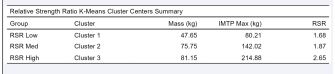
Table 3 K-Means cluster centers for RSR Low, Med, High showing Mass, IMTPmax, and the RSR. K-means clustering analysis was then performed on Mass and IMTPmax using 3 clusters to determine RSR high, medium and low groups as shown in figure 4 with results described in table 3.
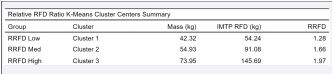
Table 4 K-Means cluster centers for RRFD Low, Med, High showing Mass, IMTPrfd, and the RRFD ratio. K-means clustering analysis was performed on Mass and IMTPrfd using 3 clusters to determine RRFD high, medium and low groups as shown in figure 5 with results described in table 4.
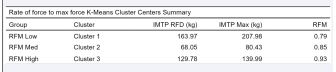
Table 5 K-Means cluster centers for RRFD Low, Med, High showing IMTPrfd, IMTPmax, and the RFM. K-means clustering analysis was performed on IMTPrfd and IMTPmax using 3 clusters to determine RFM high, medium and low groups as shown in figure 6 with results described in table 5.
Large positive and negative effect sizes for RSR to dynamic assessments were found in all assessments except DRJgct which had a moderate, negative effect size, -0.431. This suggests that athletes with a higher RSR tend to have better performance assessment results than those with a lower RSR. Effect sizes for RRFD ranged from large to small, positive and negative effect sizes suggesting that athletes with higher RRFD tend to have better performance, but the effect is not as strong as RSR. RFM effect sizes are consistent with RFM correlations in the 4 of 7 have small effect sizes suggesting that RFM has little to no impact on performance. Again, RFM to Sprint10, Sprint20, and COD5-10-5 showed medium to large effect sizes similar to RRFD but that athletes with higher RFM tend to have worse Sprint10, Sprint20, and COD5-10-5 times.
Using the results of k-means clustering of the ratios to establish Low, Med, and High thresholds, ANOVA was performed on RSR, RRFD, and RFM thresholds to dynamic sports assessments. Table 6
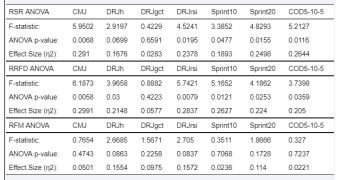
Table 6 Results of threshold ANOVA for each of the ratios.
outlines the results of the ANOVA to assess if there was a statistical significance between the Low, Medium and High thresholds. With moderate to small correlations of the ratios to dynamic sports assessments, ANOVA of the cluster analysis into 3 groups showed significant differences between the 3 groups when compared to the dynamic assessments. Results of the ANOVA show RSR thresholds to CMJ, DRJrsi, Sprint10, Sprint20, and COD5-10-5 were found to be statistically significant with a small effect size. Results of the ANOVA show RRFD thresholds for all but one was statistically significant with small effect sizes. Like prior Pearson’s correlation and Cohen’s d effect sizes, results of the RFM threshold ANOVA showed no significant difference with negligible effect sizes.
Further analysis of the RSR, RRFD and RFM ratios was conducted using scikit-learn GradientBoostingRegressor and StandardScaler to perform feature analysis comparing each of the performance assessments to RSR, RRFD and RFM ratios to determine which had more importance of the three. Results indicate RRFD has a greater importance than RSR and RFM for CMJ, DRJh , DRJgct, DRJrsi, and Sprint10. Only RSR had greater importance in COD5-10-5 and only RFM was greater in Sprint20.
Using the established thresholds for each ratio, results from dynamic performance were categorized into their respective groups based on the results of the k-means clustering and ANOVA findings as shown in tables 7-9.
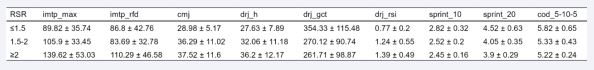
Table 7 RSR low, medium and high threshold grouped by assessment.
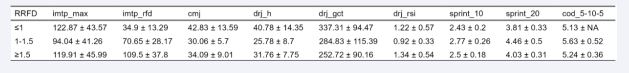
Table 8 RRFD low, medium and high threshold grouped by assessment.
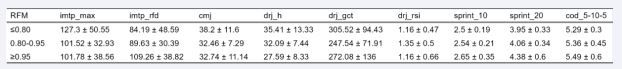
Table 9 RFM low, medium and high threshold grouped by assessment.
DISCUSSION
The primary finding of this investigation suggests youth athletes with a higher RSR’s 2.0+ and higher RRFD 1.5+ with an RFM of 0.80 performed better than all other youth athletes. Utilizing RSR alone, youth athletes greater than 2.0 performed better than all other athletes. Total body strength and the ability to produce strength over a short amount of time are key factors in dynamic sports performance. Training designed to increase total body strength to positively impact RSR as measured using IMTPmax could result in better performance. Prior research shows increasing dynamic strength and muscle mass resulted in better performance outcome measures and are consistent with the results of this investigation where athletes with higher RSR and RRFD performed better at performance assessments [5-7,29]. Alternatively, youth athletes who possessed higher RRFD alone did not necessarily perform better at dynamic sports assessments. In the sample investigated, youth athletes with lower RSR and higher RRFD were more “sport-specific” trained meaning they performed more sport training than resistance training. Only by having a higher RSR did those with a higher RRFD score better on dynamic sports assessments. It lays the groundwork for future training program development to focus on developing a base level of strength and increase RSR, followed by continually assessing RRFD as well as RSR to track athlete development. The results of the RSR groupings are consistent with prior research whereas RSR increased, so did the 1RM of the back squat [29]. Sánchez-Medina L, et al. found the 3 RSR groups to be 1.20, 1.40 and 1.68 for senior national level athletes with a mean age of 23.6 years [29]. The variance in these numbers and the results of this investigation could be due to participants’ age and body composition given the ratios are relative to their mass and this could be different across sample populations.
An interesting result was that RFM fluctuates based on IMTPrfd and IMTPmax which could suggest there is a training need for those who have a high RFM with low RSR. Due to the younger age of these youth athletes, some with a lower resistance training age versus their sport participation age, some youth athletes had a higher RFM (80-100+%) and lower RSR (1.5) and better dynamic performance were in the RSRhigh (2.0+) category and RRFDhigh (1.5+) with RFMlow (0.79). This suggests there is a “sweet spot” in preparation training where practitioners could focus their efforts according to intake assessments and continuous assessment data analysis to increase performance in specific areas. An important aspect of youth sports should involve youth athletes playing their sport but also include general strength and conditioning to increase their RSR and RRFD while monitoring RFM.
Many strength and conditioning professionals focus on the speed-strength and strength-speed continuum as indicated by the vast amounts of training program literature on the subject [30,31]. As the historical literature which many of these programs are based on takes this into account in initial assessments and evaluations, assessing RSR, RRFD, and RFM for youth athletes as well as older athletes establishes a starting point for needs based analysis which could include elements of speed-strength and strength-speed training interventions later on [5,6].
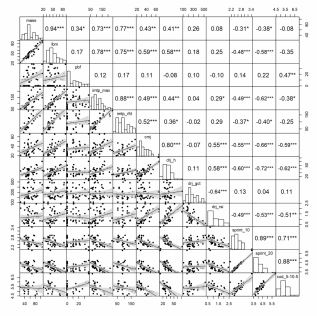
Figure 3 EDA correlation matrix to illustrate relationships collectively.
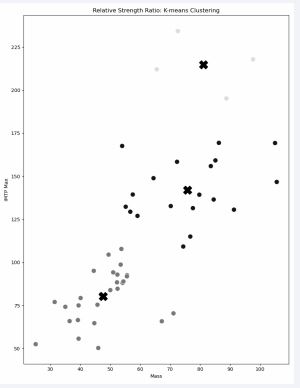
Figure 4 K-Means clustering of IMTPmax and mass into 3 groups as depicted by the “?”.
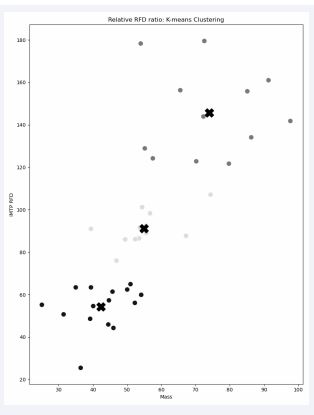
Figure 5 K-means clustering of IMTPrfd and mass into 3 groups with centers depicted by “?”.
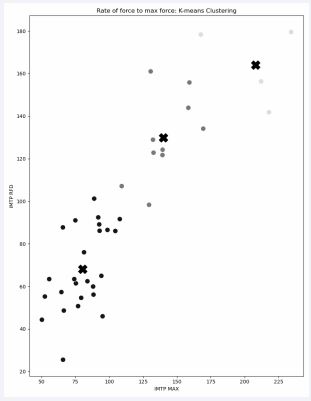
Figure 6 K-means clustering of IMTPrfd and IMTPmax into 3 groups with ce
With the sample proportionately larger for males than females, studies show relative strength shows no significant gender differences between females and males [32-35]. Relative strength can and should be used as it is not sensitive to gender or sex-related differences. Absolute strength on the other hand does show significant differences and that is why it was not used for this study [32,34,35].
A key strength of this investigation is the participant pool consists of developing youth athletes which to the best of the author’s knowledge, very little research exists concerning RSR, RRFD, and RFM values outlining thresholds and potentially developing normative values for future use.
PRACTICAL APPLICATION
With the medium to high correlation between RSR and RRFD to dynamic sports assessments combined with the medium to large effect size as previously described, practitioners could use assessments like the IMTPmax and IMTPrfd in conjunction with body mass to easily assess and track youth athletes in a relatively safe and effective manner. The use of the RSR could be the starting point for determining the needs of the athlete and allowing the practitioner to monitor changes during training sessions. Training programs could be developed with the goal of increasing RSR and RRFD based on the model of speed, strength, endurance and practitioners could group individuals into 2 groups focusing on increasing RSR as a general prep phase and RRFD as they transition to a more sport specific training phase. Additionally, practitioners could use changes in RSR to monitor fatigue in youth and older athletes as part of an injury-risk management strategy. The researchers are currently investigating these changes in terms of pre/post events to assess if this is practical for use in sport and training programs. With the ease of use of the IMTP as an assessment tool, practitioners could begin to monitor changes more frequently and with the use of emerging technologies, could provide a more custom age-specific sport and resistance training program.
CONCLUSION
Assessing youth athletes using RSR, RRFD and RFM was significant with larger effect sizes making these ratios specific to the training phase for each athlete and their abilities to perform dynamic sports assessments. Athletes with higher RSR, combined with higher RRFD and lower RFM were better performers at dynamic sports assessments making the use of these ratios a key tool for assessing potential sports performance and developing appropriate training interventions.
RESEARCH APPROVALS
Exsurgo Technologies is a certified research and technology company and is registered with the Human Health Services Office of Human Research Protections in the US as follows:
IORG0011588 Exsurgo Technologies, LLC IRB00013737 Exsurgo Technologies, LLC IRB #1 FWA00032949 Exsurgo Technologies, LLC
Research follows the OHRP regulations and policy guidelines for human subject research.
This investigation was approved as NON-HUMAN RESEARCH as it used historical data. extc_IRB_242533898779074
CONFLICTS OF INTEREST
Greg Lutton is Director of Research and Technology Development for Exsurgo Technologies and is Director of Sports Performance for Exsurgo Strong and Fit. Garrett Giles is a Strength and Conditioning Coach for Exsurgo Strong and Fit and Doctor of Physical Therapy Student.
FUNDING
The authors declare that the research was conducted in the absence of any commercial or financial relationships that could be construed as a potential conflict of interest. Neither author received funding to conduct or for conducting the research.
REFERENCES
- Dos’Santos T, Thomas C, Comfort P, McMahon JJ, Jones PA. Relationships between isometric force-time characteristics and dynamic performance. Sports (Basel). 2017; 5: 68.
- Lum D, Haff GG, Barbosa TM. The relationship between isometric force-time characteristics and dynamic performance: A systematic review. Sports (Basel). 2020; 8: 63.
- West DJ, Owen NJ, Jones MR, Bracken RM, Cook CJ, Cunningham DJ, et al. Relationships between force-time characteristics of the isometric midthigh pull and dynamic performance in professional rugby league players. J Strength Cond Res. 2011; 25: 3070-3075.
- Darrall-Jones JD, Jones B, Till K. Anthropometric and physical profiles of english academy rugby union players. J Strength Cond Res. 2015; 29: 2086-2096.
- Harre D, Barsch J. Principles of sports training: Introduction to the theory and methods of training. Germany, Sportverlag. 1982.
- Yuri V, Siff MC. Supertraining. Verkhoshansky. Italy. 2009; 578.
- Stone MH, Hornsby WG, Suarez DG, Duca M, Pierce KC. Training specificity for athletes: Emphasis on strength-power training: A narrative review. J Funct Morphol Kinesiol. 2022; 7: 102.
- Suchomel TJ, Nimphius S, Stone MH. The importance of muscular strength in athletic performance. Sports Med. 2016; 46: 1419-1449.
- Bompa TO, Buzzichelli C. Periodization-6th edition: Theory and methodology of training. Human Kinetics. 2019; 392.
- Haff GG, Stone MH. Methods of developing power with special reference to football players. Strength & Conditioning Journal. 2015; 37: 2-16.
- Lutton G, Giles G. The relationship between isometric strength and body mass to dynamic performance in youth athletes. Research & Investigations in Sports Medicine. 2023; 10.
- Giles GC, Lutton G. The relationship between isometric rate of force development and isometric maximum strength ratio to dynamic performance in youth athletes. Research & Investigations in Sports Medicine. 2024; 10.
- Comfort P, Dos’Santos T, Beckham G, Stone MH, Guppy SN, Haff GG. Standardization and methodological considerations for the isometric midthigh pull. Strength & Conditioning Journal. 2019; 41: 57-79.
- James LP, Roberts LA, Haff GG, Kelly VG, Beckman EM. Validity and reliability of a portable isometric mid-thigh clean pull. J Strength Cond Res. 2017; 31: 1378-1386.
- Grgic J, Scapec B, Mikulic P, Pedisic Z. Test-retest reliability of isometric mid-thigh pull maximum strength assessment: A systematic review. Biol Sport. 2022; 39: 407-414.
- National Strength & Conditioning Association, Miller T. eds. NSCA’s Guide to Tests and Assessments. Human Kinetics. 2012; 368.
- De Witt JK, English KL, Crowell JB, Kalogera KL, Guilliams ME, Nieschwitz BE, Hanson AM, Ploutz-Snyder LL. Isometric midthigh pull reliability and relationship to deadlift one repetition maximum. J Strength Cond Res. 2018; 32: 528-533.
- Robertson RJ, Goss FL, Aaron DJ, Gairola A, Kowallis RA, Liu Y, et al. One repetition maximum prediction models for children using the omni rpe scale. J Strength Cond Res. 2008; 22: 196-201.
- Faigenbaum AD, Kraemer WJ, Blimkie CJ, Jeffreys I, Micheli LJ, Nitka M, et al. Youth resistance training: updated position statement paper from the national strength and conditioning association. J Strength Cond Res. 2009; 23: 60-79.
- Kraska JM, Ramsey MW, Haff GG, Fethke N, Sands WA, Stone ME, et al. Relationship between strength characteristics and unweighted and weighted vertical jump height. Int J Sports Physiol Perform. 2009; 4: 461-473.
- James LP, Roberts LA, Haff GG, Kelly VG, Beckman EM. Validity and reliability of a portable isometric mid-thigh clean pull. J Strength Cond Res. 2017; 31: 1378-1386.
- Comfort P, Dos’Santos T, Beckham G, Stone MH, Guppy SN, Haff GG. Standardization and methodological considerations for the isometric midthigh pull. Strength & Conditioning Journal. 2018; 41: 1.
- Sirirat R, Heskey C, Wilson C, Bitok E, Jones J, Clarke A, et al. A comparison of body composition measurements between bioelectrical impedance analysis (inbody 570) and air displacement plethysmography (bod pod®). Current Developments in Nutrition. 2020; 4: nzaa063_087.
- Miller RM, Chambers TL, Burns SP. Validating inbody® 570 multi- frequency bioelectrical impedance analyzer versus dxa for body fat percentage analysis.: 3576 Board #15 June 4, 8. Medicine & Science in Sports & Exercise. 2016; 48: 991.
- Schober P, Boer C, Schwarte LA. Correlation coefficients: Appropriate use and interpretation. Anesth Analg. 2018; 126: 1763-1768.
- McLester CN, Nickerson BS, Kliszczewicz BM, McLester JR. Reliability and agreement of various inbody body composition analyzers as compared to dual-energy x-ray absorptiometry in healthy men and women. J Clin Densitom. 2020; 23: 443-450.
- Pedregosa F, Varoquaux G, Gramfort A, Michel V, Thirion B, Grisel O, et al. Scikit-learn: Machine learning in python. Journal of Machine Learning Research 12. 2012.
- Giles G, Lutton G, Martin J. Scoping review of the isometric mid- thigh pull performance relationship to dynamic sport performance assessments. J Funct Morphol Kinesiol. 2022; 7: 114.
- Sánchez Medina L, Pallarés JG, Pérez CE, Morán-Navarro R, González- Badillo JJ. Estimation of relative load from bar velocity in the full back squat exercise. Sports Med Int Open. 2017; 1: 80-88.
- Dietz C, Peterson B. Triphasic training: A systematic approach to elite speed and explosive strength performance. Bye Dietz Sport Enterprise. 2012; 376.
- Folker, Adam. “Finally Dunk like a Total Badass...” Vert Shock | #1 Worldwide Jump, https://vertshock.com/. Accessed 10 Oct. 2024.
- Roberts BM, Nuckols G, Krieger JW. Sex differences in resistance training: A systematic review and meta-analysis. J Strength Cond Res. 2020; 34: 1448-1460.
- Hunter, Gary R. Research: Changes in body composition, body build and performance associated with different weight training frequencies in males and females. National Strength and Conditioning Association Journal. 1985; 7: 26-28.
- Heyward VH, Johannes-Ellis SM, Romer JF. Gender differences in strength. Research Quarterly for Exercise and Sport. 1986; 57: 154- 159.
- Ramos E, Frontera WR, Llopart A, Feliciano D. Muscle strength and hormonal levels in adolescents: Gender related differences. Int J Sports Med. 1998; 19: 526-531.


