Densitometric Evaluation and Fragility Fractures after Spinal Cord Injury
- 1. Department of Radiology and Diagnostic Imaging, Rede SARAH de Hospitais de Reabilitação, Brazil
ABSTRACT
Background: Spinal cord injury (SCI) can lead to serious complications, including bone loss and fragility fractures, making it important for radiologists to understand the frequencies and risk factors associated with these complications.
Purpose: To describe the frequencies of bone mineral density (BMD) changes and fragility fractures after SCI in participants who underwent dual-energy X-ray absorptiometry (DXA).
Materials and Methods: A retrospective chart review in a single rehabilitation center between December 2019 and August 2021 of participants with SCI who underwent DXA. Participants were divided into groups based on traumatic SCI, nontraumatic SCI, and simultaneous brain and SCIs. Within each group, participants were classified based on the presence or absence of fragility fractures and the results of BMD measurements. DXA measurements were assessed following the norms of the International Society of Clinical Densitometry. The knee BMD measurements followed the Toronto protocol. Blinded and independent evaluations were performed, and statistical analysis was performed using Fisher’s exact test.
Results: Of a total of 358 participants with SCI (mean age 41 years +/- 15.4 [standard deviation]; 221 men), 263/358 (73.5%) had traumatic SCI, 68/358 (19.0%) had nontraumatic SCI, and 27/358 (7.5%) had simultaneous brain and SCIs. Osteoporosis was identified in 81/358 (22.6%) participants, with the highest rate seen in those with nontraumatic SCI (28/68, 41.2%). Fragility fractures were observed in 46/358 (12.9%), with the highest rate seen in those with nontraumatic SCI (14/68, 20.6%). There was a statistically significant association between fragility fractures and osteoporosis in participants with SCI (p=0.005, OR=3.9, 95% CI: 1.4-12.7).
Conclusion: Almost one in five participants with SCI had osteoporosis, and more than one in 10 had fragility fractures. Nontraumatic SCI was associated with higher rates of osteoporosis and fragility fractures. Our study highlights the importance of monitoring bone health in SCI patients, particularly those with nontraumatic SCI.
Keywords
• Spinal cord injury; Bone mineral density; Dual energy X–ray absorptiometry; Osteoporosis; Fragility fractures
CITATION
Cunha A, Jr (2025) Densitometric Evaluation and Fragility Fractures after Spinal Cord Injury. J Neurol Disord Stroke 12(1): 1231.
ABBREVIATIONS
SCI: Spinal Cord Injury; BMD: Bone Mineral Density; DXA: Dual-Energy X–Ray Absorptiometry; ROI: Region of Interest; RMS: Root-Mean-Square; CV: Coefficient of Variation; SD: Standard Deviation; IQR: Interquartile Range; OR: Odds Ratio; CI: Confidence Interval
INTRODUCTION
Spinal cord injury (SCI) is a devastating condition that affects the skeletal system, motor and sensory functions [1- 9]. SCI patients are at high risk of developing bone loss and fragility fractures, which can have consequences for their quantity and quality of life [3-17]. Bone loss mainly occurs in the paralyzed extremities, primarily the knees [1,4,6,8,11,12,15,16,18-24]. The locations of fractures in SCI patients include the distal femur, proximal femur, and tibia and/or distal fibula [5-8,11,14-16,21,23,25-28].
Measurement of bone mineral density (BMD) is essential for diagnosing and monitoring bone loss following a permanent motor deficit [6,8-10,16-18,20,22,28,29]. Dual energy X-ray absorptiometry (DXA) provides the necessary precision and reliability for assessing BMD and monitoring bone loss. DXA is the most clinically useful method due to its low radiation exposure [18,30]. Precision studies are performed to ensure a properly quantitative bone density measurement [6,20,31-33]. The assessment of BMD in SCI patients is challenging due to various factors such as spinal arthrodesis, scoliosis, venous thromboembolism prophylaxis devices (vena cava filters), and heterotopic ossification in the hip [5,19,34] as shown in Figure 1.
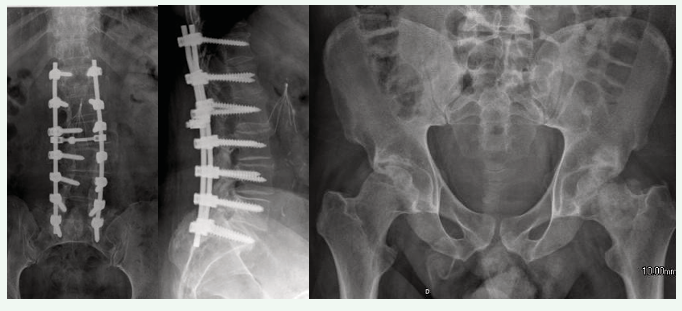
Figure 1: Difficulties in measuring bone mineral density by dual energy X-ray absorptiometry in spinal cord injury: Spinal arthrodesis, vena cava filter, and heterotopic ossification in the hips.
Knee BMD measurements have been shown to be highly reliable [8,9,10,16,17,22,28], and DXA allows reduced exposure to ionizing radiation [8,9]. SCI patients require multiple imaging methods due to several complications. As many of these SCI patients are young and require frequent imaging tests to manage their condition, reducing the X-ray dose is critical, particularly given the increased survival of SCI patients due to improved health care [9,12,13].
Considerations should be given to conducting DXA before prescribing weight-bearing upright activities [6,9,22,25,28,34]. The fracture threshold at the knee was originally reported and later confirmed to be approximately a BMD of 0.780 g/cm2, while the breakpoint was found to be approximately 0.490 g/cm2. [11,17,28] According to the International Society of Clinical Densitometry’s 2019 guidelines [6], a distal femur BMD value of 0.561 g/cm2 has been suggested as an indicator for treatment. SCI individuals with fragility fractures had lower bone density at the femoral neck (mean BMD = 0.504 g/cm2) than those without fractures (0.786 g/cm2). Additionally, there was a reduction in knee BMD in SCI patients with a history of fractures compared to those without fractures [6,17].
Considering that context, this study aimed to describe the frequency of BMD changes and fragility fractures after SCI in participants who underwent DXA. By shedding light on these issues, our work contributes to a better understanding of the bone health status of SCI patients and may help guide clinical decision-making for their care.
MATERIAL AND METHODS
We conducted a retrospective chart review at a single rehabilitation center in … unit of the … Network of Rehabilitation Hospitals between December 2019 and August 2021. The project protocol was approved by the institution’s ethics committee (CAAE: 53530021.8.0000.0022).
Participants
The study included consecutive patients over 15 years old with DXA data and a clinically and radiologically confirmed diagnosis of SCI. In this manuscript we report the chance of fragility fractures in patients with SCI and osteoporosis compared with those with SCI and normal bone mineral density. The flow chart of the study is described in Figure 2.
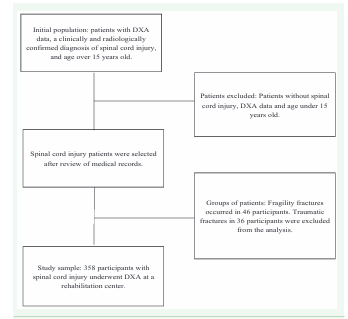
Figure 2: Flow chart of the spinal cord injury study and dual-energy X-ray absorptiometry (DXA)
The neurological level of injury was classified according to the 2019 version of the International Standards for Neurological Classification of SCIs as cervical, thoracic, lumbar, or sacral. We used the American Spinal Injury Association Impairment Scale for the classification of the level of injury as complete or incomplete. The American Spinal Injury Association Impairment Scale is a classification system used to describe the degree of impairment and function after a SCI [35].
Participants were divided based on the type of SCI, whether it was related to trauma or not, and the presence of simultaneous brain injury. In the latter group, cerebral involvement was due to demyelinating diseases or an associated traumatic brain injury at the time of the SCI event. Within each group, participants were further classified based on the presence or absence of fragility fractures and the results of BMD measurements, which were categorized as normal, below the expected range for age, or indicative of osteoporosis.
The study population consisted of 358 patients who underwent DXA. To calculate the required sample size, we determined that the proportion of patients with fragility fractures was 12.9%, the permissible error was 0.05, and the confidence level was 95%, resulting in a sample size of 117 participants.
Assessment and Image Acquisition and Analysis
We obtained data from electronic records that included information about all participants. A multidisciplinary team conducted independent clinical and BMD evaluations for each patient. We collected data on age, height, weight, and sex, as well as menopausal status, hypertension, diabetes, dyslipidemia, alcohol use, smoking, corticosteroid therapy, and fragility fractures, which were defined using the International Statistical Classification of Diseases, tenth revision codes. Traumatic fractures, resulting from falls from a height greater than standing, sports injuries, and motor vehicle/motorcycle accidents in 36 participants were not considered for analysis.
We performed a systematic and retrospective evaluation of DXA using Lunar Prodigy Advance equipment (GE-Lunar) with ENCORE software, version 18 [SP 1]. We assessed the spine, hip (total femur and femoral neck on both sides of the body), and forearm according to the norms of the International Society of Clinical Densitometry [29]. We also evaluated the right and left knee BMD measurements following the Toronto protocol,6 which assessed three regions of interest (ROIs) of equal area (4×10 cm): two measurements at the distal femur (one at the metaphysis and the other at the epiphysis) and one measurement at the proximal tibia (epiphysis), as shown in Figure 3.
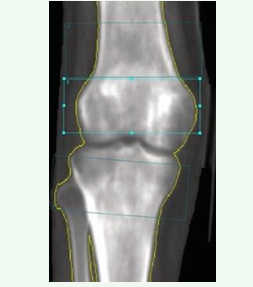
Figure 3: Knee dual-energy X-ray absorptiometry (DXA): regions of interest (ROIs) of equal area (4×10 cm) - measurements at the distal femur (metaphysis and epiphysis) and at the proximal tibia (epiphysis).
We calculated root-mean-square (RMS), the RMS coefficient of variation (CV) and RMS standard deviation (SD) [31] at the distal metaphysis femoral, distal epiphysis femoral, and proximal epiphysis tibial, as described in our another study [17].
Statistical analysis
Data were analyzed using the open-source R statistical programming software (R Core Team, 2020). Nominal variables were expressed as numbers and percentages, while continuous variables were presented as medians, SD and interquartile ranges (IQRs) due to nonnormal distribution based on the Shapiro?Wilk test. To assess the association between fragility fractures and alterations in BMD in patients with SCI, we performed a 2 x 2 table analysis. Fisher’s exact test was used to calculate odds ratios (ORs) and 95% confidence intervals (CIs) for the categorical variables of fragility fracture and BMD status (normal BMD vs. below the expected range for age and normal BMD vs. osteoporosis). A p value of less than 0.05 was considered statistically significant.
RESULTS
Participant demographics
A total of 358 participants with available DXA data and SCI were included in the study, out of which 221/358 (61.7%) were male. The age range of the participants was from 15 to 85 years. The age distribution was asymmetric across decades. There was a larger number of participants in the fourth decade. The mean age was 41 years, with a SD of 15.4 years. The median age was 41 years (IQR 30–56 years). The median time of permanent motor deficits was 5 years (IQR 2–14 years) since SCI. The demographics of the participants are summarized in Table 1.
Table 1. Demographics of the study participants
|
Demographics |
Participants (median and IQR or %) |
|
Age (years) – Median (IQR) |
41 (30–56) |
|
Sex (female) |
137/358 (38.3%) |
|
Menopause |
72/137 (52.6%) |
|
Menopause time (years) – Median (IQR) |
12 (7–17) |
|
Height (cm) – Median (IQR) |
168 (160–175) |
|
Weight (kg) – Median (IQR) |
69.3 (58.9–78.9) |
|
SCI length (years) – Median (IQR) |
5 (2–14) |
|
Hypertension |
76/358 (21.2%) |
|
Diabetes mellitus |
54/358 (15.1%) |
|
Dyslipidemia |
109/358 (30.4%) |
|
Alcoholism |
114/358 (31.8%) |
|
Smokers |
75/358 (20.9%) |
|
Corticosteroid therapy |
35/358 (9.8%) |
|
Fragility fractures |
46/358 (12.9%) |
|
Traumatic fracture |
36/358 (10.1%) |
Note. – IQR: interquartile range.
SCI was traumatic in 263/358 (73.5%) participants, nontraumatic in 68/358 (19.0%) participants and associated with a brain lesion in 27/358 (7.5%) participants. In terms of American Spinal Injury Association Impairment Scale, SCI classes were A in 183/358 (51.1%) participants, B in 39/358 (10.9%) participants, C in 58/358 (16.2%) participants and D in 19/358 (16.5%) participants. American Spinal Injury Association Impairment Scale classification was not performed in 59/358 (16.5%) participants. Of the SCI neurological levels, the thoracic SCI level was the most frequent with 297/358 (57.8%) participants. This was followed by cervical with 6/358 (19.0%) participants, lumbar with 35/358 participants (9.8%), and 1/358 (0.3%) sacral participant. The level of injury could not be measured in 47/358 (13.1%). The American Spinal Injury Association Impairment Scale classes and SCI neurological levels are available in Figures 4 and 5.
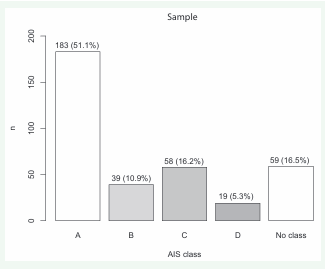
Figure 4: Frequencies of the different ASIA (American Spinal Injury Association) impairment scale (AIS) classes of the study participants
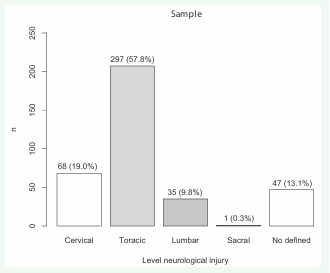
Figure 5: Frequencies of different neurological level injuries of the study participants.
We compared the demographic data of the three groups with SCI and found some differences among the groups. In the traumatic SCI group, the median age of participants was 39 years (IQR: 29-52), and there were fewer menopausal women (31/263, 11.8%) and a higher median height of 170 cm (IQR: 164-175). A greater number of participants reported alcohol use (93/263, 35.5%) and were found to have traumatic fractures (33/263, 12.5%) in the traumatic SCI group. In contrast, participants with nontraumatic SCI were older, with a median age of 54 years (IQR: 37 64) and had a higher proportion of women (48/68, 70.6%) and menopausal women (31/68, 45.6%) with an average menopause duration of 11 years (IQR: 9-19). Comorbidities such as diabetes mellitus (20/68, 29.4%),dyslipidemia (29/68, 42.6%), and smoking (18/68, 26.5%) were more prevalent in this group. In the simultaneous SCI and brain injury group, 13/27 (48.1%) participants received corticosteroid therapy. The duration of disability and permanent motor impairment were similar across all three groups. The details comparing the demographic data among groups with SCI are presented in Table 2.
Table 2: Demographics of the spinal cord injury (SCI) groups
|
Demographics |
SCI Trauma |
SCI No Trauma |
SCI + Brain Injury |
|
n = 358 |
263/358 (73.5%) |
68/358 (19.0%) |
27/358 (7.5%) |
|
Age (years) – Median (IQR) |
39 (29-52) |
54 (37-64) |
40 (33-57) |
|
Sex (female) |
72/263 (27.4%) |
48/68 (70.6%) |
17/27 (63.0 %) |
|
Menopause |
31/263 (11.8%) |
31/68 (45.6%) |
10/27 (37.0%) |
|
Menopause time (years) – Median (IQR) |
12 (8-16) |
11 (9-19) |
9 (4-18) |
|
Height (cm) – Median (IQR) |
170 (164- 175) |
162 (156-168) |
161 (155-169) |
|
Weight (kg) – Median (IQR) |
70 (60-79) |
67 (57-76) |
71 (56-82) |
|
SCI time (years) – Median (IQR) |
5 (2-12) |
7 (2-18) |
6 (2-21) |
|
Hypertension |
38/263 (14.4%) |
30/68 (44.1%) |
8 /27 (29.6%) |
|
Diabetes mellitus |
27/263 (10.2%) |
20/68 (29.4%) |
7/27 (25.9%) |
|
Dyslipidemia |
70/263 (26.6%) |
29/68 (42.6%) |
10/27 (37.0%) |
|
Alcoholism |
93/263 (35.4%) |
17/68 (25.0%) |
4/27 (14.8%) |
|
Smokers |
56/263 (21.2%) |
17/68 (25.0%) |
2/27 (7.4%) |
|
Corticosteroid therapy |
4/263 (1.5%) |
18/68 (26.5%) |
13/27 (48.2%) |
|
Traumatic fractures |
33/263 (12.5%) |
0 /68 (0.0%) |
3/27 (11.1%) |
Note. – SCI: spinal cord injury; IQR: interquartile range.
Fragility fractures and BMD
Fragility fractures occurred in 46/358 (12.9%) participants. Fragility fracture was more frequent in participants with nontraumatic SCI occurring in 14/68 (20.6%). In the group with simultaneous SCI and brain injury, the frequency was 3/27 (11.1%), and there were fragility fractures in 29/263 (11.0%) of the traumatic SCI participant, as shown in Table 3.
Table 3: Proximal femur and knee dual–energy X–ray absorptiometry (DXA) diagnoses among the spinal cord injury (SCI) groups
|
DXA |
SCI |
SCI Trauma |
SCI No Trauma |
SCI + Brain Injury |
|
Fragility fractures |
46/358 (12.9%) |
29/263 (11.0%) |
14/68 (20.6%) |
3/27 (11.1%) |
|
Postmenopausal, males aged > 50 |
130/358 (36.3%) |
78/263 (29.7%) |
40/68 (58.8%) |
12/27 (44.4%) |
|
Prior to menopause, males aged < 50 |
228/358 (63.7%) |
185/263 (70.3%) |
28/68 (41.2%) |
15/27 (55.6%) |
|
Osteoporosis* T score < -2.5 |
81/358 (22.6%) |
45/263 (17.1%) |
28/68 (41.2%) |
8/27 (29.6%) |
|
Fragility fractures + Osteoporosis |
19/358 (5.3%) |
10/263 (3.8%) |
8/68 (11.8%) |
1/27 (3.7%) |
|
Low bone density |
194/358 (54.2%) |
168/263 (63.9%) |
35/68 (51.5%) |
11/27 (40.7%) |
|
-2.5 < T score < -1.0 |
31/358 (8.7%) |
24/263 (9.1%) |
24/68 (35.3%) |
3/27 (11,1%) |
|
Z score < -2.0 |
163/358 (45.5%) |
144/263 (54.8%) |
11/68 (16.2%) |
8/27 (29.6%) |
|
Fragility fractures + Low bone density |
21/358 (5.9%) |
14/263 (5.3%) |
5/68 (7.4%) |
2/27 (7.4%) |
|
Normal BMD* |
83/358 (23.1%) |
50/263 (19.0%) |
25/68 (36.8%) |
8/27 (29.6%) |
|
T score > -1.0 |
11/358 (3.1%) |
9/263 (3.4%) |
1/68 (1.5%) |
1/27 (3.7%) |
|
Z score > -2.0 |
72/358 (20.1%) |
41/263 (15.6%) |
24/68 (35.3%) |
7/27 (25.9%) |
|
Fragility fractures + Normal BMD |
6/358 (1.7%) |
5/263 (1.9%) |
1/68 (1.5%) |
0/27 (0.0%) |
Note. – DXA: dual-energy X-ray absorptiometry; SCI: spinal cord injury. BMD: bone mineral density; *according to International Society for Clinical Densitometry, 2019.
Osteoporosis was present in 81/358 (22.6%) of the study sample. Osteoporosis was more common in the nontraumatic SCI group, with 28/68 (41.2%) having this condition and fragility fractures and in 8/68 (11.8%) participants who had both osteoporosis and fragility fractures. In the traumatic SCI group, a higher proportion of participants had low bone density with 168/263 (63.9%) affected. However, fractures in participants with low bone density (osteopenia or below the expected range for age) were more frequent in the nontraumatic SCI group (5/68, 7.4%) and in the simultaneous SCI and brain injury group with (2/27, 7.4%). These findings are summarized in Table 3.
There was a statistically significant association (p=0.005) between the presence of fragility fractures and osteoporosis in participants with SCI (OR = 3.9, CI = 1.4 to 12.7), indicating that the chance of fragility fractures is nearly four times higher in patients with SCI and osteoporosis than in those with SCI and normal BMD by DXA.
BMD
The median BMD in patients with SCI is lower in the hips and knees, especially in the proximal tibias, while the median BMD is higher when evaluating the spine and forearm, as shown in Figure 6.
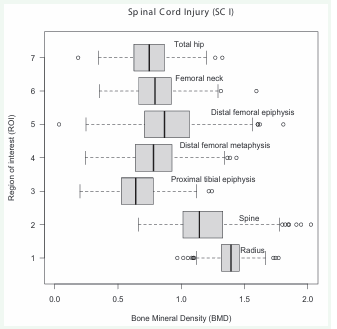
Figure 6: Bone mineral density (BMD) of the regions of interest (ROI) in the study participants with spinal cord injury (SCI).
The median BMD in patients with nontraumatic SCI was lower in almost all evaluated sites, especially in the proximal tibia, as shown in Table 4.
Table 4: Bone mineral density (BMD) medians and interquartile ranges (IQRs) of the different spinal cord injury (SCI) groups
|
ROI/BMD (g/cm2) |
SCI Trauma Median (IQR) |
SCI No Trauma Median (IQR) |
SCI + Brain Injury Median (IQR) |
|
Right total hip* |
0.749 (0.624–0.872) |
0.732 (0.641–0.851) |
0.787 (0.662–0.925) |
|
Right femoral neck* |
0.796 (0.680–0.911) |
0.760 (0.685–0.875) |
0.877 (0.692–0.987) |
|
Left total hip* |
0.759 (0.615–0.869) |
0.736 (0.610–0.867) |
0.800 (0.655–0.921) |
|
Left femoral neck* |
0.797 (0.667–0.924) |
0.764 (0.658–0.875) |
0.853 (0.675–0.946) |
|
Right distal femoral epiphysis** |
0.888 (0.708–1.073) |
0.853 (0.726–1.102) |
0.874 (0.756–1.201) |
|
Right distal femoral metaphysis** |
0.744 (0.618–0.923) |
0.785 (0.648–0.899) |
0.934 (0.720–1.082) |
|
Right proximal tibial epiphysis** |
0.649 (0.508–0.772) |
0.607 (0.545–0.775) |
0.726 (0.572–0.872) |
|
Left distal femoral epiphysis** |
0.867 (0.693–1.047) |
0.867 (0.744–1.116) |
0.996 (0.803–1.140) |
|
Left distal femoral metaphysis** |
0.782 (0.634–0.916) |
0.760 (0.672–0.874) |
0.866 (0.722–1.060) |
|
Left proximal tibial epiphysis** |
0.642 (0.524–0.748) |
0.615 (0.533–0.730) |
0.665 (0.533–0.841) |
|
Spine* |
1.165 (1.037–1.364) |
1.087 (0.943–1.202) |
1.161 (0.931–1.332) |
|
Radius* |
0.918 (0.822–0.994) |
0.780 (0.666–0.887) |
0.790 (0.636–0.882) |
Note. – ROI: region of interest; BMD: bone mineral density; SCI: spinal cord injury; IQR: interquartile range. *NHANES/Lunar data. **Toronto Rehab Protocol.
The median T score was also lower in the nontraumatic SCI group, as presented in Supplementary Material S Table
S Table 1: Medians and interquartile ranges (IQRs) of T scores of the different spinal cord injury (SCI) groups.
|
ROI/T score |
SCI Trauma Median (IQR) |
SCI No Trauma Median (IQR) |
SCI + Brain Injury Median (IQR) |
|
Right total hip* |
-2.0 (-3.0; -1.1) |
-2.2 (-2.9; -1.2) |
-1.6 (-2.7; -0.6) |
|
Right femoral neck* |
-1.7 (-2.5; -0.9) |
-2.0 (-2.5; -1.2) |
-1.1 (-2.3; -0.3) |
|
Left total hip* |
-1.9 (-3.0; -1.1) |
-2.2 (-3.2; -1.1) |
-1.7 (-2.6; -0.9) |
|
Left femoral neck* |
-1.7 (-2.5; -0.8) |
-2.0 (-2.7; -1.2) |
-1.3 (-2.4; -0.6) |
|
Right distal femoral epiphysis** |
-1.5 (-2.8; -0.1) |
-1.6 (-2.7; 0.4) |
-1.6 (-2.3; 0.8) |
|
Right distal femoral metaphysis** |
-2.3 (-3.5; -1.3) |
-2.2 (-3.3; -1.3) |
-1.2 (-2.7; 0.2) |
|
Right proximal tibial epiphysis** |
-1.7 (-2.5; -1.0) |
-2.0 (-2.3; -1.0) |
-1.3 (-2.2; -0.4) |
|
Left distal femoral epiphysis** |
-1.7 (-3.0; -0.4) |
-1.5 (-2.4; 0.3) |
-0.8 (-2.0; 0.6) |
|
Left distal femoral metaphysis** |
-2.3 (-3.4; -1.3) |
-2.4 (-3.1; -1.4) |
-1.5 (-2.6; -0.3) |
|
Left proximal tibial epiphysis** |
-1.8 (-2.4; -1.1) |
-1.9 (-2.4; -1.3) |
-1.6 (-2.4; -0.6) |
|
Spine* |
-0.1 (-1.2; 1.6) |
-0.7 (-1.6; 0.2) |
-0.2 (-2.12; 1.3) |
|
Radius* |
0.5 (-0.6; 1.3) |
-0.9 (-1.5; 0.5) |
-1.0 (-2.7; 0.1) |
Note. – ROI: region of interest; SCI: spinal cord injury; IQR: interquartile range.
*NHANES/Lunar data. **Toronto Rehab Protocol.
1. After age correction, the traumatic SCI group had lower Z scores at the hip and knee sites, but in the spine and forearm, the median Z score was lower in the nontraumatic SCI group. These data can be verified in Supplementary Material S Table 2.
S Table 2: Medians and interquartile ranges (IQRs) of Z scores of the different spinal cord injury (SCI) groups.
|
ROI/Z score |
SCI Trauma Median (IQR) |
SCI No Trauma Median (IQR) |
SCI + Brain Injury Median (IQR) |
|
Right total hip* |
-2.2 (-3.0; -1.3) |
-1.7 (-2.4; -0.6) |
-1.6 (-2.5; -0.7) |
|
Right femoral neck* |
-1.6 (-2.4; -0.7) |
-1.2 (-1.9; -0.4) |
-0.7 (-1.5; -0.1) |
|
Left total hip* |
-2.1 (-3.0; -1.2) |
-1.5 (-2.7; -0.7) |
-1.4 (-2.3; -0.5) |
|
Left femoral neck* |
-1.6 (-2.5; -0.7) |
-1.2 (-2.0; -0.4) |
-0.9 (-1.7; -0.1) |
|
Right distal femoral epiphysis** |
-1.8 (-3.2; -0.5) |
-1.7 (-2.8; 0.1) |
-1.7 (-2.4; 0.6) |
|
Right distal femoral metaphysis** |
-2.5 (-3.8; -1.5) |
-2.4 (-3.4; -1.5) |
-1.1 (-2.7; 0.1) |
|
Right proximal tibial epiphysis** |
-1.7 (-2.4; -0.9) |
-1.4 (-2.1; -0.9) |
-1.1 (-1.9; -0.3) |
|
Left distal femoral epiphysis** |
-1.9 (-3.2; -0.6) |
-1.6 (-2.6; 0.1) |
-0.7 (-2.1; 0.5) |
|
Left distal femoral metaphysis** |
-2.6 (-3.7; -1.6) |
-2.4 (-3.2; -1.6) |
-1.7 (-2.9; -0.5) |
|
Left proximal tibial epiphysis** |
-1.7 (-2.4; -1.1) |
-1.5 (-2.0; -1.0) |
-1.5 (-1.9; 0.2) |
|
Spine* |
-0.2 (-1.2; 1.5) |
-0.6 (-1.5; 0.8) |
-0.3 (-0.5; 1.7) |
|
Radius* |
-0.2 (-1.0; 0.5) |
-0.7 (-1.8; 0.1) |
-0.5 (-1.6; -0.1) |
Note. – ROI: region of interest; SCI: spinal cord injury; IQR: interquartile range.
*NHANES/Lunar data. **Toronto Rehab Protocol.
The RMS at the distal metaphysis of the femur was 0.069 g/cm2, with a coefficient of variation (CV) of 1.90% and an SD of 0.025 g/cm2. At the distal epiphysis of the femur, the RMS was 0.053 g/cm2, with an RMS-CV of 2.90% and an RMS-SD of 0.019 g/cm2. Finally, at the proximal epiphysis of the tibia, the RMS was 0.038 g/cm2, with an RMS-CV of 1.82% and an RMS-SD of 0.014 g/cm2.
DISCUSSION
The main finding of this study is the high prevalence of osteoporosis and fragility fractures in SCI participants [1-17]. These results are consistent with previous studies and provide additional information by stratifying the risk within SCI individuals and comparing the different groups of participants with SCI. Osteoporosis was observed in approximately one-fourth of our sample, which is lower than the findings of another study. [5] In that study, osteopenia or osteoporosis was identified in over 80% of SCI individuals. Osteoporosis had a higher prevalence among nontraumatic SCI patients, affecting almost half of the participants. The frequency of osteoporosis in the nontraumatic SCI group was more than twice as high as that observed in the traumatic SCI group. Fragility fractures occurred in more than one in ten participants, with a higher rate observed in the nontraumatic SCI group, affecting over one-fifth of participants. When comparing the rate of fragility fractures between the nontraumatic and traumatic SCI groups, the rate was almost twice as high. The frequency of fragility fractures was similar to that in a previous study17. However, compared to other studies, [3,15,23] the rate was lower, ranging from as high as 50%, [3] 25-46%15 and 46-49%. [23] We believe that the criteria used to diagnose fragility fractures, excluding traumatic fractures, may account for the lower frequency.
The chance of fragility fractures is nearly four times higher in SCI participants with osteoporosis than in those with normal BMD. These findings align with previous studies reporting [5-23] times 4 and [4.3] times 5 higher chance in SCI participants. Physicians providing care to patients with SCI should maintain a high index of suspicion for fragility fractures, as they occur frequently [5-8,11,14 16,21,23,25-28] and patients may not manifest pain. Therefore, clinicians should remain vigilant for fragility fracture signs such as edema, fever, increased spasticity, and autonomic dysreflexia [2,16].
Therefore, our findings have implications for the SCI patient management. Osteoporosis and fragility fractures are clinical concerns in this population, leading to heightened morbidity, prolonged hospitalization, and increased treatment expenses. Therefore, routine screening for changes in BMD should be implemented in SCI patients, aligning with current ISCD recommendations [6,29] and the collective evidence from various studies [6,8-10,16-18,20,22,28,29].
SCI participants exhibit lower BMD, particularly in the distal femur and proximal tibia [1,4,6,8,11,12,15,16,18-24] thereby amplifying the chance of fragility fractures [5 8,11,14-16,21,23,25-28], as underscored by multiple cited authors. Conversely, BMD measurements of the spine and forearm in SCI patients hold lesser significance since they lie above the level of neurological injury [8,10,17,18,20,30,34], as elucidated by these investigations.
SCI participants had lower BMD, especially in the distal femur and proximal tibia [1,4,6,8,11,12,15,16,18 24], increasing the risk of fragility fractures [5-8,11,14 16,21,23,25-28], as previously mentioned by numerous cited authors. The BMD measurement of the spine and forearm in SCI may be less significant, particularly in individuals with paraplegia, as these areas are located above the neurological injury level [8,10,17,18,29,34,35], as indicated by these studies. However, it is important to consider that in tetraplegic patients may still experience low BMD measurements in the spine and forearm.
As stated in our previous study [17], participants exhibited higher values of RMS, RMS-CV, and RMS-SD at the distal femur compared to the proximal tibia. Precision studies should be conducted at least once, although they do not require regular repetition. These studies aid in understanding changes of lesser magnitude that cannot be determined with a statistically significant level of confidence, and thus they assist in the interpretation of longitudinal studies [31]. Our findings regarding the knee ROI demonstrated comparable values at the distal femur and proximal tibia, in line with other authors’ findings [20,32,33]. The observed larger difference at the distal femur may be attributed to the position of the patella.
This study has limitations, including its cross sectional and retrospective design conducted at a single rehabilitation center. Therefore, the generalizability of the results to other populations or centers may be limited. However, to mitigate selection bias, all patients who underwent the examination were included. The DXA scans were performed by a radiologist with over 25 years of experience who followed the ISCD methodology. The potential risk factors for osteoporosis and fragility fractures in SCI patients, such as the duration or level of injury, were not assessed, but the focus of this study was on the type of SCI rather than the time of injury, as extensive research has already been conducted regarding the latter. The impact of interventions such as pharmacological treatment or rehabilitation on BMD and fracture risk in SCI patients was not evaluated, as it was not the primary objective of this study, which was not designed as a prospective longitudinal multicenter study.
CONCLUSION
In conclusion, our study highlights the high prevalence of osteoporosis and fragility fractures in SCI participants, particularly in those with nontraumatic SCI. Routine screening for osteoporosis and fragility fractures, along with the implementation of prevention strategies, should be considered in the management of these patients.
Clinical Trial Registration
http://conselho.saude.gov.br/plataforma-brasil conep?view=default: CAAE 53530021.8.0000.0022, 28/12/2021
Summary Statement
After spinal cord injury, there are specific bone mineral changes that need to be properly evaluated by dual-energy absorptiometry (DXA), and there is also a greater chance of fragility fractures.
Key Results
• The chance of fragility fractures is nearly four times higher in patients with spinal cord injury and osteoporosis then in those with spinal cord injury and normal bone mineral density (p=0.005).
• Osteoporosis was identified in 81/358 (22.6%) spinal cord injury participants, and fragility fractures were observed in 46/358 (12.9%) spinal cord injury participants.
• Osteoporosis (28/68, 41.2%) and fragility fractures (14/68, 20.6%) were more frequent in the patients with nontraumatic spinal cord injury.
ACKNOWLEDGMENTS
I would like to thank the Rede SARAH who made this study possible.
REFERENCES
19. Imamura M, Takami MDP, Barbosa SBB, Silva AR, Pinheiro CM, Guerra LMC. et al. Osteoporosis in spinal cord injury: rehabilitation. Acta Fisiatr. 2013; 20: 112-117.
29. International Society for Clinical Densitometry. The ISCD’s official positions (updated 2019). Washington, DC: ISCD,2019.


