Increased Phase Clustering in Epileptogenic Areas Measured with 256-Channel Dense Array EEG†
- 1. Department of Electrical Engineering, University of Washington, Seattle, WA 98195, USA
- 2. Department of Bioengineering, Reykjavik University, Reykjavik, Iceland
- 3. Department of Neurology, University of Washington, Seattle, WA 98195, USA
- 4. Department of Neurology, University of Washington, Seattle, WA 98195, USA
Abstract
Our objective is to examine if spatial phase clustering patterns are different in epileptogenic zones derived from high density interictal scalp EEG. We studied two patients with refractory epilepsy who underwent intracranial EEG to establish the localization of seizures. One patient had seizures originating from frontal and parietal areas; the other patient had seizures arising from right temporal parietal areas. Prior to invasive EEG studies, the subjects underwent dense array 256 channel EEG (dEEG) recordings. Three minutes of interictal dEEG data was selected for analysis. The selected segment was at least two hours from an epileptic seizure and, based on visual analysis, free of interictal epileptiform patterns. Data was imported into MATLAB for analysis. The EEG data was filtered in the appropriate EEG band. The phase was computed after taking Hilbert transform of the EEG data. Contour plots with 4 ms intervals were constructed using a montage layout of 256 electrode positions. Spatial plots revealed formation of cone-like structures which changed in spatial shapes from one frame to the next. In addition, the peak intensity varied from one frame to the next. In general, more stronger and stable patterns were observed in the seizure area as compared with nearby surrounding brain areas. A clustering of spatial patterns was also observed which was denser in the seizure areas as compared with nearby surrounding areas. These preliminary results show that the spatiotemporal dynamics and clustering of phase cone patterns have a potential to localize the epileptic zones from the scalp dEEG data
Citation
Ramon C, Holmes MD, Freeman WJ (2013) Increased Phase Clustering in Epileptogenic Areas Measured with 256-Channel Dense Array EEG†. J Neurol Transl Neurosci 2(1): 1029
Keywords
• Epilepsy
• Electrocorticograms
• Seizure
INTRODUCTION
We report our preliminary results which show that there are increased clustering of spatial phase patterns in the vicinity of epileptogenic zones. The phase patterns were derived from high density, 256-channel, scalp interictal EEG data, also called dEEG data. This was done by examining the formation of phase cluster patterns in theta (3-7 Hz), alpha (7-12 Hz), beta (12- 30Hz) and the low gamma (30-50 Hz) bands. We found that the rate of formation of stable phase cluster patterns was higher in the seizure area as compared with nearby seizure-free areas. This finding has the potential to localize the epileptogenic zones noninvasively.
Phase patterns appear like bubbles in boiling water, often have cone-like structure, form phase clusters and also show phase modulation waves in different EEG bands, e.g., alpha and gamma bands [1,2]. Previous research has demonstrated that before and during a seizure episode, (1) the phase cone gradient increased, and (2) frame velocity and the diameter of phase cones decreased [1,2]. An increase in EEG phase clustering in the gamma band has also been observed in epileptiform activity in patients with visual sensitivity [3] and in electrocorticograms (ECoG) before the start of seizures [4]. In contrast, our work reported here focuses on “silent” epilepsy related activity to interictal periods when there is no ictal or interictal epileptiform activity in the dEEG data.
MATERIALS AND METHODS
Our procedures for data collection and analysis have been described previously [5,6]. Only a brief summary is given here. Epileptic seizure areas in patients were localized with intracranial subdural ECoG recordings with 8×8 contact grid electrodes and also with subdural strip electrodes. The electrodes on the grid had an exposed surface area defined by 2.3 mm diameter and with center-to-center, inter-electrode separation of 1.0 cm [7]. The strips had the same size electrodes with the same inter-electrode separation. Prior to this during presurgical evaluations, high density 256-channel scalp EEG data was collected continuously for 3-5 days. The data was collected with an EEG system developed by Electrical Geodesics, Inc. (Eugene, OR, USA). The electrode caps were filled with a conducting gel with an effective diameter of approximately1.0 cm. For an adult head, from the center of one electrode to the other, the inter-electrode separation is approximately 2.0 cm [8]. The data was collected with a sampling rate of 250 Hz, i.e., the time difference between each sample was 4 ms. We used data of two adult subjects. Both were candidates for resection surgery and after surgery they were free of epileptic seizures. Subjects were not on any medication during dEEG and ECoG monitoring. All data were collected at the Regional Epilepsy Center, University of Washington under the authorized human subject’s protocol. For each subject, we selected data on one randomly selected day for analysis. For the selected day, approximately 10 min long of seizure-free and spike-free data during sleep was selected for analysis. The selected data sets were at least two hours away from any observed seizure activity. Out of this, a continuous 3 min long data was randomly selected and imported into MATLAB for further analysis. The raw EEG data was normalized to their common averaged reference. Excessively noisy channels were eliminated by replacing them with the averages of their neighbors. For each subject, there was only one noisy channel.
The 60 Hz power line artifact was eliminated with a matching pursuit filter [8]. EEG Data was filtered using a FIR bandpass filter in the appropriate EEG band and Hilbert transform was applied to compute the analytic phase. The phase of the analytic signal has a sawtooth pattern which was unwrapped to produce a cumulative linear phase of the signal and then its temporal derivative was computed. From this, the instantaneous phase frequency was computed. Examples of an EEG filtered in the low gamma band, its Analytic amplitude and instantaneous phase frequency, Fi, are given in the figure. Sharp peaks in Fi are due to episodic phase slips in EEG data which are accompanied by a large drop in the Analytic amplitude. The stable phase clusters were searched where Fi did not have sharp peaks. The Fi was limited to 30-50 Hz while searching for the stable phase clusters in the low gamma band.
The rate of change in the phase with distance (rad/mm) was computed from spatial location of the electrodes on the scalp. Several criteria were applied to select stable phase cone patterns. These included: (1) phase frequency was within the temporal band, e.g., 30-50 Hz for low gamma band, (2) sign of spatial gradient and maximum or the minimum did not change for at least three time samples, and (3) the frame velocity should be within the range of conduction velocities of cortical axons, 1-10 meters/sec [9,10]. Based on these criteria, a stable cluster of frames in each second long dEEG data was computed and an average rate of phase clusters over a period of 120 seconds was computed. Color intensity plots of an average rate of phase clusters were constructed using a montage of the layout of 256 electrode positions displayed as if one was looking on top of the subject’s head. A typical layout of spatial plots is given in Figure 1, 2.
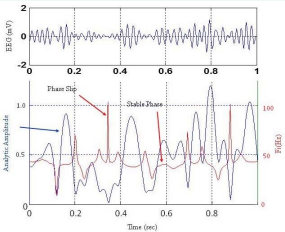
Figure 1 (Top) EEG trace filtered in low gamma band, (bottom) Analytic amplitude and phase frequency. Also showing the location of phase slips where EEG and analytic amplitude both have low values. The stable phase values in the low gamma band will be in the range of 30-50 Hz.
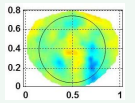
Figure 2 A typical layout of instantaneous EEG phase based on the 256 electrode positions. The nose is on the top. The ellipse encloses the area covered by electrodes above the eye level but excludes the electrodes on the forehead.
The nose is on the top, back of the neck is at the bottom, left of the subject is on the left side of the plot and right side of the subject is on the right side of the plot. The horizontal and vertical axes are in normalized length units.
RESULTS AND DISCUSSIONS
The stable phase cluster rate (frames/sec) over a 120- sec period for the subject #1 in different EEG bands is given in Figure 3.
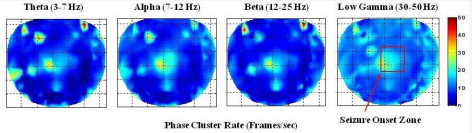
Figure 3 Contour plots of stable phase cluster rate (frames/sec). The seizure onset area is marked as a rectangle. The rate is higher in and in the vicinity of the seizure onset area.
It shows that the rate is higher in the seizure onset zone which is marked with a red rectangle and it was measured with subdural grid recordings. This subject had epilepsy in the central midline area, slightly toward the right. The nose is on the top in each plot. The increase in phase cluster rates in the seizure onset zone is present in all four EEG bands. The strongest showing is in the low gamma band. There are also visible hot spots in the left and right frontal areas. These probably are due to eye motion or muscle artifacts from the face or the forehead.
The subject #2 had complex seizure patterns in the right mid temporal and parietal areas. The spread of the seizure activity was seen in the grid and strip electrode recordings. The stable phase cluster rate (frames/sec) over a 120-sec period for this subject in different EEG bands is given in Figure 4.
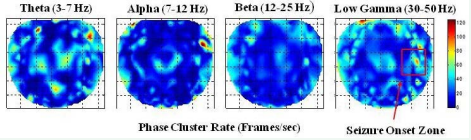
Figure 4 Contour plots of stable phase cluster rate (frames/sec) for the subject #2. It shows higher cluster rate in the theta and low gamma bands.
These plots show that the rate is higher in the seizure onset zone marked with a rectangle. It is most recognizable in the low gamma band. There is very low increased activity in the beta band. There are many hot spots in the theta band. The hot spots in the front left and right left, most probably, are due to the muscle activity on the forehead. The observed activity in the mid central and parietal areas could be related to other cognitive tasks in the brain that might not have any correlation with the silent seizure related activity during interictal periods. The alpha band also shows in the central midline area. It also has a hot spot in right frontal area which possibly could be a muscle artifact in right temporal area or possibly could be related to the epileptic activity.
CONCLUSIONS
These results indicate that the phase clustering activity is higher in and around the vicinity of the seizure onset zones for both patients. This increased phase clustering activity was noticeable in all four EEG bands for the subject #1. However, for the subject #2 it was clearly visible in the low gamma band, distributed in a large area near to the seizure onset zone in the theta band, and somewhat visible in the alpha and beta bands. For both patients, the low gamma band is a good choice to observe this increased phase clustering activity. This activity is derived from the seizure-free, epileptiform-free interictal scalp dEEG data. These findings may reflect a novel interictal marker for epileptogenic zones. We believe that phase clustering represents scalp EEG correlates of the intracranial EEG findings found in the subdural 64-channel minigrid recordings which documented changes in the diameter and the velocity of phase cones observed earlier [1,2]. This has a potential for noninvasive localization of the seizure onset zones. The limitations will be due to the fact that the other areas of the brain, away from seizure onset zones, also exhibit increased phase cluster activity due to other cognitive or background activity of the brain. Further studies are needed with more patients to confirm our preliminary findings and to improve this technology to differentiate the seizure related phase clustering activity from the other activities of the brain.


