Neuroimaging in Multiple Sclerosis
- 1. Department of Neurology, University of Yildirim Beyazit, Turkey
- 2. Department of Neurology, Ataturk Education and Research Hospital, Turkey
Abstract
Neuroimaging in Multiple Sclerosis (MS) is now dominated by Magnetic Resonance Imaging (MRI). MRI has played a central role in the clinical management and scientific investigation of MS. Findings on MRI studies of the brain and spinal cord are critical for diagnosing MS, monitorizing treatment response and predicting disease progression in individual patients. Conventional MRI techniques are used to assess overt lesions and atrophy in the central nervous system and include T2-weighted imaging, proton density-weighted imaging, pre and post gadolinium enhanced T1-weighted imaging, and Fluid-Attenuated Inversion-Recovery images (FLAIR). Nonconventional MRI techniques such as proton Magnetic Resonance Spectroscopy (H-MRS), Magnetization Transfer Imaging (MTI), Functional Magnetic Resonance Imaging (fMRI), Diffusion Weighted Imaging (DWI), Diffusion Tensor Magnetic Resonance Imaging (DT-MRI), Double Inversion Recovery (DIR) techniques have increased our understanding of the pathogenesis of MS. In this review, we will focus on the role of MRI in the diagnosis and management of MS.
Keywords
• Multiple sclerosis
• Conventional magnetic resonance imaging
• Nonconventional magnetic resonance imaging
Citation
Temel ?, Vural G, Deniz O, Bekta? H, Kekliko?lu HD (2014) Neuro?mag?ng in Mult?ple Scleros?s. J Neurol Transl Neurosci 2(2): 1048.
ABBREVIATIONS
MRI: Magnetic Resonance ?maging; MS: Multiple Sclerosis; FLAIR: Fluid-Attenuated ?nversion-Recovery ?mages; H-MRS: Proton Magnetic Resonance Spectroscopy; MTI: Magnetization Transfer ?maging; fMRI: Functional Magnetic Resonance ?maging; DWI: Diffusion Weighted ?maging; DT-MRI: Diffusion Tensor Magnetic Resonance ?maging; DIR: Double ?nversion Recovery; EDSS: Kurtzke Expanded Disability Status Scale; CSF: Cerebrospinal Fluid; NAA: N-Acetyl Aspartat; NAWM: Normal Appearing White Matter; MTR: Magnetic Tranfer Ratio; SPMS: Secondary Progressive Multiple Sclerosis; RRMS: Relapsing Remitting Multiple Sclerosis; ADC: ApparentDiffusion Coefficient; FA: Fractional Anisotropy; CIS: Clinically ?solated Syndrome
INTRODUCTION
MRI has come to have an increasingly important role in the diagnosis and management of MS, because it has been shown to increase diagnostic specifity and to augment the assessment of treatment in this heterogeneous disease. Also, over the last few years, findings from conventional MRI techniques as well as those from more recently developed nonconventional MRI techniques have converged with findings from other areas of MS researchs (e.g. hystopathological and clinical research) to give us a physiopathology of MS [1]. The present review aims describing some of the MRI techniques which are commonly used for understanding MS pathology, diagnosing MS and monitorizing MS.
CONVENTIONAL MRI TECHNIQUES IN MS
Conventional MRI measures alternations in tissue water content and dynamics by proton excitation, thus enabling visualization of edema, inflammation, demyelination and axonal damage in MS lesions. Conventional MRI techniques include T2- weighted imaging, proton density imaging, FLAIR imaging, T1- weighted imaging ve gadolinium enhanced T1-weighted imaging [2].
T2-weighted imaging
T2 contrast is the key feature that gives these approaches a high sensivity for depicting focal white matter lesions in MS. The T2 hyperintense lesions occur due to water compartmant changes in pathologic tissue. In MS, multiple hyperintense lesions are seen on T2-weighted images with periventriculer predominance [3]. MS lesions are primarily found in white matter but also in gray matter and are often seen periventricular regions, corpuscallosum, juxtacortical gray-white matter junction and infratentorial brain regions (brain stem, middle cerebellar peduncles and cerebellar white matter in the posterior fossa) (Figure 1A)
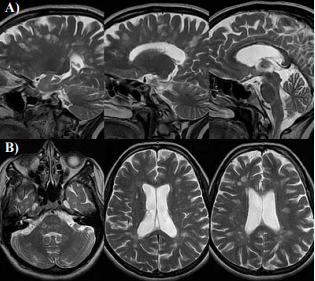
Figure 1 Axial T2 images show multiple bilateral T2 hyper intensities involving periventricular white matter, corpus callosum, brainstem and serebeller white matter . On saggital T2 sections most of the lesions are perpendicular to lateral ventricle-Dawson’s finger.
[4,5]. Dawson fingers are seen best on saggital images and refer to the oval elongated lesions in the corona radiata and centrum semiovale (Figure 1B) [2,6]. These lesions are oriented lesions along subependymal veins that are perpendicular to ventricule. Although the great majority of brain lesions in MS are smaller than 5 mm in diameter large lesions occasionally ocur [2,7]. Between 50% and 90% of MS patients show hyperintense T2 lesions in the spinal cord, more frequently located in the cervical and the thoracic area [2,8]. Cord lesions are usually located peripherally. Acute lesions may be associated with cord swelling [2,9,10]. T2 hyperintense lesions reach maximum volume after 4-8 weeks later when they are been formed and begin to shrink within 2-12 weeks. At the end they remain as a small residue T2 hyperintense area. Rarely, lesions demostrates peripheral or central activations. It means that severe cumulative disease may develop and remyelisation capacity may be imply [12]. For this reason total lesion volume which is measured from this images can be used as a important marker of disease destruction. Alternations of the T2 hyperintense lesion volume and count over time can be used as a marker of disease activity and response to the treatment [13]. Alternation in lesion volume in the first five years as measured by Kurtzke Expanded Disability Status Scale (EDSS) score was significantly correlated with long-term disability [14]. In patients with established MS, the correlation between the abnormalities seen on T2 sequences and disability is weak to moderate depending on the population studied. The T2 and FLAIR lesion load reflects the accumulation of gross tissue changes. Although newly formed or enlarging T2 lesions indicate new areas of MS-related tissue damage, all T2 hyperintensities are nonspecific with respect to the actual pathological changes within lesions [15].
In addition to white matter hyperintensities on T2-weighted image, grey matter hypointensities can be seen in MS. This hypointensities reflect pathologic iron storage and brain degeneration [16-18].
Proton density-weighted imaging
It can be diffucult to show periventriculer lesions on T2- weighted images because both Cerebrospinal Fluid (CSF) and lesions are seen hyperintense. A way to show better that lesions is to obtain proton density-weighted images [19]. CSF is hypointense and lesions are hyperintense in this images [10].
FLAIR imaging
Another method which increase contrast between CSF and lesion is FLAIR imaging [19]. This method supresses signals coming from CSF. FLAIR images determine the differences better between CSF and periventriculer hyperintensities on T2 and increase contrast of jukstracortical and cortical lesions [20].
T1-weighted imaging
T1-weighted images are less sensitive to determine gliosis and alternation of water content than T2-weighted images. If acute inflammatory lesions contain too much edema, they can be seen hypointense on T1-weighted images. Most of hyperintense lesions on T2-weighted images are isointense on T1-weighted images like normal white matter. Cronic hypointensities on T1-weighted images are more spesific marker of structure destruction than hyperintensities on T2-weighted images [21- 23]. Black hole is the name of hypointense lesion on T1-weighted images (Figure 2)
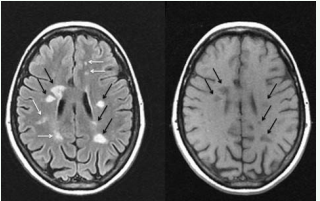
Figure 2 Bright spots represent lesions on a FLAIR image. Black arrows show up as persistent black holes on T1 images.
[24]. Black holes indicates that related area has had severe damage previously and axonal density has increased histopathologically in this areas. While there is a poor correlation between count and volume of T2 hyperintense lesion and disability, there is a strong correlation between count of black hole and disability [25]. In a recent study Cid et al [26] has investigated that relationship between degree of hypointensities on T1-weighted images at relaps time, differences of EDSS at relaps time and a mount later from relapse time and neuronal apoptosis in CSF neuronal cultures at relaps time. Their results indicates that there is a strong correlation between T1-weighted hypointensities and poor recovery and amount of neuronal apoptosis in CSF.
Gadolinium enhanced T1-weighted imaging
An important step forward in the assesment of MS by MRI was introduction of gadolinium. Gadolinium is normally excluded from the parenchyma by the blood brain barrier (BBB) and so the presence of enhancement indicates an increase in vascular permeability [27]. There are various patterns of gadolinium enhancement in MS lesions that usually persists for 2 – 6 weeks: homogeneous, heterogeneous, punctuate, ring, open ring enhancing and tumor-like (Figure 3).
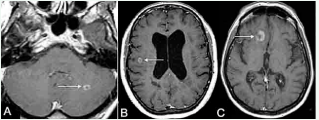
Figure 3 Axial postcontrast T1-WI demonstrates concentric ring-enhancing lesions (arrows) in the infratentorial (a) and periventricular (b) regions. Characteristic open-ring enhancing lesion with increased specificity for MS (c).
Gadolinium enhanced T1- weighted images are helpful for to seperate cronic lesions and acute inflamatory lesions. In fact, disease activation radiologically has evaluated gadolinium enhacement in MS [28,29].
NONCONVENTIONAL MRI TECHNIQUES
Conventional MRI is unable to disclose the extent of the damage because of its limited sensitivity to structural changes outside the focal lesions and its lack of specificity to the heterogeneous features of the disease. Neurological impairment of patients with MS is poorly associated with the lesion load observed on conventional MRI scans. During the past decade, other nonconventional MRI techniques including H-MRS, MTI, fMRI, DWI, DT-MRI, DIR techniques have been developed to improve the sensitivity and specificity in the detection of MS lesions and characterize and quantify the heterogeneous pathological substrates of the disease [2, 27, 30].
Proton manyetik rezonance spectroscopy
H-MRS is making a significant contribution to our understanding of pathogenesis of MS but it hasn’t established a place in routine diagnostic practise. Instead of studying water protons, spectroscopy investigates other protons containing methabolites. While N-Acetyl Aspartat (NAA) is the marker of axonal integrity in MS, coline and lactat are related with acute inflamation and demyelinisation. In acute MS, coline, creatine and lactat have increased at early stage on H-MRS with short and long relaxation time. Lipids can be increased temporarily on short echo H-MRS. All the alternations are accompanied by a decrease in NAA. It is thought to be that decreasing NAA is secondary to axonal disfunction, because NAA is a metobolite which is found in neurons densly [25]. Although lactat and creatine levels have came down to normal values within a few days after acute stage, improvement of lipids and myoinositol levels have taken a few mounts [31,32]. Glutamate levels were found to be increased in acute lesions. A reduced concentration of glutamate and glutamine in the cortical grey matter of patients with primary progressive multiple sclerosis (PPMS) has been found, which was significantly correlated with the EDSS score [33]. Recently, the concentration of glutathione, a marker of oxidative status, was measured by H-MRS at 7.0 T and was found decreased in the normal appearing white matter [NAWM] and gray matter of MS patients compared to healthy controls [34]. MRS may provide insight into MS pathogenesis, evaluate the severity of MS and follow disease evolution and therefore is becoming a useful tool in the understanding of the disease. Moreover, MRS measures of brain metabolities [2,27].
Magnetization transfer imaging
Magnetization transfer is a physical phenomenon in which protons of two or more environments with different magnetic resonance properties exchange magnetization. MTI measures quantitatively the continuous exchange of magnetization in the brain tissue between macromolecular bound protons (i.e. protons associated with myelin, cell membranes and proteins) and protons in adjacent free water molecules, thus allowing the calculation of an index, the magnetic tranfer ratio (MTR) [35]. Values of MTR are reduced in MS lesions accordance with degree of hypointensities on T1-weighted images. This condition is related with destruction of tissue [36-38]. The MTR reduction in MS lesions and NAWM has been related to the percentage of residual axons and the degree of demyelination [39]. The magnetic transfer derived measures are sensitive to MS related changes in short periods and can provide evidence predicting the accumulation of clinical disability [40]. Reduction of MTR values is more prominent on inflammatory lesions [41]. In addition to alternation of MTR values on MS lesions. A few studies have suggested that MTR values are reduced on NAWM of MS patients compared with healthy volunteers [38,42-45]. Recent studies have found that reduction of MTR values in secondary progressive multiple sclerosis (SPMS) patients were more significant than relapsing remitting multiple sclerosis (RRMS) patients [46,47].
Also, reduction of MTR is related disability measuring with EDSS and cognitive damage [48-50].
FUNCTIONAL MAGNETIC RESONANS IMAGING
FMRI is a functional neuroimaging procedure using MRI technology that measures brain activity by detecting associated changes in blood flow. This technique relies on the fact that cerebral blood flow and neuronal activation are coupled [51,52]. The most common finding in fMRI studies is increased extent or strength of activation of functional tissue in MS patients compared with controls, implying compensatory processes or reorganization of neuronal activation. A Study has showed that even in patients who had only one attack have increased activation at contralateral primary sensorymotor cortex on fMRI [53,54].
Diffusion weighted imaging and diffusion tensor magnetic resonance imaging
Diffusion imaging is a quantitative, magnetic resonance based technique potentially useful for the study of MS, due to its increased pathologic specificity over conventional MRI and its ability to assess in vivo the presence of tissue damage occurring outside T2 visible lesions. Studies have shown that apparent diffusion coefficient (ADC) is higher MS lesions. Quantitative variables derived from DT-MRI were found to correlate with clinical disability (Figure 4).
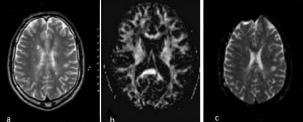
Figure 4 T2 weighted (a) and diffudion tensor images (b: FA map, c: ADC map) in MS.
Low values of fractional anisotropy (FA) and high values of mean diffusivity (MD) have been reported in lesions and NAWM. DT-MRI findings in MS lesions appear to relate to different pathological features of tissue damage. DT-MRI of post mortem MS brain and longitudinal studies have demonstrated that DT-MRI is sensitive to the evolution of tissue damage within MS lesions. Associations between DT-MRI measures in MS brains and clinical disability. have also been investigated, although with conflicting findings. md values are higher in patient with SPMS than RRMS. FA have been shown to be decreased in NAWM of patients with MS but on lesions FA decreases is more prominenet.the greatest FA decreases typically being found black holes correlating with tissue destruction [55-59].
Double inversion recovery imaging
DIR is a novel imaging method that has markedly improved the sensitivity of MRI to detect cortical lesions in vivo [60]. Cortical demyelination is an important part of the disease process, especially in more advanced stages and may contribute to the accumulation of irreversible disability in MS [61-63]. Cortical lesions have been detected in all the major MS clinical phenotypes, including patients with Clinically ?solated Syndrome (CIS) suggestive of MS. Remarkably, cortical lesions are more frequently seen in patients with SPMS than in those with CIS or RRMS. Moreover, patients with early RRMS have a greater number of lesions than patients with benign MS. Longitudinal studies have shown that new cortical lesions continue to form in patients with early RRMS and in those with the progressive disease phenotypes over 1 to 2-year periods of follow-up [64-66].


