The Clinical Value and Biomarker Potential of HPGDS in Diagnosing Eosinophilic Chronic Rhinosinusitis with Nasal Polyps
- *. Contributed Equally- Author order was determined by drawing straws
- 1. Department of Otorhinolaryngology Head & Neck Surgery, The Affiliated Fuyang People’s Hospital of Anhui Medical University, China
- 2. Department of Otorhinolaryngology Head & Neck Surgery, The Affiliated Fuyang Hospital of Bengbu Medical College, China
- 3. Department of Otorhinolaryngology Head & Neck Surgery, Fuyang People’s Hospital, China
Abstract
Background: Eosinophilic Chronic Rhinosinusitis with Nasal Polyps (eCRSwNP) is a subtype of chronic rhinosinusitis characterized by prominent eosinophilic inflammation. Identifying reliable biomarkers is essential for precise and accurate diagnosis. This study integrates bioinformatics analysis, machine learning approaches, and experimental validation to identify and evaluate potential diagnostic biomarkers for eCRSwNP.
Methods: Differentially Expressed Genes (DEGs) were identified through gene expression analysis. Key candidate genes were selected using Weighted Gene Co-Expression Network Analysis (WGCNA), Least Absolute Shrinkage And Selection Operator (LASSO) regression, and Support Vector Machine (SVM) algorithms. Quantitative PCR (qPCR) and Immunohistochemistry (IHC) were conducted to experimentally validate the differential expression of HPGDS between eCRSwNP and non-eCRSwNP patient samples. Correlation analyses with clinical parameters, logistic regression modeling, and Receiver Operating Characteristic (ROC) curve analyses were subsequently performed.
Results: HPGDS demonstrates significant upregulation in eCRSwNP tissues and correlates with multiple disease indicators, including serum IgE levels, blood eosinophil counts and percentages, tissue eosinophil counts and percentages, Lund-Mackay score, improved Lund-Kennedy score, and certain pathological parameters. Logistic regression analysis and ROC curve analysis demonstrated that HPGDS has high diagnostic accuracy in distinguishing eCRSwNP from non-eCRSwNP.
Conclusion: HPGDS may serve as a valuable biomarker for eCRSwNP, offering a novel reference for precise diagnostic evaluation and clinical decision- making.
Keywords
• eCRSwNP
• CRSwNP
• HPGDS
• JESREC Score
• Precision Medicine
Citation
Luo M, Zhang W, Han J, Chang Y, Yin X (2025) The Clinical Value and Biomarker Potential of HPGDS in Diagnosing Eosinophilic Chronic Rhinosinusitis with Nasal Polyps. Ann Otolaryngol Rhinol 12(5): 1373.
INTRODUCTION
Chronic Rhinosinusitis With Nasal Polyps (CRSwNP) is a prevalent chronic inflammatory condition affecting approximately 5–7% of the global population [1]. It is characterized by persistent sinus mucosal inflammation, formation of nasal polyps, nasal obstruction, and olfactory dysfunction [2,3]. These symptoms significantly impair patient quality of life and impose considerable burdens on healthcare systems [4,5].
Recently, CRSwNP has been subdivided based on the extent of eosinophilic infiltration within the nasal mucosa into eosinophilic CRSwNP (eCRSwNP) and non-eosinophilic CRSwNP (neCRSwNP) [6]. Notably, eCRSwNP has drawn significant attention due to its higher recurrence rates, more severe clinical manifestations, and increased requirement for medical interventions [6].
Despite clear clinical and immunological distinctions between eCRSwNP and neCRSwNP, standardized diagnostic criteria to accurately differentiate between these subtypes remain lacking. Histological examination, involving eosinophil counting per High-Power Field (HPF) Following Hematoxylin-Eosin (HE) staining, is currently considered the gold standard for diagnosing eCRSwNP. However, the threshold for eosinophil count varies considerably across studies, ranging from 5 to 350 eosinophils per HPF [7,8].
Some studies have also proposed the quantification of patient symptom characteristics, biochemical markers, and imaging scores for diagnosing eCRSwNP. For instance, the Japanese researchers introduced the Japanese Epidemiological Survey of Refractory Eosinophilic Chronic Rhinosinusitis (JESREC) scoring system, where a score of ≥11 points indicates eCRSwNP [9,10]. Furthermore, multiple studies have attempted to identify molecular biomarkers for the classification of CRSwNP subtypes, although most of these efforts are still in the exploratory phase and lack definitive clinical validation [11,12].
Currently, several significant challenges exist in diagnosing CRSwNP subtypes: absence of standardized histological criteria, limitations of JESREC score applicability, and the lack of universally accepted molecular diagnostic biomarkers. These issues undermine the precision of clinical diagnosis, obstruct personalized therapeutic approaches and precise prognostication, limit comparability across research studies, and delay the clinical translation of biomarkers. Consequently, these gaps restrict comprehensive exploration of eCRSwNP and neCRSwNP in both fundamental and clinical research.
Recently, interest in applying biomarkers for CRSwNP subtype diagnosis has grown significantly. It has demonstrated that inflammation-related genes, chemokines, and cytokines are critically involved in CRSwNP pathogenesis. For example, cystatin SN (CST1), a protein secreted by epithelial cells, is markedly elevated in eCRSwNP tissues and promotes eosinophil activation and infiltration via the IL-5 pathway. Other molecular candidates such as the IL-33/sST2 axis, B-cell Activating Factor (BAFF), and multiple Th2-associated factors have also been implicated in defining CRSwNP endotypes and predicting postoperative recurrence. Nevertheless, despite ongoing efforts to elucidate molecular mechanisms differentiating eCRSwNP from neCRSwNP, reliable and validated biomarkers to distinguish these two subtypes remain elusive.
Addressing this gap, the present study employs an integrative approach combining bioinformatics analyses and machine learning methods to screen and experimentally validate key genes highly expressed in CRSwNP tissues. Our preliminary analyses identified Hematopoietic Prostaglandin D Synthase (HPGDS) as significantly upregulated in eCRSwNP tissues compared to both normal and neCRSwNP tissues, with statistically significant expression differences between eCRSwNP and neCRSwNP groups (P < 0.05).
HPGDS, a critical enzyme closely associated with inflammation and immune regulation, has previously been implicated in various allergic inflammatory diseases, yet its precise role in eCRSwNP pathogenesis remains incompletely understood. To further validate the potential diagnostic value of HPGDS in eCRSwNP, we retrospectively collected clinical and pathological information from patients and found significant correlations between HPGDS expression levels and serum total IgE, blood and tissue eosinophil counts and ratios, subepithelial edema, and the Improved Lund-Kennedy score. Univariate logistic regression analysis and Receiver Operating Characteristic (ROC) curve analysis were used to evaluate its diagnostic performance. The results indicated that HPGDS has strong diagnostic potential and could serve as a biomarker for diagnosing eCRSwNP.
MATERIALS AND METHODS
Identification of Differentially Expressed Genes (DEGs), Pathway Enrichment, and Weighted Gene Co Expression Network Analysis (WGCNA)
The gene expression profile GSE72713 was obtained from the Gene Expression Omnibus (GEO) database of the National Center for Biotechnology Information (NCBI) (http://www.ncbi.nlm.nih.gov/geo/) and analyzed using the R package DESeq2. This dataset includes RNA sequencing data derived from tissue samples from patients diagnosed with eCRSwNP and neCRSwNP. Differential gene expression analysis between groups was performed using the Wilcoxon test. DEGs were defined based on statistical significance (p-value < 0.05) and fold change magnitude (|logFC| > 1). Gene Ontology (GO) and Kyoto Encyclopedia of Genes and Genomes (KEGG) enrichment analyses of DEGs were conducted using corresponding R packages. Following DEG identification and enrichment analysis, WGCNA was performed using the R package WGCNA to identify gene co-expression modules associated with CRSwNP pathogenesis.
Key Gene Screening via LASSO Regression and SVM RFE
Genes identified from the intersection of DEGs and WGCNA results were selected as candidate biomarkers. To further screen for genes with strong predictive potential, Least Absolute Shrinkage and Selection Operator (LASSO) regression was conducted using the R package glmnet. Meanwhile, Support Vector Machine Recursive Feature Elimination (SVM-RFE) was implemented using the R package caret to iteratively refine the candidate gene set, identifying key genes closely associated with disease onset and progression.
Patient Inclusion and Exclusion Criteria
Patient inclusion criteria were defined based on the European Position Paper on Rhinosinusitis and Nasal Polyps (EPOS) 2020 guidelines [1]: (1) age > 18 years; (2) presence of at least two symptoms lasting ≥ 12 weeks, with nasal obstruction or nasal discharge (anterior/posterior nasal drip) required as one symptom, optionally accompanied by facial pain/pressure and/ or smell impairment; (3) endoscopic evidence of nasal polyps or polypoid mucosal changes within the sinuses or middle meatus. Exclusion criteria included: (1) history of corticosteroid, antihistamine, or antibiotic use within 4 weeks prior to surgery; (2) diagnosis of aspirin intolerance, primary ciliary dyskinesia, or cystic fibrosis; (3) incomplete clinical or pathological information.
Nasal polyp tissues were collected from patients diagnosed with CRSwNP. As controls (NC group), nasal mucosa samples were collected from the middle turbinate or inferior turbinate mucosa of patients undergoing Turbinoplasty solely due to Chronic rhinitis. Exclusion criteria for the NC group included any history of sinus diseases, allergic rhinitis, asthma, or other allergic conditions. Nasal mucosal or polyp tissues were collected postoperatively for histopathological confirmation. This study adhered strictly to the principles outlined in the Declaration of Helsinki.
Sample Size Calculation
According to the diagnostic criteria proposed by Tokunaga et al. [9], eCRSwNP was defined by a Japanese Epidemiological Survey of Refractory Eosinophilic Chronic Rhinosinusitis (JESREC) total score ≥ 11, which incorporates four dimensions: disease extent, nasal polyp presence, Computed Tomography (CT) shadowing, and peripheral blood eosinophil percentage (Table S1 for detailed criteria). Sample size estimation was based on differences in mean and Standard Deviation (SD) of HPGDS protein expression levels between eCRSwNP and neCRSwNP groups, setting the sample size ratio at 1:1, type I error (α) at 0.05, and type II error (β) at 0.1. PASS 15 software was used to determine the required minimum sample size. With HPGDS protein expression levels of 0.1565 ± 0.03857 for eCRSwNP and 0.005500 ± 0.003853 for neCRSwNP, the minimum calculated sample size was 12 patients per group. Ultimately, nasal polyp tissues from a total of 48 patients were collected, comprising 24 eCRSwNP and 24 neCRSwNP cases.
Patient Data Collection and Histopathological Assessment
Demographic data, including age, gender, Body Mass Index (BMI), and relevant medical history, were collected from eCRSwNP and neCRSwNP patients. Clinical evaluations included preoperative CT imaging, scored according to the Lund-Mackay system, and nasal endoscopic findings, assessed via the modified Lund-Kennedy scoring system [13-15]. Tissue samples underwent histological examination using Hematoxylin-Eosin (HE) staining. Pathological features were evaluated and scored following the grading criteria described by Smith et al. [16,17], assessing lesion severity based on: subepithelial edema (0 = none, 2 = mild, 3 = moderate, 4 = severe); eosinophil infiltration (1 = negative, 2 = aggregated, 3 = diffuse); goblet cell hyperplasia (0 = none, 2 = mild, 3 = moderate, 4 = severe); and degree of inflammation (0 = none, 2 = mild, 3 = moderate, 4 = severe). All assessments were independently conducted by experienced clinical and pathological experts.
Quantitative Real-Time PCR (qRT-PCR)
Collected tissues were split: one aliquot stored at -80°C for molecular analysis, the other fixed in 4% PFA (14h), paraffin-embedded. RNA was extracted (TRIzol), reverse transcribed (SweScript All-in-One Blue RT SuperMix, Servicebio), and quantified by qPCR (2×Universal Blue SYBR Green Master Mix, Servicebio). The relevant Primer sequences are shown in Table S2.
Table 2: Comparison of Clinical Characteristics and Pathological Characteristics Between eCRSwNP and neCRSwNP Groups
|
Variables |
Total1 (n = 48) |
neCRSWNP1 (n = 24) |
eCRSWNP1 (n = 24) |
P2 |
|
Serum total IgE (IU/ml) |
103.23 (27.96) |
83.53 (18.50) |
122.93 (21.10) |
<0.001 |
|
Blood eosinophil counts(×10^9/L ) |
0.34 [0.27, 0.41] |
0.29 [0.23, 0.40] |
0.39 [0.32, 0.44] |
0.014 |
|
Blood leukocyte count (×10^9/L ) |
2.93 [2.46, 3.61] |
2.92 [2.44, 3.54] |
3.08 [2.51, 3.61] |
0.910 |
|
Blood eosinophil percentage (%) |
4.95 [1.88, 6.35] |
1.85 [1.40, 2.85] |
6.40 [5.20, 7.73] |
<0.001 |
|
Blood leukocyte percentage (%) |
53.04 (8.24) |
54.84 (7.53) |
51.24 (8.68) |
0.132 |
|
Tissue eosinophil counts (n/HPF) |
27.50 [19.00, 50.25] |
19.00 [16.00, 22.00] |
49.50 [39.75, 54.75] |
<0.001 |
|
Tissue eosinophil percentage (%) |
17.75 [5.98, 26.80] |
5.95 [5.15, 6.73] |
26.00 [22.20, 30.35] |
<0.001 |
|
Lund-Mackay score |
10.33 (2.61) |
9.63 (2.98) |
11.04 (2.01) |
0.059 |
|
Improved Lund-Kennedy score |
7.85 (2.36) |
7.38 (2.36) |
8.33 (2.32) |
0.162 |
|
Subepithelial edema(score) |
2.50 [2.00, 4.00] |
2.00 [2.00, 2.25] |
4.00 [2.75, 4.00] |
0.008 |
|
Degree of inflammation(score) |
3.00 [2.00, 3.00] |
3.00 [1.50, 3.00] |
3.00 [2.00, 3.00] |
0.918 |
|
Goblet cell hyperplasia(score) |
2.00 [1.00, 3.00] |
1.00 [1.00, 2.00] |
3.00 [2.00, 4.00] |
<0.001 |
|
Eosinophilic infiltration(score) |
2.00 [1.00, 2.00] |
2.00 [0.75, 2.00] |
2.00 [1.00, 3.00] |
0.026 |
|
1Mean (SD); Median [IQR]: 2Two Sample t-test; Wilcoxon rank sum test |
||||
Hematoxylin-Eosin (HE) Staining and Histology and Immunohistochemistry (IHC) Paraffin sections (4-μm) were baked (60°C, 1h), deparaffinized (xylene/ethanol), and stained (hematoxylin 3min, eosin 30s). For IHC, antigen retrieval (citrate buffer) was followed by blocking and incubation with HPGDS antibody (22522-1-AP, Proteintech, 1:250) overnight at 4°C, then polymer secondary antibody (Servicebio). DAB visualization and hematoxylin counterstaining were performed. Images were analyzed using Image.
Statistical Analysis All statistical analyses were performed using R software version 4.3.2. Normally distributed quantitative data were expressed as mean?±?Standard Deviation (SD), whereas non-normally distributed data were presented as median (interquartile range, IQR). Independent-sample t-tests were utilized to compare normally distributed data between two groups, and one-way analysis of variance (ANOVA) was used for multiple-group comparisons. For non-normally distributed data, the Mann-Whitney U test was applied for two-group comparisons, and Kruskal Wallis (H) test was performed for comparisons among multiple groups. Categorical data were presented as frequencies and percentages and analyzed using chi square or Fisher’s exact tests. A two-sided p-value?<?0.05 was considered statistically significant. Spearman correlation analysis was conducted to assess linear associations between HPGDS protein levels and clinical variables, with statistical significance defined at p?<?0.05. For logistic regression analysis, eosinophilic chronic rhinosinusitis with nasal polyps (eCRSwNP) was coded as 1, and non-eosinophilic CRSwNP (neCRSwNP) as 0. Binary logistic regression modeling was performed to evaluate associations between clinical parameters and eCRSwNP. Additionally, Receiver Operating Characteristic (ROC) curve analysis was employed to assess the diagnostic efficacy of relevant factors.
RESULTS
Bioinformatics Analysis of Gene Expression in CRSwNP Tissues
The CRSwNP dataset (GSE72713) comprises RNA sequencing data from polyp tissues of 3 eCRSwNP patients and 3 neCRSwNP patients. Differential expression analysis identified a total of 475 differentially expressed genes (DEGs), including 266 upregulated and 209 downregulated genes (Figure 1a). The heatmap visualization of DEGs is presented in Figure 1b. Gene Ontology (GO) enrichment analysis revealed that DEGs were predominantly enriched in biological processes such as “cellular response to chemokine,” “chemokine-mediated signaling pathway,” and “eosinophil chemotaxis” (Figure 1c). KEGG pathway enrichment analysis revealed significant enrichment of the differentially expressed genes in key immune inflammatory pathways, including “Cytokine-cytokine receptor interaction,” “JAK-STAT signaling pathway,” and “Chemokine signaling pathway” (Figure 1d). Subsequently, Weighted Gene Co-expression Network Analysis (WGCNA) of the GSE36830 dataset identified 662 genes for further investigation. (Figure 1e). Module-trait correlation analysis further revealed significant associations between specific modules and clinical traits (Figure 1f). Intersection analysis of the DEGs and WGCNA-derived genes identified 60 overlapping genes, highlighting their potential roles in CRSwNP pathogenesis, diagnosis, or therapeutic interventions.
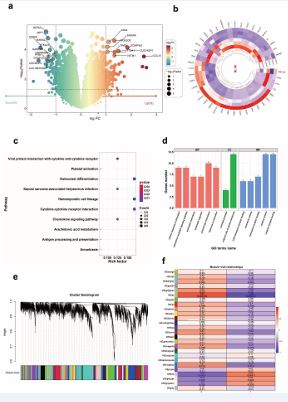
Figure 1 Differential Expression, Enrichment Analysis, and Co-Expression Network Analysis of GSE72713 Data set. (a) Display 475 differential genes using volcano map. (b) Displays expression levels of differentially expressed genes using heatmap of DEGs. (c) GO Analysis of DEGs: The top three enriched biological processes (BP) for DEGs are “cellular response to chemokine,” “chemokine−mediated signaling pathway,” and “eosinophil chemotaxis.”. (d) KEGG Pathway Analysis of DEGs: The top three enriched KEGG pathways for DEGs are “Cytokine-cytokine receptor interaction,” “JAK-STAT signaling pathway,” and “Chemokine signaling pathway.” . (e) Cluster Dendrogram: This dendrogram shows the hierarchical clustering of genes based on their expression profiles. The branches represent gene modules, and the color bars at the bottom indicate the assigned module colors for each cluster. (f) Module-Trait Relationships: The heatmap shows the correlation between gene modules and traits, with module names on the left and traits on the right. The color intensity reflects the strength of the correlation, with red indicating a positive correlation and blue indicating a negative correlation. The numbers in the cells represent the correlation values, with p-values in parentheses.
Intersection Analysis of DEGs and WGCNA-Derived Genes A total of 60 overlapping genes were identified as common candidates from 415 DEGs and 602 module genes (Figure 2a). These overlapping genes were selected for subsequent functional investigation and model construction.
To further refine these candidate genes, Least Absolute Shrinkage and Selection Operator (LASSO) regression analysis was conducted on the 60 overlapping genes. A 10-fold cross-validated LASSO regression analysis, which identified the optimal λ value based on the minimum mean squared error (MSE) criterion, yielded 53 core candidate genes from the initial 60 overlapping genes by compressing the coefficients of non-critical genes to zero (Figure 2b and Figure 2c). Additionally, SVM-RFE with 5-fold cross-validation was applied to the 60 overlapping genes. The cross-validation error curve determined the optimal feature size to be 7, which achieved the lowest error (0.0392; Figure 2d) and the highest accuracy (0.961; Figure 2e).
Intersecting results from LASSO and SVM-RFE analyses yielded 7 common genes: HSD11B2, CSMD1, HPGDS, DNAJC9.AS1, DCAF12L1, LINC02042, and CXADR (Figure 2f). These shared genes demonstrated significant expression differences between CRSwNP and control tissues, suggesting critical involvement in nasal polyp pathogenesis. The decision was made to exclude LINC02042 from further functional verification owing to its low expression profile, associated experimental challenges, and the current absence of foundational biological data.
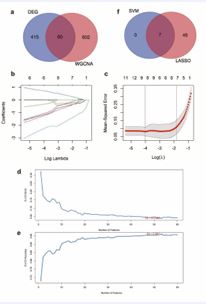
Figure 2 Workflow of Feature Selection and Gene Expression Analysis. (a) Venn diagram showing the 60 common genes between DEGs and WGCNA-identified genes. (b) LASSO Regression Coefficient Profiles: This panel shows how the coefficients of selected features change as the regularization parameter (log Lambda) varies. (c) Cross Validation Mean Squared Error (MSE): The plot shows the mean squared error from cross-validation, with the optimal Lambda value selected based on the minimum MSE. (d)5-Fold Cross-Validation (CV) Error vs. Number of Features: This panel shows the relationship between the 5-fold CV error rate and the number of selected features, with the optimal feature count marked in red. (e) 5-Fold Cross-Validation (CV) Accuracy vs. Number of Features: This panel illustrates the relationship between the 5-fold CV accuracy and the number of selected features, with the optimal number of features indicated in red. (f) Venn Diagram: Shows the overlap between genes selected by SVM and LASSO.
Pathological and Molecular Characteristics of Nasal Polyp Tissues
To investigate pathological differences and identify potential biomarkers between eCRSwNP and neCRSwNP tissues, we performed histological and immunohistochemical analyses on collected nasal mucosa and nasal polyp tissues (NC: eCRSwNP: neCRSwNP = 5:5:5). Hematoxylin and Eosin (HE) staining (Figure 3a) demonstrated that the NC group exhibited normal pseudostratified ciliated columnar epithelium without significant inflammatory infiltration. In contrast, the eCRSwNP group presented pronounced stromal edema and eosinophil infiltration, whereas neCRSwNP tissues showed epithelial thickening, vascular congestion, glandular hyperplasia, and prominent mixed inflammatory cell infiltration.
Quantitative PCR (qPCR) analysis revealed the differences in gene expression among the groups. HPGDS was markedly upregulated in the eCRSwNP group compared to the neCRSwNP and NC groups (P < 0.001, Figure 3b). Conversely, HSD11B2 expression was reduced in neCRSwNP tissues (P < 0.01), while CSMD1 expression differed significantly between NC and both CRSwNP groups (P < 0.0001), but not between eCRSwNP and neCRSwNP.The remaining genes showed no significant differences among groups. Immunohistochemistry (IHC) confirmed that HPGDS protein localized primarily to the cytoplasm and nuclei of epithelial cells, presenting as brownish-yellow staining. Consistent with qPCR results, eCRSwNP tissues exhibited significantly elevated HPGDS protein expression compared to control and neCRSwNP groups (P < 0.0001, Figure 4a). Expanded IHC validation (eCRSwNP:neCRSwNP = 24:24) reaffirmed these findings, highlighting robust differences between groups ( Consistent with qPCR results, eCRSwNP tissues exhibited significantly elevated HPGDS protein expression compared to control and neCRSwNP groups (P < 0.0001, Figure 4a and Figure 4b and Figure 4c).
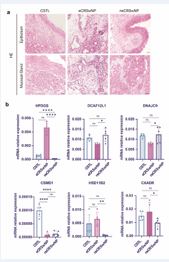
Figure 3 Histological and mRNA Expression Analysis of Genes in Different CRSwNP Subtypes. (a) Hematoxylin and eosin (HE) staining of epithelium and mucosal glands in CSTL, eCRSwNP, and neCRSwNP samples. Scale bar: 50 µm. (b) Bar plots showing the relative mRNA expression levels of HPDGS, DCAF12L1, DNAJC9, CSMD1, HSD11B2, and CXADR across three groups: CSTL, eCRSwNP, and neCRSwNP. Data are presented as mean ± standard deviation. Statistical significance is indicated by asterisks: *p < 0.05, **p < 0.01, ***p < 0.001, ****p < 0.0001; ns denotes no statistical significance. Comparisons were performed between groups as indicated.
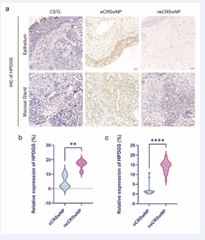
Figure 4 Immunohistochemical Analysis and Quantification of HPDGS Expression. (a) Representative immunohistochemical (IHC) staining of HPDGS in the epithelium and mucosal glands of CSTL, eCRSwNP, and neCRSwNP groups. Scale bar: 50 µm. (b) Quantitative analysis of HPDGS expression in epithelium and mucosal glands, measured as the percentage of positively stained area relative to the total area. (eCRSwNP : neCRSwNP=5:5). Statistical significance is indicated by asterisks: ****p < 0.0001; ns indicates no significant difference. (C) Quantitative analysis of HPDGS expression in epithelium and mucosal glands, measured as the percentage of positively stained area relative to the total area. (eCRSwNP : neCRSwNP=24:24). Statistical significance is indicated by p < 0.01.
Clinical and Pathological Features and Diagnostic Value of HPGDS in eCRSwNP Patients
Demographic data for nasal polyp patients are summarized in Table 1. Age, gender, smoking status, and comorbidities were comparable across groups, although asthma, atopy, and allergic rhinitis appeared more frequently in eCRSwNP patients, albeit without statistical significance.
Table 1: Comparison of Demographic Between eCRSwNP and neCRSwNP Groups.
|
Variables |
Total1 (n = 48) |
neCRSWNP1 (n = 24) |
eCRSWNP1 (n = 24) |
P2 |
|
Age(years) |
46.96 (15.13) |
47.29 (15.59) |
46.63 (14.99) |
0.881 |
|
Sex, n(%) |
|
|
|
0.561 |
|
Female |
21 (43.75) |
9 (37.50) |
12 (50.00) |
0.561 |
|
Male |
27 (56.25) |
15 (62.50) |
12 (50.00) |
|
|
BMI(Kg/m2) |
24.35 (3.36) |
24.86 (3.68) |
23.83 (3.01) |
0.296 |
|
Asthma, n(%) |
|
|
|
0.416 |
|
No |
42 (87.50) |
22 (91.67) |
10 (83.33) |
|
|
Yes |
6 (12.50) |
2 (8.33) |
4 (16.67) |
|
|
Atopy, n(%) |
|
|
|
0.666 |
|
No |
41 (85.42) |
22 (91.67) |
19 (79.17) |
|
|
Yes |
7 (14.58) |
2 (8.33) |
5 (20.83) |
|
|
Allergic rhinitis, n(%) |
|
|
|
1.000 |
|
No |
45 (93.75) |
23 (95.83) |
22 (91.67) |
|
|
Yes |
3 (6.25) |
1 (4.17) |
2 (8.33) |
|
|
Complicating chronic disease, n(%) |
|
|
|
0.516 |
|
No |
35 (72.92) |
19 (79.17) |
16 (66.67) |
|
|
Yes |
13 (27.08) |
5 (20.83) |
8 (33.33) |
|
|
Smoking, n(%) |
|
|
|
1.000 |
|
No |
41 (85.42) |
20 (83.33) |
21 (87.50) |
|
|
Yes |
7 (14.58) |
4 (16.67) |
3 (12.50) |
|
|
Recurrence CRSWNP, n(%) |
|
|
|
0.701 |
|
No |
40 (83.33) |
21 (87.50) |
19 (79.17) |
|
|
Yes |
8 (16.67) |
3 (12.50) |
5 (20.83) |
|
|
1Mean (SD); n (%); 2Two Sample t-test; Pearson’s Chi-squared test; Fisher’s exact test |
||||
Clinical data comparisons (Table 2) revealed elevated serum IgE levels, blood eosinophil counts and percentages, and tissue eosinophil counts and percentages in eCRSwNP patients (P < 0.05). No differences were found in total leukocyte counts and percentages, Lund-Mackay scores, or Improved Lund-Kennedy scores. Pathological evaluation identified higher scores for subepithelial edema, goblet cell hyperplasia, and eosinophil infiltration in eCRSwNP tissues compared to neCRSwNP tissues (P < 0.05). No differences were observed regarding inflammatory severity scores.
Table 2: Comparison of Clinical Characteristics and Pathological Characteristics Between eCRSwNP and neCRSwNP Groups
|
Variables |
Total1 (n = 48) |
neCRSWNP1 (n = 24) |
eCRSWNP1 (n = 24) |
P2 |
|
Serum total IgE (IU/ml) |
103.23 (27.96) |
83.53 (18.50) |
122.93 (21.10) |
<0.001 |
|
Blood eosinophil counts(×10^9/L ) |
0.34 [0.27, 0.41] |
0.29 [0.23, 0.40] |
0.39 [0.32, 0.44] |
0.014 |
|
Blood leukocyte count (×10^9/L ) |
2.93 [2.46, 3.61] |
2.92 [2.44, 3.54] |
3.08 [2.51, 3.61] |
0.910 |
|
Blood eosinophil percentage (%) |
4.95 [1.88, 6.35] |
1.85 [1.40, 2.85] |
6.40 [5.20, 7.73] |
<0.001 |
|
Blood leukocyte percentage (%) |
53.04 (8.24) |
54.84 (7.53) |
51.24 (8.68) |
0.132 |
|
Tissue eosinophil counts (n/HPF) |
27.50 [19.00, 50.25] |
19.00 [16.00, 22.00] |
49.50 [39.75, 54.75] |
<0.001 |
|
Tissue eosinophil percentage (%) |
17.75 [5.98, 26.80] |
5.95 [5.15, 6.73] |
26.00 [22.20, 30.35] |
<0.001 |
|
Lund-Mackay score |
10.33 (2.61) |
9.63 (2.98) |
11.04 (2.01) |
0.059 |
|
Improved Lund-Kennedy score |
7.85 (2.36) |
7.38 (2.36) |
8.33 (2.32) |
0.162 |
|
Subepithelial edema(score) |
2.50 [2.00, 4.00] |
2.00 [2.00, 2.25] |
4.00 [2.75, 4.00] |
0.008 |
|
Degree of inflammation(score) |
3.00 [2.00, 3.00] |
3.00 [1.50, 3.00] |
3.00 [2.00, 3.00] |
0.918 |
|
Goblet cell hyperplasia(score) |
2.00 [1.00, 3.00] |
1.00 [1.00, 2.00] |
3.00 [2.00, 4.00] |
<0.001 |
|
Eosinophilic infiltration(score) |
2.00 [1.00, 2.00] |
2.00 [0.75, 2.00] |
2.00 [1.00, 3.00] |
0.026 |
|
1Mean (SD); Median [IQR]: 2Two Sample t-test; Wilcoxon rank sum test |
||||
Table 3: Correlation Analysis of HPGDS with CRSwNP-Related Parameter
|
Parameter |
Correlation Coefficient (r) |
P |
|
Serum total IgE (IU/ml) |
0.691 |
<0.001 |
|
Blood eosinophil counts |
0.494 |
<0.001 |
|
Blood eosinophil percentage |
0.624 |
<0.001 |
|
Blood leukocyte count |
0.084 |
0.570 |
|
Blood leukocyte percentage |
-0278 |
0.056 |
|
Tissue eosinophil counts (n/HPF) |
0.796 |
<0.001 |
|
Tissue eosinophil percentage (%) |
0.787 |
<0.001 |
|
Lund-Mackay score |
0.485 |
<0.001 |
|
Improved Lund-Kennedy score |
0.487 |
<0.001 |
|
Subepithelial edema |
0.305 |
0.035 |
|
Degree of inflammation |
0.005 |
0.972 |
|
Goblet cell hyperplasia |
0.508 |
<0.001 |
|
Eosinophilic infiltration |
0.336 |
0.019 |
|
For the correlation analysis, Pearson Correlation Coefficient was used to assess linear relationships with Spp1 protein levels for normally distributed data, while Spearman Rank Correlation Coefficient was applied to evaluate monotonic associations for non-normally distributed data. |
||
HPGDS protein expression demonstrated significant correlations with key clinical parameters (Table 3). Strong positive correlations were observed with both tissue eosinophil counts (r = 0.796, P < 0.001) and tissue eosinophil percentage (r = 0.787, P < 0.001). Additionally, HPGDS expression showed moderate correlations with serum total IgE levels, blood eosinophil parameters, Radiographic and Endoscopic Scores, and specific histopathological features. Univariate and multivariate logistic regression analyses were performed based on the indicators identified with significant differences between eCRSwNP and neCRSwNP in Table 4. Blood eosinophil parameters were excluded from all models to prevent diagnostic circularity, as they constitute established diagnostic criteria for eCRSwNP. Univariate analysis identified several factors significantly associated with eCRSwNP (P< 0.05), including serum total IgE, relative expression of HPGDS, tissue eosinophil counts, tissue eosinophil percentage, subepithelial edema, goblet cell hyperplasia, and eosinophilic infiltration. Multivariate analysis demonstrated that serum total IgE (OR = 1.01, 95% CI: 1.00–1.41, P = 0.041), relative expression of HPGDS (OR = 1.76, 95% CI: 1.23–3.63,P = 0.007), and tissue eosinophil percentage (OR = 1.18, 95% CI: 1.04–1.76, P = 0.014) remained independent predictors of eCRSwNP.
Table 4: Logistic Regression Analysis of CRSwNP-Related Parameters.
|
Variables |
Univariate analysis |
Multivariate analysis |
||
|
OR (95%CI) |
P |
OR (95%CI) |
P |
|
|
Serum total IgE (IU/ml) |
1.12 (1.05 ~ 1.21) |
0.001 |
1.01 (1.00 ~ 1.41) |
0.041 |
|
Relative expression of HPDGS (%) |
2.11 (1.23 ~ 3.63) |
0.007 |
1.76 (1.23 ~ 3.63) |
0.007 |
|
Tissue eosinophil counts (n/HPF) |
1.18 (1.09 ~ 1.29) |
<0.001 |
- |
- |
|
Tissue eosinophil percentage (%) |
1.34 (1.17 ~ 1.54) |
<0.001 |
1.18 (1.04 ~ 1.76) |
0.014 |
|
Subepithelial edema |
1.81 (1.09 ~ 3.03) |
0.023 |
- |
- |
|
Goblet cell hyperplasia |
3.41 (1.72 ~ 6.79) |
<0.001 |
- |
- |
|
Eosinophilic infiltration |
2.34 (1.15 ~ 4.76) |
0.019 |
- |
- |
ROC analysis demonstrated that HPGDS alone provided moderate diagnostic value for eCRSwNP (AUC = 0.721) (Figure 5). Diagnostic accuracy improved when HPGDS was combined with tissue eosinophil percentage (AUC = 0.892) or serum total IgE (AUC = 0.764). The highest performance was achieved by combining HPGDS with both biomarkers (AUC = 0.912, 95% CI: 0.65–0.98).
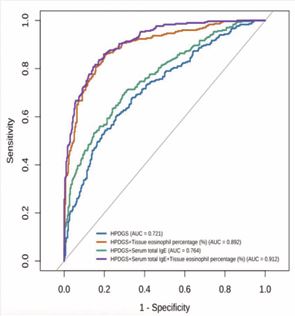
Figure 5 ROC Curve Analysis of Biomarkers for eCRSwNP Differentiation.
These results confirm the diagnostic potential of HPGDS and demonstrate that a combined model integrating it with key markers significantly enhances eCRSwNP identification.
DISCUSSION
This study combined bioinformatic analysis with machine learning algorithms to identify genes significantly differentially expressed between eCRSwNP and neCRSwNP tissues. Subsequent clinical validation revealed that Hematopoietic Prostaglandin D Synthase (HPGDS) protein expression was significantly elevated in eCRSwNP tissues compared to neCRSwNP tissues. To further evaluate the diagnostic potential of HPGDS in distinguishing eCRSwNP from neCRSwNP, clinical data from patients were analyzed using correlation analyses, logistic regression modeling, and Receiver Operating Characteristic (ROC) curve analyses. The results demonstrated that HPGDS, as a novel biomarker, exhibits excellent diagnostic accuracy and effectively differentiates eCRSwNP from neCRSwNP patients.
Through comprehensive analysis of the GSE72713 dataset, we identified multiple Differentially Expressed Genes (DEGs) enriched in critical biological processes such as “response to chemokines,” “chemokine-mediated signaling pathways,” and “eosinophil chemotaxis.” These findings align closely with known immunological characteristics of CRSwNP, highlighting the importance of immune cell infiltration and inflammatory responses in disease pathogenesis. KEGG pathway enrichment analysis further emphasized that these DEGs are involved in pivotal signaling pathways including “cytokine- cytokine receptor interaction,” “JAK-STAT signaling,” and “chemokine signaling,” which are critically associated with chronic inflammation, immune cell activation, and tissue remodeling in CRSwNP. To further refine candidate genes, Weighted Gene Co-expression Network Analysis (WGCNA) was performed, and integration of LASSO and SVM analyses identified seven representative genes (HSD11B2, CSMD1, HPGDS, DNAJC9.AS1, DCAF12L1, LINC02042, and CXADR) with potential diagnostic significance.
CRSwNP is a prevalent chronic inflammatory disorder, hypothesized to result from impaired nasal epithelial barrier function leading to increased exposure to pathogens, allergens, and particulates. Combined with a dysregulated host immune response, these factors contribute to sustained chronic inflammation [2,18]. Inflammatory responses in CRSwNP are categorized primarily into three distinct types: type 1 (T1), type 2 (T2), and type 3 (T3). T1 inflammation involves Th1 cells, CD8^+ T cells, and natural killer (NK) cells and is characterized by IFN-γ signaling, playing critical roles in antiviral immunity and bacterial defense. T2 inflammation, mediated by Th2 cells, eosinophils, and mast cells, involves the STAT6 pathway and IgE-mediated immune responses typical of allergic diseases. T3 inflammation, driven primarily by Th17 cells and neutrophils via IL-17 signaling, often occurs in bacterial infections and acute inflammation [19]. According to Yao et al., eCRSwNP tissues prominently express Th2-related cytokines and chemokines such as IL-4, IL-5, IL-13, eotaxin, and CCL18, critical for eosinophil recruitment and activation. In contrast, neCRSwNP is predominantly associated with neutrophilic inflammation and elevated IL-17 pathway mediators such as CCL20, adiponectin, TGF-β2, and TREM-1 [13]. Given the focus of this study on identifying diagnostic markers specifically for eCRSwNP, we prioritized candidate genes strongly associated with type 2 inflammation and exhibiting significant differences between eCRSwNP and neCRSwNP tissues.
HPGDS is a key enzyme predominantly expressed in immune cells such as mast cells and antigen-presenting cells. It catalyzes the conversion of prostaglandin H2 (PGH2) to prostaglandin D2 (PGD2). PGD2 exerts its biological effects by binding to the receptors DP1 and DP2/CRTH2, activating Th2 cells and stimulating secretion of cytokines such as IL-4, IL-5, and IL-13, which drive type 2 immune responses [20,21]. Elevated PGD2 levels thus amplify eosinophil and mast cell activation, exacerbating allergic inflammation. Previous studies have linked high HPGDS expression and enhanced PGD2 production to intensified Th2-driven inflammation in allergic conditions like asthma and atopic dermatitis [19]. Furthermore, Ma et al., demonstrated through single-cell RNA sequencing and multiparametric flow cytometry that Th2 cells in CRSwNP patients exhibit significant upregulation of HPGDS, TCN1, and CD200R, alongside enrichment of lipid metabolism pathways [22,23]. Considering that eCRSwNP predominantly involves type 2 inflammation, the elevated expression of HPGDS observed in eCRSwNP may critically enhance PGD2 synthesis and consequently exacerbate Th2-mediated inflammatory processes. We hypothesize that the elevated expression of HPGDS contributes significantly to eCRSwNP pathology, making it a valuable diagnostic biomarker.
To validate this hypothesis, we collected nasal polyp samples from eCRSwNP and neCRSwNP patients, performing comparative analyses on HPGDS expression at gene and protein levels. Results confirmed significantly higher HPGDS expression in eCRSwNP compared to neCRSwNP and control groups.Further clinical analyses revealed significant differences in parameters associated with type 2 immune responses, including serum IgE levels, blood eosinophil counts and percentages, and tissue eosinophil infiltration between eCRSwNP and neCRSwNP groups, consistent with findings by Zhang et al [11]. Histopathological examination similarly revealed greater subepithelial edema, eosinophil infiltration, and inflammation severity scores in eCRSwNP tissues, although literature for direct comparison of these pathological parameters remains limited. Correlation analyses demonstrated positive associations between
HPGDS expression and multiple type 2 inflammation- related indicators, including serum IgE, eosinophil counts (blood and tissue), subepithelial edema, and improved Lund-Kennedy scores, strongly suggesting its critical involvement in the progression of type 2 inflammation in eCRSwNP.
Subsequent multivariate Logistic regression analysis strengthened the above inference, confirming that the relative expression level of HPGDS was an independent predictor of eCRSwNP (OR = 1.76, 95% CI: 1.23-3.63, P = 0.007). Diagnostically, HPGDS alone demonstrated moderate discrimination (AUC = 0.721). Notably, combining HPGDS with tissue eosinophil percentage (AUC
= 0.892) or serum total IgE (AUC = 0.764) significantly enhanced classification performance. These results position HPGDS as a dual-purpose biomarker: applicable as a standalone indicator and as a complementary factor in multivariate diagnostic models for improved patient stratification.
This study has several limitations. First, all bioinformatics analyses and machine learning modeling were performed on a single, relatively small cohort, which limits our ability to mitigate inherent population heterogeneity and selection bias, and the absence of independent external validation constrains the generalizability of our conclusions. Second, experimental validation was confined to confirming the expression levels of candidate genes and evaluating their diagnostic potential; functional studies were not undertaken, so the precise mechanistic roles of these genes in eCRSwNP pathogenesis remain unclear. Lastly, the modest sample size may undermine statistical power and elevate the risk of both false positives and false negatives. In future work, we plan to expand the sample size, incorporate multicenter independent cohorts, and conduct in vitro and in vivo functional experiments to further validate our findings and elucidate the underlying molecular mechanisms.
CONCLUSION
In conclusion, this study highlights HPGDS as a novel biomarker capable of effectively differentiating eCRSwNP from neCRSwNP, demonstrating robust diagnostic accuracy. These findings support the clinical utility of HPGDS in improving diagnosis and guiding targeted therapeutic strategies for patients with eCRSwNP.
ACKNOWLEDGEMENTS
We would like to express our sincere gratitude to the publicly available GEO databases for their invaluable resources.
Ethics Statement
This research involving human participants was reviewed and approved by the Ethics Committee of Fuyang City People’s Hospital ([2023] Number 92). Written informed consent was obtained from all patients prior to their participation in this study.
Availability of data and materials
In this study, bioinformatics data were sourced from the following publicly accessible databases: Gene Expression Omnibus (GEO): https://www.ncbi.nlm.nih.gov/geo/. This open-access resources provided comprehensive genomic and clinical data essential for our analyses.
Funding
This work was supported by the 2022 Anhui Medical University School-level Research Project (2022xkj227) and the 2020 Municipal Science and Technology Bureau Self-Funded Research Project (FK202081033).
CRediT Authorship Contribution Statement
Meng Luo: Writing - original draft, conceptualization, software. Wenjie Zhang: Writing - review and editing, experimental completion. Jinkai Han: investigation, data curation, visualization. Yinong Chang: Software. Xinghong Yin: Supervision, methodology, funding acquisition. All authors contributed to this manuscript and approved the final version.
REFERENCES
- Fokkens WJ, Lund VJ, Hopkins C, Hellings PW, Kern R, Reitsma S, et al. European Position Paper on Rhinosinusitis and Nasal Polyps 2020. Rhinology. 2020; 58: 1-464.
- Bachert C, Marple B, Schlosser RJ, Hopkins C, Schleimer RP, Song WJ, et al. Adult chronic rhinosinusitis. Nat Rev Dis Primers. 2020; 6: 86.
- Stevens WW, Schleimer RP, Kern RC. Chronic Rhinosinusitis with Nasal Polyps. J Allergy Clin Immunol Pract. 2016; 4: 565-572.
- Kariyawasam HH. Chronic rhinosinusitis with nasal polyps: insights into mechanisms of disease from emerging biological therapies. Expert Rev Clin Immunol. 2019; 15: 59-71.
- Wahid NW, Smith R, Clark A, Salam M, Philpott CM. The socioeconomiccost of chronic rhinosinusitis study. Rhinology. 2020; 58: 112-125.
- Bochner BS, Stevens WW. Biology and Function of Eosinophils in Chronic Rhinosinusitis with or Without Nasal Polyps. Allergy Asthma Immunol Res. 2021; 13: 8-22.
- Lou H, Zhang N, Bachert C, Zhang L. Highlights of eosinophilic chronic rhinosinusitis with nasal polyps in definition, prognosis, and advancement. Int Forum Allergy Rhinol. 2018; 8: 1218-1225.
- Cho SW, Kim DW, Kim JW, Lee CH, Rhee CS. Classification of chronicrhinosinusitis according to a nasal polyp and tissue eosinophilia: limitation of current classification system for Asian population. Asia Pac Allergy. 2017; 7: 121-130.
- Tokunaga T, Sakashita M, Haruna T, Asaka D, Takeno S, Ikeda H, et al. Novel scoring system and algorithm for classifying chronic rhinosinusitis: the JESREC Study. Allergy. 2015; 70: 995-1003.
- Nakayama T, Sugimoto N, Okada N, Tsurumoto T, Mitsuyoshi R, Takaishi S, et al. JESREC score and mucosal eosinophilia can predict endotypes of chronic rhinosinusitis with nasal polyps. Auris Nasus Larynx. 2019; 46: 374-383.
- Wang G, Li M, Zheng J, Zhan J, Zheng H, Li R, et al. Circulating BAFF as novel biomarker in distinguishing chronic rhinosinusitis with nasal polyps endotypes and predicting postoperative recurrence. Int Immunopharmacol. 2022; 104: 108515.
- Idler BM, Iijima K, Ochkur SI, Jacobsen EA, Rank MA, Kita H, et al. Eosinophil Peroxidase: A Biomarker for Eosinophilic Chronic Rhinosinusitis Agnostic of Polyp Status. Laryngoscope. 2024; 134: 69-78.
- Taheri A, Hasani S, Saberi Esfeedvajani M, Saeedi M, AbolghasemiR. Sino-nasal outcome Test-22 and Lund-Mackay CT score to select endoscopic sinus surgery in chronic rhinosinusitis. World J Otorhinolaryngol Head Neck Surg. 2023; 10: 200-205.
- Hopkins C, Browne JP, Slack R, Lund V, Brown P. The Lund-Mackay staging system for chronic rhinosinusitis: how is it used and what does it predict? Otolaryngol Head Neck Surg. 2007; 137: 555-561.
- Zhang L, Zhang LH. Comparison of different endoscopic scoring systems in patients with chronic rhinosinusitis: reliability, validity, responsiveness and correlation. Rhinology. 2017; 55: 363-368.
- Brescia G, Alessandrini L, Giacomelli L, Parrino D, Zanotti C, Tealdo G, et al. A classification of chronic rhinosinusitis with nasal polyps based on structured histopathology. Histopathology. 2020; 76: 296-307.
- Brescia G, Alessandrini L, Zanotti C, Parrino D, Tealdo G, Torsello M, et al. Histopathological and hematological changes in recurrent nasal polyposis. Int Forum Allergy Rhinol. 2019; 9: 813-820.
- Kato A, Peters AT, Stevens WW, Schleimer RP, Tan BK, Kern RC. Endotypes of chronic rhinosinusitis: Relationships to disease phenotypes, pathogenesis, clinical findings, and treatment approaches. Allergy. 2022; 77: 812-826.
- Peinhaupt M, Sturm EM, Heinemann A. Prostaglandins and Their Receptors in Eosinophil Function and As Therapeutic Targets. Front Med (Lausanne). 2017; 4: 104.
- Mitson-Salazar A, Yin Y, Wansley DL, Young M, Bolan H, Arceo S, et al. Hematopoietic prostaglandin D synthase defines a proeosinophilic pathogenic effector human T(H)2 cell subpopulation with enhanced function. J Allergy Clin Immunol. 2016; 137: 907-918.e9.
- Rittchen S, Heinemann A. Therapeutic Potential of Hematopoietic Prostaglandin D2 Synthase in Allergic Inflammation. Cells. 2019; 8: 619.
- Ma J, Tibbitt CA, Georén SK, Christian M, Murrell B, Cardell LO, et al. Single-cell analysis pinpoints distinct populations of cytotoxic CD4+ T cells and an IL-10+CD109+ TH2 cell population in nasal polyps. Sci Immunol. 2021; 6: eabg6356.
- Athari SS. Targeting cell signaling in allergic asthma. Signal Transduct Target Ther. 2019; 4: 45.


