Using Predictive Performance from an Elastic Net Regression to Classify Developmental Language Disorder Dld
- 1. The University of Texas at Dallas, USA
- 2. Ohio University, USA
- 3. Utah State University, USA
Abstract
Purpose: Evidence suggests developmental disorders are best viewed from a multidimensional approach, where the disorder deficit profile may be highly variable due to the complex interaction of factors that vary along a continuum. In this study, we leverage individual variability to determine whether a multidimensional disorder, such as developmental language disorder (DLD), can be identified.
Method: We used repeated elastic net logistic regression with 71 high-density measures from 223 children ages 7 - 11 (DLD = 110; typically developing (TD) controls = 113) from the Montgomery et al. [1] study.. In Study 1, we trained the model on 70% of the data and tested its performance on the remaining 30% holdout set. In the second study, we utilized the complete data set to derive the fitted models to compare the characteristics of the best- and worst performing models.
Results: Area under the receiver operating characteristic curve (AUROC) was used to evaluate the performance of the fitted models. For the fitted model in Study 1, the average AUROC in the training set was 0.88 (SD = 0.017) in discriminating DLD-TD groups, and the holdout set was 0.85 (SD = 0.04). The average AUROC for discriminating the fitted modes in Study 2 was 0.87 (SD = 0.002). The model-estimated probability scores for both Study 1 & 2 models were also significantly correlated with the language severity measure.
Conclusion: Our successful development of a predictive model based on an elastic net algorithm that classified children with DLD from those without, using a multidimensional dataset, provides indirect support for the notion that DLD is a multidimensional disorder. Some of the conundrums of data-driven model derivation and complementary findings, as well as the pros and cons of methodologies in Study 1 and Study 2, are discussed.
Keywords
• Developmental Language Disorder (DLD)
• DLD deficit profile
• Machine Learning
• elastic net logistic regression
Citation
Sharma S, Golden RM, Montgomery J, Gillam RB, Evans JL. (2025) Using Predictive Performance from an Elastic Net Regression to Classify Developmental Language Disorder (Dld). Ann Otolaryngol Rhinol 12(4): 1368.
INTRODUCTION
Developmental Language Disorder (DLD) is a neurodevelopmental disorder characterized by the failure to master spoken and written language comprehension and production in the absence of any medical condition or syndrome known to cause language disorders in children [2-4]. While numbers vary slightly across countries, DLD occurs in ~ 7% of school-aged children in the United States [5]. Unidentified or left untreated, DLD persists into adulthood [6-8]. Approximately 7% or 1.8 million young adults ages 18 – 23, based on the 2024 US Census data, are currently struggling with the profound social, emotional, and economic consequences of the disorder in the United States alone [9,10].
Most research has focused on the expressive morphosyntactic aspects of DLD; however, deficits in lexical processing, including slower word retrieval [11], spoken word recognition [6,12,13], and comprehension of both simple and complex syntax [1,14,15] have been well documented in this population. Similarly, cognitive deficits, including verbal working memory [16,17], speed of processing, selective attention, and interference control [18,19], have also been well documented in this population.
Among the most scientifically challenging and unanswered questions is whether the underlying latent structure of DLD is categorical and constitutes children who differ qualitatively and non-arbitrarily from normal, or is dimensional and constitutes children whose language skills fall below some arbitrary threshold at the lower end of a continuous normal distribution on standardized tests [20,21]. Specifically, the question has been whether children with DLD constitute a distinct group with language skills that differ qualitatively and nonarbitrarily from typical children; or are children with DLD not clinically unique and merely have language skills that fall below some arbitrary threshold at the lower end of a continuous distribution on standardized tests [22-24]? Leonard first proposed that children with “DLD” were no different from children with poor musical, spatial, or mathematical abilities, and that the same types of variations in genetic and environmental factors that lead some children to be clumsy or amusical lead children with “DLD” to simply be poor at language [22]. Specifically, Leonard argued that the lack of evidence of neurological impairment was evidence for a dimensional account of DLD; however, there is a consistent pattern in studies of the neurobiology of DLD that is characterized not by a single brain measure or by global abnormality, but by a pattern of atypical brain morphology and tissue properties for some brain regions but not others, coupled with atypical patterns of neural activity mediating some aspects of language processing but not others [25,26].
As traditionally conceived, the categorical-dimensional debate views DLD as being quantitatively rather than qualitatively different from normal. A true disorder must: (a) be naturally occurring as opposed to artificially and arbitrarily created; (b) have clearly demarcated boundaries separating members of the natural kind from non-members (i.e. normal vs. disordered); (c) possess observable features that are causally produced by internal properties and which can be used to objectively validate category membership; and (d) show all the instances of a “kind” with features in common, which allows clinicians and researchers to distinguish a single instance of the “kind” where the child either does or does not possess the traits or symptoms of the disorder.
From a dimensional standpoint, the behavioral and cognitive characteristics of DLD are better understood as quantitative differences in general learning and processing mechanisms rather than as categorical deficits. Consistent with this view, Gillam et al. [27], demonstrated that four cognitive mechanisms—fluid reasoning, controlled attention, working memory, and long-term memory for language knowledge—accounted for more than 90% of the variance in standardized measures of language comprehension and production among school age children with and without DLD. Their GEM (Gillam, Evans, & Montgomery) model indicated that linguistic performance in DLD reflects graded weaknesses in these interrelated cognitive systems rather than a distinct separation from typical development. This dimensional perspective implies that boundaries between “typical” and “disordered” language functions are probabilistic and continuous, rather than categorical.
Resolving the dimensional-categorical debate in DLD is particularly challenging because it relies on a Boolean, polythetic classification approach based on the presence or absence of symptoms, and/or a single underlying cause. Such approaches artificially create the appearance of variability and heterogeneity in the deficit profile because they cannot account for differences in the clinical presentation of the disorder (e.g., symptoms, age of onset, severity, etc.) or the presence of an underlying unobservable dimension. This means that the more heterogeneous the observed symptoms are, the more difficult it is to identify the causal properties that objectively validate the disorder. Because the vast majority of symptoms, signs, and laboratory tests used in organic medicine are quantitative in nature and language is a developmental phenomenon, the observable traits of DLD will always be evident to some degree in both children with DLD and children with low normal language, and the observable dimensions along which DLD can be characterized will differ at different developmental stages.
The problem is further complicated because the majority of diagnostic criteria for DLD involve cutoff scores on a continuous normal distribution. Not all children with DLD will always score at the low end of a given standardized test because individual tests differ in their normative distributions. A child who truly has DLD has a roughly equal chance of being correctly or incorrectly identified, depending on the test used [28,29]. Even if clinicians and researchers use standardized tests with high sensitivity and specificity, there is a chance that some proportion of participants in an “DLD participant group” may be children with low normal language abilities This raises the question: how much of the variability and heterogeneity in the DLD behavioral phenotype is the result of non-homogeneous subject groups comprised of both children with DLD and unimpaired children with low normal language?
Dollaghan was one of the first researchers to ask if a distinct DLD deficit “profile” could be identified categorically, that nonarbitrarily demarcated a clear boundary between DLD and “normal using a taxometric approach. This approach enables researchers to examine the relationship among variables to determine if a nonarbitrary category or natural kind (e.g., taxon) exists on the variables (i.e., biological species, clinical category, etc. Meehl, [30-32]). Using this approach, Dollaghan examined vocabulary, mean length of utterance (MLU),number of different words, and non-word repetition scores at ages 4;0 and 6;0 as potential diagnostic indicators of “DLD.” She found no evidence of a qualitatively distinct group corresponding to children with DLD. Instead, she observed that the children’s language skills in her sample were distributed in a dimensional rather than categorical fashion [23,24].
Recently, Lancaster and Camarata [33] also addressed this question using two clustering techniques—K means clustering and Ward’s hierarchical method—with Bayesian Information Criterion (BIC) on 505 children classified as SLI/DLD from the Epidemiological Study of Specific Language Impairment (EpiSLI) database (Tomblin et al, 2010). Their analysis suggested that there might be more than 10 clusters within the DLD group that did not align with any previously hypothesized subtype model. According to them, the possibility of more than 10 clusters also supports the premise that DLD is a continuous spectrum disorder.
A framework has important implications for research methodology. If DLD represents a continuum of cognitive–linguistic efficiency, then models that assume linear separability between groups may fail to capture the true data structure. Instead, multivariate analytic approaches that leverage the continuous and correlated nature of linguistic and cognitive variables and capture the variability inherent across members of the disorder groups may provide more accurate and theoretically coherent representations of the mechanisms underlying DLD [34-36]. Multidimensional approaches, such as elastic Net Regression, have been successful in characterizing the nature of the disorder, even for Williams Syndrome, a neurogenetic disorder with a single-gene mutation, yet complex behavioral, neuroanatomical, and cognitive manifestations [37,38]. Elastic net models are particularly suited for this purpose because they can handle large, intercorrelated predictor sets while shrinking coefficients toward zero to prevent overfitting, thereby identifying the most predictive variables in a high-dimensional space.
Purpose
The central motivating theory in this study is that if the latent structure of DLD is dimensional, then, despite individual differences, measures of language and cognitive processing will be fundamentally similar for DLD and typical children. Alternatively, if the latent structure of DLD is categorical, we predict notable differences in language processing and cognitive processing for children with/ without DLD. Dollaghan posited that a reason she may not have identified a DLD taxon was that her data did not meet the independence requirements for taxometric analysis. A requirement, and limitation of the taxonomic approach, is that the results are not valid if the data fail to meet key requirements which include sufficiently large sample size (e.g., n = ~ 500-600), and more importantly for studies of cognition and language, that data must vary along a continuous scale and the indicators cannot be correlated (e.g., ≤ .30, [39]). Similarly, Lancaster and Camarata [33], used hard-clustering techniques such as K-means and Ward’s hierarchical clustering to examine whether subtypes exist within DLD. One property of hard clustering methodology is that it does not provide gradation or likelihood of belonging to each clustering for children; it instead assigns them to one group or the other based on participants’ similarity with others [40]. Even though this statistical approach has the potential to identify the nature of the disorder and subtypes within a disorder when it is regular and varies simply over one variable, such as language expressive abilities, this technique, when used to explore an irregular, heterogeneous, and potentially multidimensional disorder, could overlook the complexity and oversimplify the nature of the disorder.
An alternative approach is to use a regularized regression approach such as elastic Net Regression that combines Ridge and lasso regression [41,42]. elastic Net Regression is a regularized regression method that linearly combines the L1 and L2 penalties of the lasso and ridge methods. The approach is particularly useful when dealing with a large number of predictors and multicollinearity. Notably, as can be seen clearly in Fan et al. [37], modeling work, they used this novel approach to derive a Williams Syndrome (WS)-specific profile from a very small number of features from structural MRI measurements in a cohort of WS adults (n = 22) and healthy controls (n = 16). Their index for the model performance was area under the curve (AUC) in the receiver operating characteristic (ROC) analysis. Their model showed that even though each input measure only contributed a small portion of explained variance of a high-level construct (e.g., clinical diagnosis), when it was aggregated across individual differences in their WS population, the result was a multidimensional probabilistic composite score that accurately predicted each WS individual’s membership in the clinical group with an extremely high degree of accuracy. Despite the high multicollinearity in brain measures and substantial individual differences in WS behavioral profiles, Fan et al. were able to use this novel approach to derive a Williams Syndrome (WS)-specific profile.
In addition to addressing potentially high multicollinearity among predictor variables, another strength of the elastic net approach is that, by using high density sampling across a large number of input variables, the need for extremely large subject sample sizes is reduced. The current study builds on the GEM model (Gillam, Evans, & Montgomery), a psycholinguistic framework that posits that sentence comprehension and broader language performance emerge from the dynamic interaction of fluid reasoning, controlled attention, working memory, and long-term memory for language knowledge [15,43]. We use all of these measures of sentence comprehension and the cognition from Montgomery and colleagues’ study to determine whether a DLD-specific profile based on these predictors effectively differentiates children with DLD from their typically developing language peers.
To create a high-density sample across a large number of predictors, in this study we used all of measures (e.g., number correct, percent correct, reaction time, error pattern, etc.) of working memory, attentional control, speed of processing, lexical access, and real-time accuracy in the comprehension of canonical and noncanonical sentences from the original Montgomery project [15,27,43,44] to ask if there is a DLD-specific profile based on these predictors that uniquely identify and differentiate children with DLD from their typical language peers. In particular, we conducted two studies and analyzed the consistency and stability in the results. The first included a 70-30% split in the training-holdout analysis, and the second used all 223 participants from the Montgomery database to train the fitted models. As a whole, investigating the model’s performance and output characteristics across groups using analytical complementary approaches with a multidimensional statistical framework helps us understand the inherent nature of DLD and address the long-standing discourse in the literature.
STUDY ONE
Methods
Participants: Our model is based on measures from a total of 234 children (ages 7;0 to 11;11), 117 children with DLD (72 boys and 45 girls), and 117 children with typical language (TD) (83 boys and 34 girls). All children met the following inclusion criteria: a) normal nonverbal IQ (NVIQ) as measured by the Leiter International Performance Scale-Revised [45]; (b) normal-range hearing sensitivity at the time of testing [46]; (c) normal or corrected vision; (d) normal oral and speech production as measured by the Articulation subtest on the TOLD-P4 [47], and (e) a monolingual, English speaking home environment. Children were excluded from participation if parents reported that their child had (a) neurodevelopmental disorder, (b) emotional or behavioral disturbances, (c) motor deficit or frank neurological signs, or (d) seizure disorders or use of medication to control seizures. English was the primary language spoken by all the children.
Classification of DLD and TD participants: The participants were classified as DLD-TD based on scores from four standardized assessment measures: the receptive and expressive portions of the Comprehensive Receptive and Expressive Vocabulary Test (CREVT-2; [48]), and the concepts and following directions subtest and recalling sentences subtest of the Clinical Evaluation of Language Fundamentals (CELF-4; [49]). In keeping with the DSM 5 definition of language disorder and multi-dimensional systems for defining DLD (e.g., [3,4]), Montgomery et al.[1] classified the participants as DLD if their mean composite language z-score on the three lowest of the four measure was at or below -1. The average composite z-score for the DLD group was -1.48 (range = -2.73 to -1.00) with a SD of .39. The average composite z-score for the TD group was .08 (range = -.96 to 1.89) with a SD of .60.
Experimental Features included in the Elastic Net regressions: The Montgomery study included a large set of measures of spoken sentence comprehension and cognitive processing measures that were likely to be relevant to sentence comprehension. These included syntactic measures of comprehension of canonical and noncanonical spoken sentences. They also included lexical processing measures including word finding and spoken word recognition, and cognitive measures of controlled attention, phonological short-term memory, and verbal and nonverbal working memory. For the current study, we used all 71 experimental measures from the original Montgomery et al. [1], study as features to derive the elastic Net Regression model. This resulted in a high density sample of all aspects of the experimental measures (e.g., total trials correct, precent correct, number and type of errors, etc.) of the measures of comprehension of canonical and non-canonical sentences, lexical processing, working memory, attentional control and inhibition for us to include in the model (see Montgomery et al. [1] for detail description of the experimental measures).
Data Set for the Modeling: Of the 234 participants in the database, values were missing for one or more features in only eleven participants. For the DLD group, this included seven of them (four boys, three girls), and the TD group included the remaining four (three boys, one girl). Since these omissions were not reflective of experimental material difficulty, these 11 participants were screened out under the MCAR (missing completely at random) assumption. This resulted in a final sample of 223 children (DLD = 110; 69 boys, 41 girls; TD = 113; 70 boys, 43 girls) for our statistical model.
Modeling Methodologies
Logistic Regression Modeling: A logistic model infers the probability that a binary (0/1) outcome variable (y) takes on the value of 1, given a list of input values represented by the vector x. Let pi (β) denote the probability that the outcome variable yi takes on the value of 1. This probability is conditioned on a d-dimensional feature vector xi that corresponds to d distinct numerical features weighted by β, a (d+1)-dimensional vector of weights that includes an additional weight for the intercept. The complete formula follows:
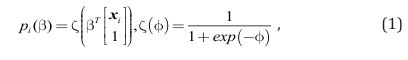
In this application, y taking on the value of 1 indicates the presence of DLD, but taking on the value of 0 indicates the absence of DLD. This setup allows the use of the logistic regression modeling defined in (1) to estimate the probability that a participant in the database has DLD, given their language and cognitive attributes encoded in the feature vector, x (see Figure 1).
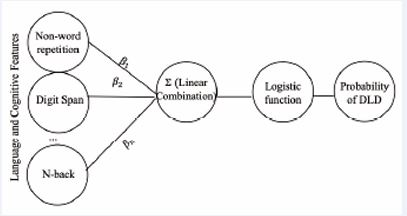
Figure 1 Representation of the logistic regression model Note: This is a model of logistic regression, where the language and cognitive features are multiplied by the estimated weights β, and their linear combination is passed through a logistic function to produce a probability score for DLD.
The feature weight β must be learned from the data first. Learning the feature weights from the data is synonymous with identifying a weighting of features that best separates individuals with DLD from those without, while minimizing misclassification. In statistical terms, this is framed as minimizing an objective function, which quantifies the error between the model’s predicted class based on an individual’s features and their actual class label. In this case, the objective of a binomial logistic regression model is to find the weight vector β that results in the least amount of prediction error. This corresponds to the following formulation:
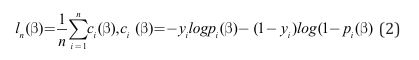
Where the objective function is the total negative log likelihood, ln β, averaged across all individuals in our dataset. Here, ci (β) is the negative log likelihood loss of single individual i in our dataset, measuring how far off our model’s prediction was from the individual’s actual label. For instance, if our model predicts a probability close to 0, given the features of a particular individual with DLD, instead of a probability close to 1, then our ci (β) outputs a high error, and vice versa. The objective function is then the sum of all ci (β) over the entire set of individuals in our data, divided by the number of individuals.
Elastic Net Logistic Regression Modeling
Regularized Objective Function: elastic net logistic regression incorporates a penalty term, which is added to regression objective function to avoid overly complex models. This approach addresses several limitations in unregularized logistic regression, such as multicollinearity, generalizability, and overfitting [42]. The elastic net logistic regression’s objective function is defined as the regularized average negative log-likelihood:
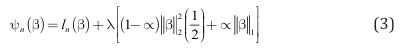
Minimizing the regularized negative log-likelihood in (3), tends to simultaneously minimize the negative log-likelihood corresponding to the first term on the right-hand side of (3) and minimize the second term on the right-hand side of (3), which is called the “penalty term.” Note that minimizing the penalty term will tend to generate a parameter vector β whose elements have magnitudes that are not close to zero. More specifically, the non-negative parameter λ is called the regularization term and the constant α specifies a trade-off between the effect of L1 (lasso) penalty 1 , which is the sum of the absolute values of all elements of β, and the effect of L2 (ridge) penalty 2 2 , which is the sum of the squares of all elements of β. Minimizing equation (3) is equivalent to the standard maximum likelihood estimation procedure for logistic regression in equation (1) when λ is equal to 0. The other hyperparameter α was set to a fixed value (around 0.4 to 0.5) in the algorithm to balance the contributions of lasso and ridge equally.
Repeated Model Run Procedure: We utilized the “cv. glmnet” function from the glmnet package in R [50,51], which allowed us to combine elastic net logistic regression with 10-fold cross-validation to determine the optimal λ that ensures the selection of a low-dimensional set of features that reliably predict the presence of DLD in participants.
Unlike unregularized regression, which produces a consistent model configuration regardless of participant arrangement, Elastic Net Models are highly sensitive to variation in how participants are distributed across the dataset. Specifically, changes in participant arrangement, the choice of λ [52], the optimization path, and fold assignment in cross-validation [53] can all lead to different fitted models, with different sets of selected features and estimated coefficients. That is, the cv.glmnet elastic net logistic regression algorithm, which searches for the best lambda regularization constant using 10-fold cross validation, could generate entirely different feature sets and estimated coefficients for the same data set, when the records are arranged in a different order. Therefore, recent work has emphasized the importance of repeated model fitting to characterize and reduce the effects of data arrangement variability [53,54]. In line with this approach, we reshuffled the dataset 200 times and fit the elastic net model to each resample to evaluate variability in performance and feature selection.
Using the model to explore DLD characteristics
In this first study we follow Fan et al. [37], to our exploration of DLD-related behavioral characteristics. Fan et al., developed their model on a small adult cohort with Williams Syndrome using extensive neuroanatomical data and then evaluated the model’s performance on an independent child cohort. Because we did not have access to an independent cohort, we adopted their approach by partitioning the Montgomery et al. database into two subsets of the entire database: 1) a training set comprising 70% of the data (n = 156) and 2) a holdout set comprising the remaining 30% (n = 67). We first trained on the 70% of the data and then validating the model on the remaining 30% of the data. We then reshuffled database, repartitioned into the two 70/30 and tested the model again 200 times.
The training set was used to fit the elastic net algorithm using the “cv.glmnet” function in R by determining the value of ???? and the other model parameters. In contrast, the holdout set was used to test the model’s generalizability in distinguishing participants from an independent group of children. Once model development was completed for each resample, the resulting model for a given sample was used to compute a probability score for every participant in both the training and holdout sets. This evaluation step was repeated over all 200 samples to reveal overall performance.
We assessed the discrimination ability of each of the 200 fitted models using Area under the receiver operating characteristic (ROC) curve (AUROC) analysis. Average AUROC values for the training and holdout sets were then computed to provide an overall measure of model stability, generalizability, and predictive performance. To illustrate how an individual model distinguished participants, we report the results for two models from the 200 runs: (1) the model that achieved the highest AUROC in discriminating DLD from TD participants on the training set (“best training model”), and (2) the model that achieved the highest AUROC in discriminating DLD from TD participants on the holdout set (“best holdout model”). The complete modeling procedures for Study 1 are outlined in Figure 2.
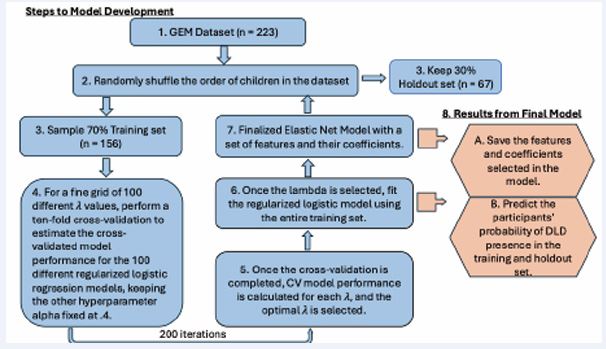
Figure 2 Illustration of elastic net logistic modeling methodology on the GEM database. Note: Steps 1-7 illustrate the steps carried out in our elastic net logistic regression algorithm. Step 8 includes the steps taken to obtain the performance metric and characteristics of fitted models.
RESULTS
The range of the AUROC for the 200 fitted elastic net models was 0.84–0.93 (mean = 0.88; SD = 0.017) and the range of the AUROC for the holdout set was 0.74–0.94 (mean = 0.85, SD = 0.04). These results indicate that the set of fitted models was effective in identifying both true positives and true negatives, both within in-sample and out-of-sample data,
Best Training Model
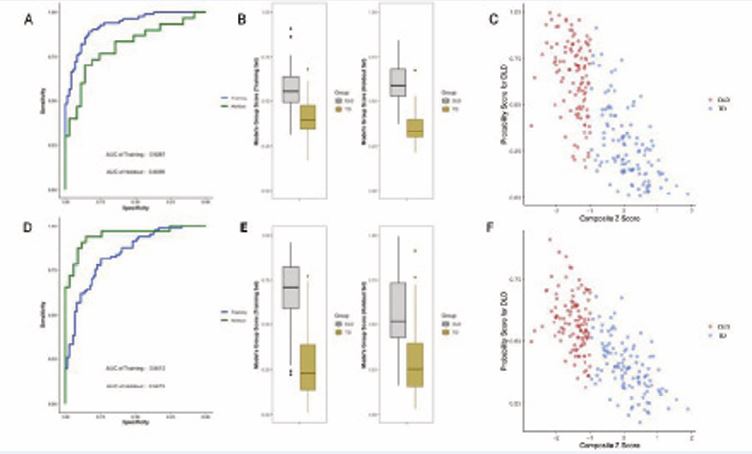
Figure 3 Best Training Model vs. Best Holdout Model in the 70% Sample Fit Note: Figure 3 (A- C) was derived using the best training model, and 3 (D-F) was derived using the best holdout model. The best training model is the classifier that discriminated participants in the training set the best, whereas the best holdout model discriminated participants in the holdout set the best. (A, D) Receiver operating characteristics (ROC) on the training (blue) and holdout (green) set. (B, E) Boxplots of the probability of DLD presence for DLD (grey) and TD (yellow). (C, F) Scatterplot of Predicted DLD probabilities Across Composite Language Z-Scores for DLD (red) and TD (royal blue).
Figure 3 (A) presents the ROC curves of the best training model on its training and holdout sets. The AUROC for its training set (0.9287) was notably higher than that of its holdout set (0.8099). Figure 3 (B) displays the probability scores generated by this model for DLD and TD children in both the training and holdout sets. Although some overlap in scores was observed between groups, the model generally separated them, with DLD children tending to receive higher probabilities (above 0.5) and TD children receiving lower probabilities (below 0.5). Figure 3 (C) compares the average probability score with composite language z-scores, a measure originally introduced by Montgomery et al. [55] to classify participants in the database into DLD and TD groups. Although the elastic net algorithm was trained on categorical group labels (DLD vs. TD) derived from these scores, but not trained on the z-scores themselves, a strong negative correlation was observed between predicted probabilities and composite language z-scores, r (221) = -0.75, p < 0.001. Children with lower language performance scores were more likely to be classified with DLD, and vice versa.
Best Holdout Model
Figure 3 (D) shows the ROC curves for the best holdout model on both the training and holdout sets. The AUROC for the training set (0.84) was lower than that for its holdout set (0.95). Figure 3 (F) presents the relationship between composite language z-scores and the model derived probability scores. Probability scores were again strongly and significantly correlated with composite language z-scores, r (221) = -0.72, p < 0.001, indicating that children with lower composite language scores had a higher probability of DLD, and vice versa.
The best training model retained 22 of the 71 features from the Montgomery et al dataset to classify DLD from TD, while the coefficients of the remaining features were shrunk to zero. In the best-performing holdout model, only 9 of the 71 features had non-zero coefficients.
STUDY TWO
If researchers who do not have access to an independent cohort, to be able to use the approach of Fan et al. [37] in Study 1, they must divide their data into training and holdout subsets. This strategy is highly valuable because the holdout set functions as an external validity test, providing insight into the real-world clinical usefulness of the fitted model. Yet, it also introduces challenges. Primary among them is greater variability in model configurations, stemming from the limited number of data points available for training. For example, the best-performing training model selected 22 of 71 features as DLD-specific, whereas the best holdout model retained only 9, yielding inconclusive evidence for DLD’s defining characteristics. A similar discrepancy emerged in discrimination ability: in Figure 3 (A), the best training model classified many children accurately within the training set but performed poorly on the holdout set. Conversely, in Figure 3 (D), the best holdout model achieved stronger holdout predictions but performed much worse on the training set.
METHODS
Given the substantial variability observed in Study 1, instead of using the hold-out approach, in Study 2 we use an “in-sample” approach where the elastic net algorithm is derived from all the participants at once. The result was 200 fitted models. We then examined the best- and worst performing models among the 200 runs. We also evaluated each model’s performance using cross-validated (CV) binomial deviance, obtained during the λ optimization and model fitting process. The model with the lowest mean CV deviance was designated the best-performing, as it achieved the most accurate out-of-sample classification. Conversely, the model with the highest mean CV deviance was deemed the worst-performing, reflecting the greatest out-of-sample classification error. To assess consistency, we also calculated average AUROC runs on the in-sample data. The complete modeling procedures for Study 2 are outlined in Figure 4.
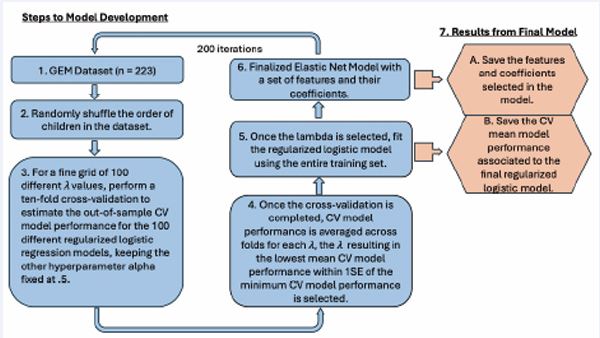
Figure 4 Illustration of elastic net logistic modeling methodology on the GEM database Note: Steps 1-6 illustrate the steps carried out in our elastic net logistic regression algorithm. Step 7 includes the steps taken to obtain the performance metric and characteristics of fitted models.
RESULTS
The range of the AUROC from the 200 models of elastic net modeling was 0.87–0.88 (mean = 0.87, SD = 0.002). These results indicate that the fit of all 200 models was consistently able to identify both true positives and true negatives. The ROCs of the best- and worst-performing elastic net models are shown in Figure 5 (A).
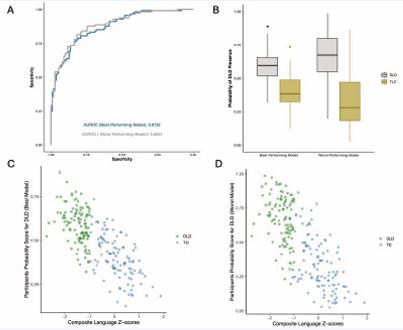
Figure 5 Best and Worst Model in the Full Sample Fit Note: Among the 200 elastic net runs, “best-performing model” and “worst-performing model” corresponded to the run with the highest CV and the lowest CV model performance, respectively. (A) ROC of the best (blue) and worst (grey) performing models. (B) Boxplots of the probability of DLD presence for DLD (grey) and TD (yellow) given by the “best-performing model” and the “worst-performing model”. (C) Predicted DLD probabilities Across Composite Language Z-scores for DLD (green) and TD (steel blue) using the best-performing model. (D) Predicted DLD probabilities Across Composite Language Z-scores for DLD (green) and TD (steel blue) using the worst-performing model.
The AUROC curve of the best-performing model on the participants was 0.87, while the worst-performing model achieved an AUROC of 0.88. Figure 5 (B) shows the predicted probabilities of DLD presence for individuals with and without DLD, as estimated by both the best and worst performing models. While some overlap exists between the two distributions of scores, children with DLD consistently received higher probability scores than those without, regardless of model quality. Specifically, the median probability for children with DLD was 0.67 in the worst-performing model and 0.60 in the best-performing model. Whereas for the children without DLD, the medians were 0.28 and 0.38, respectively. These stable separations between groups demonstrate that the elastic net approach reliably distinguished DLD from TD participants.
Finally, in Figure 5 (C) and (D), we compared the model derived probability scores with the composite language z-scores, a measure originally introduced by Montgomery et al. (2017), to classify participants in the database as DLD or TD. Although the elastic net algorithm was trained on the categorical labels (DLD vs. TD), which was a derivative of the composite language z-scores, it was not trained on the composite language z-scores themselves. Even so, the predicted probabilities were strongly correlated with composite language z-scores for both the best-performing model, r (221) = -0.75, p < 0.001, and the worst-performing model, r (221) = -0.75, p < 0.001. Children who had lower composite language scores had a higher probability of having DLD, and vice versa.
Table 1: Features and the Estimated Coefficients in the Single Best and the Worst Performing Elastic Net Models.
|
|
Best Performing Model |
Worst Performing Model |
|
Features |
Coefficients |
Coefficients |
|
Digit Span |
-0.0816 |
-0.2290 |
|
Digit Span trial score |
-0.0375 |
-0.0633 |
|
Nonword Repetition Percent Correct |
-0.0123 |
-0.029 |
|
Rapid Picture Naming RT |
0.0002 |
0.0009 |
|
Rapid Picture Naming Percent Correct |
NA |
-0.0163 |
|
Rapid Picture Naming Raw Score |
NA |
-0.0768 |
|
High Low Count Acc |
-0.0003 |
NA |
|
Verbal Working Memory Span |
-0.0518 |
-0.0905 |
|
Working Memory Trials Corr. |
-0.0467 |
-0.0683 |
|
Suffix_0_n_1 |
NA |
-0.0006 |
|
Suffix_1_n |
NA |
-0.0289 |
|
Passive Comprehension Accuracy |
-0.0012 |
-0.0027 |
|
Object Relative Comprehension Accuracy |
NA |
-0.0011 |
|
Non-Canonical Comprehension Accuracy |
-0.0014 |
-0.0037 |
|
Total Sentence Comprehension Accuracy |
-0.0075 |
-0.0078 |
Note: A value of “NA” in the coefficients indicates that the feature is not significant in classifying children with DLD from those without, according to the specific fitted model. The negative signed coefficients indicate an inverse relationship between that feature and DLD. For instance, when a participant has a higher value in features with negative value, the probability of the participant having DLD goes down and vice-versa.
Table 1 presents the features and their estimated coefficients in the highest-performing elastic net logistic model (.88) and those in the lowest-performing elastic net model (.87). Nine of the 71 experimental measures (e.g., features) were the same for both models. There were also features that were uniquely present in either the highest or the lowest performing model.
SUMMARY AND DISCUSSION
The purpose of this paper was to demonstrate how a statistical learning algorithm, specifically repeated elastic net regression, can be applied to derive predictive models that reveal underlying factors within complex, correlated behavioral datasets often observed in multidimensional disorders such as DLD. To this end, we examined 71 cognitive and language features from the Montgomery et al. [1, 55] database across two studies. In Study 1, the dataset was partitioned into a 70% training set and a 30% holdout set, enabling model development on the training subset and validation on the holdout subset. On average, the models achieved AUROCs of 0.88 and 0.85 for the training data and holdout data, demonstrating that they successfully captured the core characteristics of DLD and provided fair and accurate discrimination of DLD presence both in training and holdout sets. Specifically, these findings support a dimensional, probabilistic conceptualization of DLD consistent with both Dollaghan’s [23,24], and Gillam et al.’s [27], proposals that language impairment exists on a continuum of ability rather than as a discrete disorder. This study demonstrated that, unlike traditional unregularized regression, which needs hundreds or thousands of samples, requires researchers to choose “important”, independent, and uncorrelated features, and could still lead to overfitting issues, regularized regression, such as elastic net, can build a reliable model with high AUROC by leveraging the larger number of features from participants in a dataset.
However, the number of features and participants the elastic net needs comes with a caveat. Although Fan et al. [37] identified a WS-specific neuroanatomical profile by training the elastic net algorithm on only a small subset of participants (38 participants), they had a separate test cohort and large number (over 25,000) of neuroanatomical features. Because we did not have a separate test cohort, and our behavioral measures did not include as many features as the neuroanatomical ones in Fan et al.’s work, our splitting the data into a training and holdout set in study 1 led to some disadvantages. The first was that a smaller number of data points were in the training sets, leading to greater variability. We observed that subtle variations in the composition of participants in the training set, such as slightly higher versus lower scores on some features, produced notably different model configurations. Some runs included as few as nine features, and others included as many as twenty-seven. The AUROC of the fitted models also fluctuated remarkably across the training (range, 0.84–0.93) and holdout (range, 0.74–0.95) sets.
To address the variability in DLD feature selection and model performance observed in Study 1, we conducted a second study using the full set of participants from the database. This approach significantly improved the stability of the models’ performance on in-sample data, with AUROC values consistently ranging from 0.87 to 0.88 across runs. Furthermore, as summarized in the feature comparison table, models trained on the complete dataset tended to select a smaller subset of DLD-specific features on average than models trained on only 70% of the data.
A concern with our approach in Study 2 is that it was not tested and validated on an independent set. However, having conducted Study 1, the fitted models in Study 2 become more reliable. Despite being trained only on 70% of the data, the AUROC of the fitted models in Study 1 was around 0.85 on the holdout set. The fitted models in Study 2, which were trained on the entire database, include a larger representation of DLD-TD participants compared to Study 1; therefore, it is reasonable to infer that they should be equally or more reliable in identifying TD-DLD participants in an independent set. The studies together enable us to assess the effectiveness of the modeling output while evaluating a set of correlated behavioral measures.
Reconsidering the Categorical–Dimensional Debate
A central question raised in the introduction, and one that has shaped decades of inquiry, is whether DLD represents a distinct diagnostic category or the lower end of a continuous distribution of language ability. Dollaghan’s taxometric analyses were among the first to empirically test this issue, using distributional evidence to evaluate whether a natural “taxon” for DLD could be observed in linguistic data. Her results revealed no categorical boundary separating children with DLD from typically developing peers. Instead, language skills were distributed continuously, with considerable overlap between groups. The current findings echo and extend those results using a contemporary multivariate modeling approach.
Whereas Dollaghan’s analyses relied on a small number of language measures and the assumption of uncorrelated indicators, the Elastic Net algorithm allowed for correlated, high-dimensional input and directly modeled probabilistic membership along a continuum. The strong correlation between model-derived probability scores and continuous language measures replicates the core of Dollaghan’s insight that linguistic abilities vary by degree rather than kind, but does so within a modern computational framework capable of handling complex, interdependent features. Thus, our results lend quantitative and methodological reinforcement to the conclusion that DLD does not meet the criteria for a “natural kind” of disorder with distinct causal boundaries, but instead reflects gradations in general learning and processing efficiency.
Beyond assessing the classification performance of the elastic net algorithm, the analyses of both our studies indicate that model-derived probability scores may also capture meaningful variation in children’s language abilities. Although the algorithm was trained on a binary DLD vs. TD label rather than directly on composite language z-scores, the resulting probability scores were strongly correlated with those z-scores. This strong association suggests that, in addition to estimating the likelihood of DLD, the probability scores also reflect the severity of a child’s language impairment.
The present findings also converge with the GEM (Gillam, Evans, & Montgomery) model, which posits that sentence comprehension and broader language ability emerge from the dynamic interaction of fluid reasoning, controlled attention, working memory, and long-term language knowledge [1,27,43,44]. In this view, individual differences in language performance—whether labeled “DLD” or “typical”—reflect variation in the coordination of these mechanisms rather than the presence or absence of a categorical deficit.
By identifying the same domains as the most reliable predictors of diagnostic probability, the Elastic Net analysis demonstrates that language impairment is best modeled as a graded outcome of cognitive–linguistic integration, consistent with the GEM framework. Together, Dollaghan’s dimensional reasoning and the GEM model’s mechanistic structure provide complementary perspectives. Dollaghan showed that DLD lacks categorical distinctiveness at the behavioral level, while the GEM model explains that this happens because the same cognitive systems underlie language performance across the full ability continuum.
The Elastic Net model’s identification of predictors in the same domains as the GEM model supports the core claim that language proficiency depends on the coordinated functioning of general cognitive resources rather than isolated linguistic mechanisms. In both the confirmatory structural modeling of Gillam et al. [27], and the penalized regression approach used here the data converge on the same conclusion: linguistic skill reflects the integration of memory-related cognitive processes distributed along a continuum of efficiency.
Conceptually, these results reinforce the shift toward a multidimensional and probabilistic understanding of DLD. From this perspective, language difficulties are not a categorical “deficit” but a manifestation of subtle, continuous differences in the strength and coordination of cognitive mechanisms underlying language. This view challenges traditional diagnostic frameworks that impose arbitrary cut points on continuous distributions and supports emerging approaches that use multivariate profiles and continuous risk metrics to identify children who may benefit from intervention.
Clinically, this dimensional conceptualization aligns with precision-medicine approaches that emphasize individual variability and probabilistic risk rather than binary classification. Machine learning methods such as Elastic Net regression provide tools for developing data driven, individualized predictions of language performance that incorporate multiple interrelated sources of variance—cognitive, linguistic, and environmental— within a unified framework.
Future Directions
Future research should consider fitted models generated from multiple reshuffled datasets to better identify features that are truly DLD-specific. Even in Study 2, substantial differences in selected features emerged solely as a consequence of data reshuffling. This underscores that, rather than seeking a single “best” model with an optimal feature set, it is more informative to evaluate patterns across all 200 fitted models to pinpoint the cognitive and language processes most consistently impaired in children with DLD. Such ensemble-based approaches not only enhance clinical utility but may also provide insight into the causal mechanisms underlying DLD etiologies.
Similarly, the current use of elastic net also leaves open questions about the relative contribution of the predictive features it identified. For instance, in both the best- and worst-fitted models in study 2, the estimated coefficients for the Digit Span score are higher than those for total accuracy in the sentence comprehension task. Does the fitted model suggest that digit span, a working memory ability in children, is more salient in classifying children with DLD than the language ability itself? Future research could leverage the relative influence of features in the classification process and aggregate the output from the 200 runs of the elastic net model and Bayesian learning. Such analysis may underpin the relative weight of features in DLD—such as whether phonological working memory carries more weight than sentence comprehension—which may also specify screening and therapeutic strategies.
CONCLUSIONS
The present findings demonstrate that Elastic Net regression captures the dimensional, cognitively grounded structure of DLD predicted by the GEM model and supported by prior confirmatory analyses [27]. Both theory-driven and data-driven approaches converge on a unified view: language impairment in DLD reflects quantitative variation across interconnected cognitive systems, not a categorical disorder. This integration of cognitive theory and modern statistical modeling offers a powerful framework for understanding, predicting, and ultimately supporting language development across the full continuum of ability.
ACKNOWLEDGMENTS
This research was conducted using the secondary database collected by three investigators: Julia Evans, James Montgomery, and Ronald Gillam. We are grateful for their foundational contributions and the support provided by the National Institute on Deafness and Other Communication Disorders (Grant R01 DC010883). The analyses and interpretations presented in this study are solely those of the authors.
REFERENCES
- Montgomery JW, Gillam RB, Evans JL, Sergeev AV. “Whatdunit?” Sentence comprehension abilities of children with SLI: Sensitivity to word order in canonical and noncanonical structures. J Speech Lang Hear Res. 2017; 60: 2603-2618.
- Bishop DVM. Ten questions about terminology for children with unexplained language problems. Int J Lang Commun Disord. 2014; 49: 381-415.
- Leonard LB. Children with specific language impairment (2nd Edition). MIT Press. 2014.
- Tager-Flusberg H, Cooper J. Present and future possibilities fordefining a phenotype for specific language impairment. J Speech Lang Hear Res. 1999; 42: 1275-1278.
- Tomblin JB, Records NL, Buckwalter P, Zhang X, Smith E, O’Brien M. Prevalence of specific language impairment in kindergarten children. J Speech Lang Hear Res. 1997; 40: 1245-1260.
- Evans JL, Maguire MJ, Sizemore ML. Neural patterns elicited by lexical processing in adolescents with specific language impairment: Support for the procedural deficit hypothesis? J Neurodev Disord. 2022; 14: 20.
- Haebig E, Weber C, Leonard LB, Deevy P, Tomblin JB. Neural patterns elicited by sentence processing uniquely characterize typical development, SLI recovery, and SLI persistence. J Neurodev Disord, 2017; 9: 22.
- Law J, Rush R, Schoon I, Parsons S. Modeling developmental language difficulties from school entry into adulthood: Literacy, mental health, and employment outcomes. J Speech Lang Hear Res. 2009; 52: 1401- 1416.
- Conti-Ramsden G, Mok PL, Pickles A, Durkin K. Adolescents with a history of specific language impairment (SLI): strengths and difficulties in social, emotional and behavioral functioning. Res Dev Disabil. 2013; 34: 4161-4169.
- McGregor KK, Goffman L, Van Horne AO, Hogan TP, Finestack LH. Developmental language disorder: Applications for advocacy, research, and clinical Service. Perspectives of the ASHA Special Interest Groups. 2020; 5: 38-46.
- Mengisidou M, Marshall CR, Stavrakaki S. Semantic fluency difficulties in developmental dyslexia and developmental language disorder (DLD): Poor semantic structure of the lexicon or slower retrieval processes? Int J Lang Commun Disord. 2020; 55: 200-215.
- Evans JL, Gillam RB, Montgomery JW. Cognitive predictors of spoken word recognition in children with and without developmental language disorders. JSLHR. 2018; 61: 1409-1425.
- McMurray B, Apfelbaum KS, Tomblin JB. The slow development of real-time processing: Spoken-word recognition as a crucible for new thinking about language acquisition and language disorders. Curr Dir Psychol Sci. 2022; 31: 305-315.
- Montgomery JW, Evans JL, Gillam RB, Sergeev AV, Finney MC. “Whatdunit?” Developmental changes in children’s syntactically based sentence interpretation abilities and sensitivity to word order. Applied Psycholinguistics. 2016; 37: 1281-1309.
- Montgomery JW, Gillam RB, Evans JL. Syntactic versus memory accounts of the sentence comprehension deficits of specific language impairment: Looking Back, Looking Ahead. J Speech Lang Hear Res. 2016; 59: 1491-1504.
- Gray S, Fox AB, Green S, Alt M, Hogan TP, Petscher Y, et al. Working memory profiles of children with dyslexia, developmental language disorder, or both. J Speech Lang Hear Res. 2019; 62, 1839-1858.
- Larson C, Ellis Weismer S. Working Memory Performance in Children with Developmental Language Disorder: The Role of Domain. J Speech Lang Hear Res. 2022; 65: 1906-1920.
- Blom E, Boerma T. Do Children With Developmental Language Disorder (DLD) Have Difficulties With Interference Control, Visuospatial Working Memory, and Selective Attention? Developmental Patterns and the Role of Severity and Persistence of DLD. J Speech Lang Hear Res. 2020; 63: 3036-3050.
- Smolak E, McGregor KK, Arbisi-Kelm T, Eden N. Sustained Attention in Developmental Language Disorder and Its Relation to Working Memory and Language. J Speech Lang Hear Res. 2020; 63: 4096-4108.
- Bishop DV, Snowling MJ, Thompson PA, Greenhalgh T; CATALISE consortium. CATALISE: A Multinational and Multidisciplinary Delphi Consensus Study. Identifying Language Impairments in Children. PLoS One. 2016; 11: e0158753.
- Bishop DVM, Snowling MJ, Thompson PA, Greenhalgh T; and the CATALISE-2 consortium. Phase 2 of CATALISE: a multinational and multidisciplinary Delphi consensus study of problems with language development: Terminology. J Child Psychol Psychiatry. 2017; 58: 1068-1080.
- Leonard LB. Is specific language impairment a useful construct? In S. Rosenberg (Ed.), Advances in applied psycholinguistics: 1987: 1-39.
- Dollaghan CA. Taxometric Analyses of specific language impairment in 3- and 4-Year-Old Children. J Speech Lang Hear Res. 2004; 47: 464-475.
- Dollaghan CA. Taxometric Analyses of specific language impairment in 6-Year-Old Children. J Speech Lang Hear Res. 2011; 54: 1361-1371.
- Evans JL, Brown TT. Neurobiology of Specific language impairment. In Hickock, G & Small, S. (Eds) Neurobiology of language. 2016: 899-912.
- Evans JL Brown TT. Developmental Language Impairments in Children. In Squire, L. (Ed) New Encyclopedia of Neuroscience Oxford press. 2019.
- Gillam RB, Serang S, Montgomery JW, Evans JL. Cognitive processes related to memory capacity explain nearly all of the variance in language test performance in school-age children with and without developmental language disorder. Front Psychol. 2021; 12: 724356.
- Plante E, Vance R. Selection of preschool language tests: A data-basedapproach. Lang Speech Hear Serv Sch. 1994; 25: 15-24.
- Spaulding TJ, Plante E, Farinella KA. Eligibility criteria for language impairment. Lang Speech Hear Serv Sch. 2006; 37: 61-72.
- Meehl PE. Factors and Taxa, Traits and Types, Differences of degree and differences in kind. J Personality. 1992; 60: 117-174.
- Meehl PE. Bootstraps taxometrics: Solving the classification problem in psychopathology. Am Psychol. 1995; 50: 266-275.
- Meehl PE. Clarifications about taxometric method. Appl Preven Psychol. 1999; 8: 165-174.
- Lancaster HS, Camarata S. Reconceptualizing developmental language disorder as a spectrum disorder: issues and evidence. Int J Lang Commun Disord. 2019; 54: 79-94.
- Fung LK, Reiss AL. Moving Toward Integrative, Multidimensional Research in Modern Psychiatry: Lessons Learned From Fragile X Syndrome. Biol Psychiatry. 2016; 80: 100-111.
- De Clercq B, De Fruyt F, Widiger TA. Integrating a developmental perspective in dimensional models of personality disorders. Clin Psychol Rev. 2009; 29: 154-162.
- Ecker C, Marquand A, Mourão-Miranda J, Johnston P, Daly EM, Brammer MJ, et al. Describing the brain in autism in five dimensions--magnetic resonance imaging-assisted diagnosis of autism spectrum disorder using a multiparameter classification approach. J Neurosci. 2010; 30: 10612-10623.
- Fan CC, Brown TT, Bartsch H, Kuperman JM, Hagler DJ Jr, Schork A, et al. Williams syndrome-specific neuroanatomical profile and its associations with behavioral features. Neuroimage Clin. 2017; 15: 343-347.
- Chailangkarn T, Trujillo CA, Freitas BC, Hrvoj-Mihic B, Herai RH,Yu DX, et al. A human neurodevelopmental model for Williamssyndrome. Nature. 2016; 536: 338-343.
- Ruscio J, Ruscio AM, Carney LM. Performing Taxometric Analysis to Distinguish Categorical and Dimensional Variables. J Exp Psychopathol. 2011; 2: 170-196.
- Bora DJ, Mishra MK. Comparative Evaluation of Hard and Soft Clustering for Precise Brain Tumor Segmentation in MR Imaging. J Adv Math Comput Sci. 2025; 40, 127-141.
- Sirimongkolkasem T, Drikvandi R. On regularisation methods foranalysis of high dimensional data. Ann Data Sci. 2019; 6: 737-763.
- Zou H, Hastie T. Regularization and variable selection via the elastic net. Journal of the Royal Statistical Society Series B: Statistical Methodology. 2005; 67: 301-320.
- Gillam RB, Montgomery JW, Evans JL, Gillam SL. Cognitive predictors of sentence comprehension in children with and without developmental language disorder: Implications for assessment and treatment. Int J Speech Lang Pathol. 2019; 21: 240-251.
- Montgomery JW, Gillam RB, Evans JL. A New Perspective on the Connection between Memory and Sentence Comprehension in Children with Developmental Language Disorder. In: Schwieter JW, Wen Z (Edward), eds. The Cambridge Handbook of Working Memory and Language. Cambridge Handbooks in Language and Linguistics. Cambridge University Press. 2022; 776-800.
- Roid GH, Miller LJ. Leiter International Performance Scale— Revised. Wood Dale, IL: Stoelting. 1997.
- American National Standards Institute. Specifications of Audiometers (ANSI/ANS-8.3-1997; R2003). New York, NY: Author. 1997.
- Hammill DD, Newcomer PL. Test of Language Development–Intermediate: Fourth Edition. Austin, TX: Pro-Ed. 2008.
- Wallace G, Hammill D. Comprehensive Receptive and Expressive Vocabulary Test–Second Edition. Austin, TX: Pro-Ed. 2000.
- Semel E, Wiig E, Secord W. Clinical Evaluation of Language Fundamentals–Fourth Edition. San Antonio, TX: The Psychological Corporation. 2003.
- Friedman J, Hastie T, Tibshirani R. Regularization Paths for Generalized Linear Models via Coordinate Descent. J Stat Softw. 2010; 33: 1-22.
- Friedman J, Hastie T, Tibshirani R, Narasimhan B, Tay K, Simon N, et al. glmnet: Lasso and elastic-net regularized generalized linear models (Version 4.1-8) [R package manual]. CRAN. 2023.
- Meinshausen N, Bühlmann P. Stability selection. Journal of the RoyalStatistical Society Series B: Statistical Methodology. 2010; 72: 417-473.
- Bøvelstad HM, Nygård S, Størvold HL, Aldrin M, Borgan Ø, Frigessi A, et al. Predicting survival from microarray data--a comparative study. Bioinformatics (Oxford, England). 2007; 23: 2080-2087.
- Greenwood CJ, Youssef GJ, Letcher P, Macdonald JA, Hagg LJ, Sanson A, et al. A comparison of penalised regression methods for informing the selection of predictive markers. PLoS One. 2020; 15: e0242730.
- Montgomery JW, Evans JL, Fargo JD, Schwartz S, Gillam RB. Structural relationship between cognitive processing and syntactic sentence comprehension in children with and without developmental language disorder. J Speech Lang Hear Res. 2018; 61: 2950-2976.
- Bureau UC. Census.gov | U.S. Census Bureau Homepage. Census Gov. 2025.


