A Cross-Sectional Study of Relation between QT Interval and T-Waves Variables in Hypertensive patients with and without Left Ventricular Hypertrophy
- 1. Department of Cardiology, Sree Balaji Medical College and Hospital Chennai, India
Abstract
Background: Hypertension is a major cardiovascular disorder associated with structural and electrical alterations of the heart, particularly the development of left ventricular hypertrophy (LVH), which increases the risk of arrhythmias, heart failure, and sudden cardiac death. The electrocardiogram (ECG) is a simple and widely available tool to assess these changes, where the QT interval reflects the total duration of ventricular depolarisation and repolarisation, and T-wave variables indicate repolarisation heterogeneity. Prolongation of QT interval and abnormalities in T-wave morphology are considered markers of electrical instability and arrhythmic risk. Hypertensive patients with LVH are believed to exhibit greater disturbances in these repolarisation indices compared to those without LVH, yet the extent and clinical relevance of this relationship remain subjects of ongoing evaluation. Therefore, assessing the association between QT interval and T-wave parameters in hypertensive patients with and without LVH may contribute to better risk stratification and improved management of arrhythmic complications in this population.
Objectives: The objective of this study is to investigate the relationship between QT interval and T- wave variables in hypertensive patients with and without left ventricular hypertrophy (LVH). It aims to assess how hypertension-induced cardiac changes influence ventricular repolarization patterns. By analyzing these electrocardiographic markers, the study seeks to identify potential differences in electrical activity between the two groups. This may help improve risk stratification and early detection of arrhythmia susceptibility in hypertensive patients.
Study Design: A cross-sectional study.
Methods: This cross-sectional observational study will include hypertensive patients who will be divided into two groups: those with LVH and those without LVH based on echocardiography. Patients with myocardial infarction, conduction abnormalities, electrolyte imbalance, pacemaker, or on QT-altering drugs will be excluded. A standard 12-lead ECG will be recorded, and QT interval, QTc, QT dispersion and T-wave variables will be measured.
Results: Hypertensive patients with LVH showed significantly prolonged QT and QTc intervals compared to those without LVH.QT dispersion and T-wave abnormalities, including increased Tp–Te interval, were more prominent in the LVH group. T-wave amplitude and morphology changes indicated greater repolarisation heterogeneity in LVH patients. A significant association was observed between QT parameters and T-wave variables in hypertensive patients.
Conclusion: Hypertensive patients with LVH demonstrate greater repolarisation abnormalities than those without LVH.QT interval and T-wave variables may serve as useful ECG markers for identifying increased arrhythmic risk in hypertensive patients.
Citation
Jayabharathi A, Deepa V (2026) A Cross-Sectional Study of Relation between QT Interval and T-Waves Variables in Hypertensive patients with and without Left Ventricular Hypertrophy. J Cardiol Clin Res. 14(1): 1220.
INTRODUCTION
Diabetes mellitus is one of the most common chronic metabolic disorders, characterized by elevated blood glucose levels resulting from insulin deficiency, resistance,, or both (Grob et al., 2015). The disease affects multiple organ systems and is associated with increased morbidity and mortality, particularly among patients with cardiovascular disease. The global prevalence of diabetes has risen in recent decades [1]. The physiological stress induced by surgery and anesthesia further influences insulin resistance, leading to perioperative hyperglycemia. This hyperglycemic state has been associated with adverse outcomes such as delayed wound healing, higher rates of infection, prolonged hospital stays, and increased risks of cardiovascular complications [2]. Cardiac surgery itself induces a significant metabolic response that alters glucose levels. The release of counter regulatory hormones such as cortisol, catecholamines and glucagon leads to impaired glucose utilization and increased gluconeogenesis, resulting in elevated blood glucose levels during and after surgery [3].The American Heart Association (2013) reported that poor glycemic control is strongly correlated with adverse cardiac events, particularly in patients with acute coronary syndrome. Several studies have attempted to define the benefits of strict glycemic control. Ponnusamy et al., demonstrated that implementing tight perioperative glycemic protocols led to a significant reduction in surgical site infections and overall complications among diabetic patients. Similarly, Malinowski et al., in a meta-analysis of clinical trials, found that consistent control of glucose levels during the pre, peri, and postoperative periods was associated with improved recovery and reduced hospital stays. Effective perioperative glycemic control has become a critical component of surgical care. However, the optimal level of glycemic control, particularly in terms of how “tight” or “standard” glucose targets should be is an ongoing debate. While tighter glucose control may reduce complications, it also raises the risk of hypoglycemia, which itself is associated with poor outcomes (D’Agostino et al,.2019). According to current guidelines by the American Diabetes Association (ADA, 2022), maintaining blood glucose levels below 180 mg/dL during the perioperative period is considered safe. Variations in definitions, target ranges, and monitoring stratagies across studies make it challenging to compare outcomes and establish standardized protocols.
MATERIALS AND METHODS
Study Design
A Cross-sectional study.
Study Period
6 months.
Study Place
Department Of Cardiology, Sree Balaji Medical College and Hospital, Chrompet, Chennai.
Study Population
35 patients diagnosed with non-ST-elevation myocardial infarction (NSTEMI) who were admitted to the cardiology department of Sree Balaji Medical College and Hospital.
Inclusion Criteria
- Adult patients aged 18-75 years (Table 1) (Figure 1).
- Diagnosed with hypertension (defined as systolic blood pressure ≥ 140 mmHg and/or diastolic blood pressure ≥ 90 mmHg).
Table 1: Age Distribution of Patients
|
Age Group (Years) |
Frequency(n) |
Percentage (%) |
|
30-40 |
6 |
17.1 |
|
41-50 |
11 |
31.4 |
|
51-60 |
10 |
28.6 |
|
61-70 |
8 |
22.9 |
|
Total |
35 |
100 |
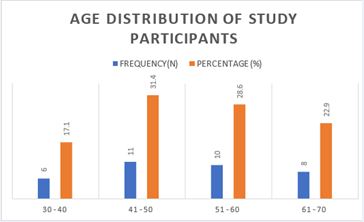
Figure 1 Age Distribution.
-
- Group 1: Hypertensive patients with left ventricular hypertrophy (LVH), confirmed by echocardiogram or electrocardiogram
- Group 2: Hypertensive patients without LVH.9
- Ability to provide informed consent.
Exclusion Criteria
-
- History of significant cardiac arrhythmias, including ventricular tachycardia or fibrillation.
- Presence of other cardiovascular diseases (e.g., coronary artery disease, heart failure).
- Electrolyte imbalances or metabolic disorders affecting cardiac repolarization (e.g., hyperkalemia, hypokalemia).
- Known structural heart conditions other than LVH (e.g., valvular heart disease).
- Pregnant or breastfeeding women.
- Inability to perform the necessary diagnostic tests (e.g., echocardiography or ECG).
Methodology
This cross-sectional analytical study evaluates the relationship between QT interval and T-wave variables in 35 adult patients with systemic hypertension, with and without left ventricular hypertrophy (LVH), selected from the cardiology outpatient department or ward of a hospital. Hypertensive patients aged 30 years and above who underwent 12-lead ECG and two- dimensional echocardiography, provided informed consent, and had complete clinical, ECG, and echocardiographic data were included. Patients with ischemic heart disease, bundle branch block, atrial fibrillation, cardiomyopathy, congenital heart disease, electrolyte imbalance, QT- altering medications, poor-quality ECGs, or incomplete data were excluded. Baseline clinical details and risk factors were recorded. ECG parameters including QT interval, corrected QT interval (QTc), T- wave duration, amplitude, and dispersion were manually measured using standard techniques. Echocardiography was used to determine the presence or absence of LVH, and patients were categorized accordingly. ECG parameters were compared between the two groups to assess the association between ventricular repolarization abnormalities and LVH in hypertensive patients (Table 2-Table 6).
Data Collection
All the patients attending to Sree Balaji Medical College Hospital, Chromepet Chennai were screened for eligibility. The eligible patients were administered an informed.

Figure 2 Gender Distribution of Patients Graph.
Table 2: Gender Distribution of Patients.
|
Gender |
Frequency(n) |
Percentage (%) |
|
Male |
18 |
51.4 |
|
Female |
17 |
48.6 |
|
Total |
35 |
100 |
Table 3: Distribution based on LVH states
|
LVH Status |
Frequency (n) |
Percentage (%) |
|
With LVH |
18 |
51.4 |
|
Without LVH |
17 |
48.6 |
|
Total |
35 |
100 |
Table 4: Distribution of Clinical Symptoms
|
Symptoms |
Yes n (%) |
No (%) |
|
Chest pain |
34.3 |
65.7 |
|
Palpitation |
28.6 |
71.4 |
|
Breathlessness |
40 |
60 |
|
Fatigue |
51.4 |
48.6 |
Table 5: Comparison of QT Interval Parameters between LVH and Non LVH
|
Parameters |
LVH |
Without LVH |
|
QT Interval (Ms) |
429.5 |
447 |
|
QTC Interval (Ms) |
449.5 |
467 |
|
QT Dispersion (Ms) |
51.16 |
51.7 |
Table 6: Comparison of T-Wave Variable between LVH and Non-LVH
|
Parameters |
LVH |
Without LVH |
|
T. Amplitude |
0.395 |
0.57 |
|
T. Asymmetric |
1.39 |
1.74 |
|
T. Aeration |
169.5 |
176.4 |
|
T. Dispersion |
39.5 |
39.05 |
consent. The consented participants were enrolled in the present study. Descriptive data of participants like name, age, sex, personal history, occupation, were obtained by interviewing the patients. Each of the patient’s proper history was recorded on predesigned and pretested Proforma. They underwent through physical examination, ECG and Echo.
RESULTS AND DISCUSSION
Results
In this cross-sectional study, hypertensive patients were evaluated to assess the relationship between QT interval and T-wave variables in those with and without left ventricular hypertrophy (LVH). The majority of the study population belonged to the middle-aged group (41–60 years), with nearly equal distribution between males and females. Based on echocardiographic findings, a higher proportion of patients exhibited LVH, indicating a significant burden of structural cardiac changes among hypertensive individuals. Clinical symptoms such as headache, giddiness, chest discomfort, and palpitations were more commonly observed in patients with LVH. Comparative analysis revealed that QT interval, corrected QT interval (QTc), and QT dispersion were significantly prolonged in hypertensive patients with LVH when compared to those without LVH. In addition, T-wave variables, including T-wave amplitude and T-peak to T-end (Tp–Te) interval, were also increased in the LVH group, reflecting greater heterogeneity of ventricular repolarization. Overall, the findings demonstrate that hypertensive patients with left ventricular hypertrophy exhibit more pronounced ventricular repolarization abnormalities than those without LVH, suggesting an increased risk of electrical instability in this group (Figure 2 and Figure 3).
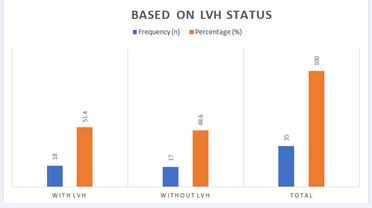
Figure 3 Distribution based on LVH states Graph.
Discussion
The present cross-sectional study was conducted to evaluate the relationship between QT interval and T-wave variables in hypertensive patients with and without left ventricular hypertrophy (LVH). Hypertension produces both structural and electrical remodeling of the myocardium, and electrocardiographic parameters provide a simple method to assess these changes. In the present study, the age distribution showed that the majority of patients belonged to the 41–50 years (31.4%) and 51–60 years (28.6%) age groups. This finding indicates that hypertensive cardiac changes, including LVH and repolarisation abnormalities, are more common in middle-aged and elderly individuals. Long-standing hypertension leads to progressive myocardial hypertrophy and fibrosis, which become more evident with advancing age.
Gender distribution in the study population was almost equal, with males constituting 51.4% and females 48.6%. This suggests that hypertensive heart disease and its associated electrical changes affect both genders almost equally. The near-equal gender representation reduces gender bias and allows better interpretation of ECG changes related to hypertension rather than sex-related differences. With respect to LVH status, 51.4% of patients had LVH, while 48.6% did not. This highlights the high prevalence of structural cardiac involvement among hypertensive patients. LVH represents an adaptive response to chronic pressure overload, but it is also associated with altered myocardial conduction and increased arrhythmic risk. Analysis of clinical symptoms revealed that fatigue (51.4%) and breathlessness (40%) were the most common symptoms among the study population. These symptoms reflect reduced myocardial compliance and diastolic dysfunction commonly seen in hypertensive patients,
particularly those with LVH. Palpitations and chest pain were less frequently reported but may indicate underlying electrical instability.
Comparison of ECG interval parameters between LVH and non-LVH groups showed notable differences in QT and QTc intervals. Patients with LVH demonstrated altered QT interval and QTc values, indicating delayed ventricular repolarisation. QT dispersion was slightly higher in patients with LVH compared to those without LVH, suggesting increased heterogeneit ventricular repolarisation. Increased QT dispersion is a known marker of electrical instability and is associated with a higher risk of ventricular arrhythmias. Evaluation of T-wave variables further supported the presence of repolarisation abnormalities in hypertensive patients with LVH. T-wave amplitude was reduced in the LVH group, indicating impaired repolarisation. T-wave asymmetry and T-wave area were also altered, reflecting changes in myocardial action potential duration and regional repolarisation differences. Although T-wave dispersion values were similar between the two groups, subtle variations suggest early electrical remodeling in LVH patients.
Overall, the findings of this study demonstrate that hypertensive patients with LVH exhibit more pronounced abnormalities in QT interval and T-wave variables compared to patients without LVH. These ECG changes reflect underlying myocardial hypertrophy, fibrosis, and altered ion channel activity, all of which contribute to increased arrhythmic susceptibility.
ACKNOWLEDGEMENT
This study becomes a reality with the kind support and help of many individuals, I would like to extend my sincere thanks to all of them. First and fore most I would like to express my deepest gratitude to my parents Mr. R Ananthan, and Mrs. Sudha A, my brother Mr. Pugazh Vendhan A they prepared me for life, whose love and blessings made me the person I am today. It gives me great pleasure in preparing this dissertation and I take this opportunity to thank everyone who has made this possible. I would like to express my sincere gratitude to the Almighty for giving me the strength and wisdom to complete this dissertation.
I extend my heartfelt thanks to the management of Sree Balaji Medical College and Hospital, a constituent college of Bharath Institute of Higher Education and Research, for providing me the opportunity and facilities to carry out this study.
I am immensely grateful to Professor Dr. Jagan G. MD, DM, head of the department (Cardiology), and all faculty members for their valuable insights.
I also thank Dr. P. Sasikumar, MS., DNB., Ph.D., Dean of Sree Balaji Medical College and Hospital, for granting me permission to conduct the study.
I would like to thank Dr. Jinu Merlin Koshy, Vice Principal, and Dr. Zioni Sangeetha, Asst. Prof.,Dr.Vasanth Kumar Asst. Prof.,for their immense support to do this study on patients.
A particular thanks to tutor of Cardiac Technology, Ms. Deepa V, for their guidance and support from day one of this study. Finally, I am grateful to the patients who participated in this study and to my family and friends for their unconditional support and encouragement.
STATEMENT OF INFORMED CONSENT
Written informed consent was obtained from all patients prior to their participation in the study. The purpose of the study was explained to the participants, and confidentiality of patient information was strictly maintained throughout the study.
ETHICS OF HUMAN EXPERIMENTATION
The study was conducted in accordance with the ethical standards of the Institutional Ethics Committee of Sree Balaji Medical College and Hospital. Ethical clearance was obtained prior to the commencement of the study. All procedures performed in this study involving human participants were in accordance with the ethical standards of the institutional research committee and with the principles of the Declaration of Helsinki.
REFERENCES
- Rautaharju PM, Surawicz B, Gettes LS. AHA/ACCF/HRS recommendations for the standardization and interpretation of the electrocardiogram: Part IV: The ST segment, T and U waves, and the QT interval: A scientific statement from the American Heart Association Electrocardiography and Arrhythmias Committee, Council on Clinical Cardiology; the American College of Cardiology Foundation; and the Heart Rhythm Society. J Am Coll Cardiol. 2009; 53: 982-991.
- Goldberger JJ, Cain ME, Hohnloser SH, Kadish AH, Knight BP, Lauer MS, et al. American Heart Association/American College of Cardiology Foundation/Heart Rhythm Society scientific statement on noninvasive risk stratification techniques for identifying patients at risk for sudden cardiac death: A scientific statement from the American Heart Association Council on Clinical Cardiology Committee on Electrocardiography and Arrhythmias and Council on Epidemiology and Prevention. J Am Coll Cardiol. 2008; 52: 1179-1199.
- Gussack I, Antzelevitch C. Springer: London Limited. Verlag; 2008. Electrical Diseases of the Heart.Genetics, Mechanisms, Treatment, Prevention.