Albumin Level upon Hospitalization Predicts Responsiveness to Anti-Tuberculosis Therap
- 1. Department of Pharmacy, Osaka-Minami Medical Center, Japan
- 2. BML Kawagoe Laboratory, Japan
- 3. Department of Clinical Laboratory, Kinki-Chuo Chest Medical Center, Japan
- 4. Department of Internal Medicine, Kinki-Chuo Chest Medical Center, Japan
Abstract
Purpose: The relevance of Time to Disappearance (Td) of Tuberculosis (TB) bacilli from sputa in response to anti-TB therapy and clinical parameters were investigated to determine clinical factors that predict response to anti-TB therapy.
Method: A total of 92 consecutive inpatients less than 80 years old with positive sputum participated in this study. Reactivity to anti-TB therapy was investigated by assessing Td of TB bacilli from sputa. All patients initially expelled drug-sensitive TB bacilli before undergoing first-time anti-TB therapy with isoniazide, rifampicin, ethanbutol, and pyrazinamide.
Result: TB bacilli disappeared from sputa of 76 patients (83.6%) within 30 days after the start of medication. These subjects were categorized as good responders. Despite continuing with standard anti-TB therapy, the remaining 16 patients continued to test positive for TB bacilli in sputum and were therefore poor responders. There were significant differences in C-Reactive Protein concentration (CRP) and proliferation of TB bacilli in sputum smears between the two groups. Multiple linear regression analysis showed that parameters affecting Td were albumin levels and amount of TB bacilli in sputa.
Conclusion: Albumin level and amount of TB bacilli in sputum at the time of hospitalization is an indicator of Td.
Keywords
• Tuberculosis
• Albumin titer
• Sputum culture
• Anti-tuberculosis therapy
Citation
Ootsu Y, Akiyama I, Hatsuda K, Hayashi S (2014) Albumin Level upon Hospitalization Predicts Responsiveness to Anti-Tuberculosis Therapy. Clin Res Pulmonol 2(1): 1013.
ABBREVIATIONS
TB: Tuberculosis; QOL: Quality Of Life; AFB: Acid-Fast Bacilli; HPF: High-Power Field; Td: Time to Disappearance; Alb: Serum Albumin; CRP: C-Reactive Protein; RBC: Peripheral Red Blood Cells; WBC: Peripheral White Blood Cells
INTRODUCTION
Tuberculosis (TB) is an infectious disease with an incidence of 19.4 cases per 100,000 in 2010 [1], and is prevalent worldwide on a very large scale [2]. The introduction of combination chemotherapy achieves high cure rates [3]; however, in spite of the implementation of chemotherapy, there are still patients who expel sputum positive for TB bacilli over long periods. Prolonged positivity increases the chance of spreading infection and deterioration of Quality Of Life (QOL) of patients due to prolonged hospitalization. Thus, improving treatment outcomes for patients who respond poorly to therapy remains a significant concern for health administration.
Malnutrition is listed as a critical risk factor for contracting TB. Protein-energy malnutrition causes major impairment of the immune system [4,5], which is likely to cause poor TB treatment outcomes [6]. Palmer et al. reported the relationship between TB morbidity and nutrition [7]; however, factors that affect the efficacy of anti-TB chemotherapy are yet to be determined.
Identifying TB patients at risk of persistent sputum culture positivity and directing interventions at these patients are rational and promising approaches for improving responsiveness to anti-TB treatment and subsequently decreasing hospitalization periods. Appropriately evaluating the status of patients requiring nutritional interventions is a crucial procedure for ensuring effective allocation of medical resources that carry out nutritional therapy. This investigation examined the relationship between clinical parameters of TB patients and the effects of anti-TB therapy to determine clinical indexes that predict responsiveness to the therapy.
MATERIALS AND METHODS
Patients
This study examined 103 patients who were admitted to Kinki-Chuo Chest Medical Center from April 2007 to August 2008 for testing positive for sputum cultures of TB bacilli. All patients were less than 80 years old and underwent first-time anti-TB treatment uneventfully. Patients who expelled TB bacilli resistant to either isoniazide or rifampicin were excluded from this study. Of the 103 patients, 11 were excluded because of outlying or missing values. Among the 92 patients tested, 16 had diabetes mellitus. All patients received anti-TB therapy consisting of isoniazide (10 mg/kg/day), rifampicin (5 mg/kg/ day), ethanbutol (15 mg/kg/day), and pyrazinamide (25 mg/kg/ day).
Sputa samples obtained from patients were placed on a glass slide and stained according to the Ziehl–Neelsen procedure. Acid-fast bacilli (AFB) were detected by bright-field microscopy at 1000× magnification, that is, at high-power field (HPF). The amount of TB bacilli was classified into the following grades: negative (no AFB in 100 HPF), scanty (1–9 AFB/100 HPF), 1+ (10–99 AFB/100 HPF), 2+ (1–10 AFB/1 HPF on average), and 3+ (>10 AFB/1 HPF on average) [8]. Grades scanty, 1+, 2+, and 3+ were designated as grades 0, 1, 2, and 3, respectively, for statistical analysis on ordinal scales. The effects of anti-TB treatment were assessed by Time to Disappearance (Td), which was defined as the time from the start of chemotherapy until the first of three consecutive sputum cultures negative for TB bacilli.
ALB-P reagent (Sysmex Co., Ltd., Hyogo, Japan) was to measure Serum Albumin (Alb) levels. N-assay LA CRP-S (Nittobo Medical Co., Ltd., Tokyo, Japan) was utilized to measure C-Reactive Protein (CRP) levels and a Sysmex XE-2100 (Sysmex Co., Ltd., Kobe, Japan) was used to count peripheral White Blood Cells (WBC).
Statistical analysis
Td was calculated by using the Kaplan–Meier method, and the log-rank test was used to evaluate the difference in Td. Wilcoxon signed rank test was used to identify differences between clinical parameters. The Spearman’s rank correlation coefficient was used to measure correlations between clinical parameters. Multiple linear regression analysis was used to test clinical parameters at the time of hospitalization that affect Td. Statistical significance was assumed at p < 0.05. JMP software (version 9.0.2) was used for statistical calculations.
RESULTS AND DISCUSSION
Td of TB bacilli was adopted as a parameter of anti-TB therapy efficacy. Chronological change in the proportion of patients with sputum positive for TB bacilli was approximated through the formula y = 1.1199e−0.0669x (e: base of natural logarithm) (Figure 1)
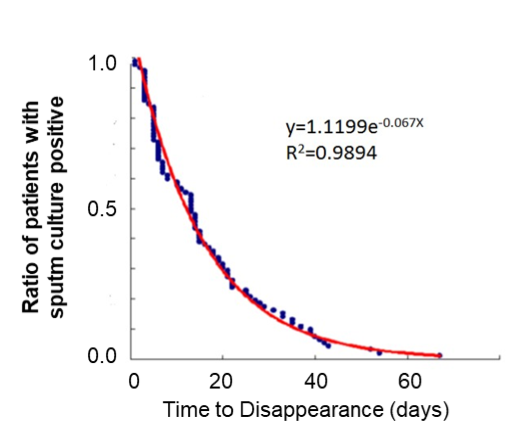
Figure 1: Chronological change in the proportion of patients with sputum cultures positive for TB bacilli. The number of patients with positive sputum cultures decreased exponentially after the start of anti-TB therapy. Twelve percent of patients expelled live bacilli after the start of treatment, necessitating extended periods of hospitalization.
For 76 out of 92 patients (83.6%), sputum cultures for TB bacilli tested negative within 30 days after the start of treatment. These patients were designated as good responders. Despite continuing with standard anti-TB therapy, the remaining 16 patients (17.4%) continued to test positive in sputum cultures for TB bacilli and were therefore poor responders.
We determined the clinical backgrounds of good and poor responders in order to define the characteristics of TB patients with persistent positivity for sputum cultures (Table 1)
Table 1: Background characteristics of good and poor responders.
|
Group (Male/Female) |
Good Responders (58/18) |
Poor Responders (14/2) |
p value |
|
Age (y.o.) |
58 (19-79) |
55 (23-73) |
N.S. |
|
Body Weight (kg) |
56.9 (32.0-91.5) |
56.5 (45.9-74.1) |
N.S. |
|
WBC (x103per mm3) |
7.2 (9.3-16.4) |
7.5 (5.3-15.2) |
N.S. |
|
RBC (x10?per mm3) |
443 (310-579) |
440 (306-560) |
N.S. |
|
Alb (g/dL) |
3.9 (2.3-5.0) |
3.8 (2.3-4.6) |
N.S. |
|
CRP ( mg/dL) |
1.8 (0.0-20.4) |
5.4 (0.4-10.1) |
p<0.05 |
|
AFB grade |
1 (0-3) |
3(1-3) |
P<0.01 |
Abbreviations: Good responders: patients whose Td is less than 30 days; Poor responders: patients whose Td is equal or more than 30 days; Alb: Serum Albumin Titer; CRP: C-Reactive Protein; AFB: Acid-Fast Bacilli; NS: Not Significant.
Data are presented as median (range).
There were significant differences in CRP levels and the amount of TB bacilli in sputum smears between the two groups; however, there were no significant differences in age, body weight, WBC, RBC, or Alb levels.
We then attempted to predict Td, a dependent variable, by using a multiple-regression model. This analysis included age, sex, amount of TB bacilli in sputa (AFB grade), CRP, and Alb. The amount of TB bacilli and CRP levels were assumed as parameters of inflammation or disease activity. These parameters were significantly different between poor and good responders (Table 1). Alb titer differed between good and poor responders, with poor responders showing a median Alb titer lower than that of good responders. Alb titer was included as an independent variable and was assumed to be nutritional parameter. The analysis showed that AFB grade of sputa and Alb titer significantly affected Td (Table 2)
Table 2: Predictors of poor responses to anti-tuberculosis treatment.
|
|
Regression Estimate |
Standard error |
t value |
p value |
|
Intercept |
24.57 |
9.19 |
2.67 |
<0.01 |
|
AFB count |
2.62 |
0.39 |
6.71 |
<.0001 |
|
Alb |
-5 |
2.29 |
-2.18 |
<0.05 |
R2?0.3774; ANOVA p<0.001
Abbreviations: Alb: Serum Albumin Titer; AFB: Acid-Fast Bacilli
Td was assessed by using the following formula: Td = 26.375 + (AFB grade) × 2.62 – Alb titer × 5.587). The result of analysis of variance (ANOVA) was significant (p < 0.001), and predicted values showed good correlation with annual measurements (R2 = 0.38) (Figure 2)
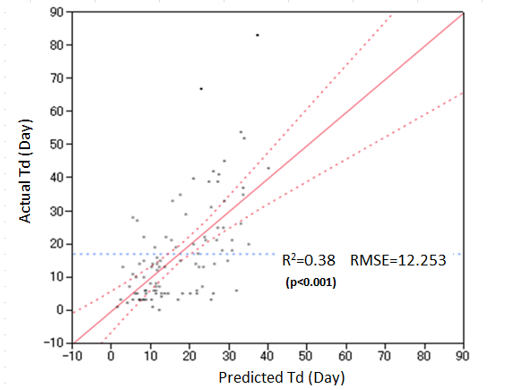
Figure 2: Correlation between Actual Time to Disappearance (actual Td) and predicted time to disappearance (predicted Td).
The present investigation demonstrated that responsiveness to anti-TB therapy, as defined by Td, is related to the amount of TB bacilli in the sputum at the time of admission. Moreover, the Alb titer at the time of admission accurately predicted Td. These observations strongly suggest that nutritional state is a crucial determinant of responsiveness to anti-TB therapy.
TB is a chronic, debilitating disease. Malnutrition increases risks of infection and delays remission in patients with TB [9]. Nutritional disorders impair cellular immunity, which plays an important role in defense against infection and clinical manifestation of TB [5,10]. A few investigations reported that malnutrition associated with weight loss may induce TB infection [7,11,12]. Pednekar et al. reported that emaciation is associated with poor treatment outcomes or death of patients with TB, with extremely thin cohort members (body mass index < 16.0 kg/m2 ) being at highest risk and males being at higher relative risk than are females [6]. Nutritional interventions for TB may therefore be crucial for achieving successful therapeutic treatments. Establishing objective and reliable criteria for patients requiring nutritional support is essential for ensuring that nutritional interventions are effective. In the present investigation, Td was less than 30 days for >80% of patients, whereas the remaining patients continued to expel sputa positive for TB bacilli over long periods. These facts suggest that responses to anti-TB therapy vary among individual cases, with some patients demonstrating poor and/or delayed responses to anti-TB therapy, as indicated by Td. Among the various factors that affected Td, the amount of TB bacilli in sputa at hospitalization had the most significant impact. Alb titer at the time of admission also influenced Td, suggesting that assessment of nutritional state is critical for TB therapy. Univariate analysis showed that median and maximum Alb titers of poor responders were lower than those of good responders, although differences between responders were not significant (Table 1). However, multiple linear regression analysis showed that Alb titer was a critical nutritional parameter that predicts the intractability of TB. Our results may be useful in creating individual treatment plans and may provide useful information for developing rational plans for public health for preventing the spread of TB infection. Moreover, predicting Td provides indispensable information that contributes to improvement of QOL by shortening of isolation period of TB patients. Hence, the formula for predicting Td presented in this study may assist in developing efficient nutritional interventions for TB patients suffering from hyponutrition.
Table 1: Background characteristics of good and poor responders.
| Group (Male/Female) | Good Responders (58/18) | Poor Responders (14/2) | p value |
| Age (y.o.) | 58 (19-79) | 55 (23-73) | N.S. |
| Body Weight (kg) | 56.9 (32.0-91.5) | 56.5 (45.9-74.1) | N.S. |
| WBC (x103 per mm3 ) | 7.2 (9.3-16.4) | 7.5 (5.3-15.2) | N.S. |
| RBC (x104 per mm3 ) | 443 (310-579) | 440 (306-560) | N.S. |
| Alb (g/dL) | 3.9 (2.3-5.0) | 3.8 (2.3-4.6) | N.S. |
| CRP ( mg/dL) | 1.8 (0.0-20.4) | 5.4 (0.4-10.1) | p<0.05 |
| AFB grade | 1 (0-3) | 3(1-3) | p<0.01 |
Abbreviations: Good responders: patients whose Td is less than 30 days; Poor responders: patients whose Td is equal or more than 30 days; Alb: Serum Albumin Titer; CRP: C-Reactive Protein; AFB: Acid-Fast Bacilli; NS: Not Significant. Data are presented as median (range).
Table 2: Predictors of poor responses to anti-tuberculosis treatment.
| Regression Estimate | Standard error | t value | p value | |
| Intercept | 24.57 | 9.19 | 2.67 | <0.01 |
| AFB count | 2.62 | 0.39 | 6.71 | <.0001 |
| Alb | -5 | 2.29 | -2.18 | <0.05 |
R2 = 0.3774; ANOVA p<0.001
Abbreviations: Alb: Serum Albumin Titer; AFB: Acid-Fast Bacilli
CONCLUSION
In conclusion, we have shown that nutrition clearly affects the outcomes of anti-TB therapy. Alb levels and AFB grade upon hospitalization may provide a useful marker for predicting therapeutic treatment effects.
ACKNOWLEDGEMENT
This study was supported by a grant-in-aid from the Osaka Tuberculosis Foundation. The authors are grateful to Ms. Reiko Hayashi for her linguistic assistance.


