Patient Satisfaction among Adult Hypertensives Attending the Medical Outpatient Clinic of a Tertiary Healthcare Facility in South-South Nigeria
- 1. Department of Family Medicine, Federal Medical Centre, Nigeria
- 2. Department of Public Health, Federal Medical Centre, Nigeria
Abstract
Background: Over time patient satisfaction has gained widespread recognition as a measure of quality health services. There is a need to ascertain the level of satisfaction of patients with chronic medical conditions such as hypertension. This is pertinent in the sense that when patients are satisfied they will follow the treatment protocols and keep on utilizing the health services, thereby improving the outcome of care and health-seeking behavior.
Methods: This study was a cross-sectional study involving patients attending the Hypertension Clinic of the Federal Medical Centre, Asaba. Data was collected via systemic sampling method using pre-tested interviewer-administered questionnaires and analyzed using SPSS software version 22.0
Results: Two hundred respondents were recruited for the study and 88.5% of the respondents were satisfied with care. Among the respondents 131 (65.5%) were females, 80 (40.0%) had secondary school education and 128 (64.0%) were married. Level of patient satisfaction was significantly associated with educational level and occupation of the respondents. Also, statistically significant associations were found between the socio-demographic characteristics of gender, marital status, and educational level and the patient satisfaction components of access to care, patient waiting time, patient-provider relationship and hospital bureaucracy.
Conclusion: Patient satisfaction was found to be significantly associated with certain socio-demographic characteristics of the study population.
Keywords
• Patient satisfaction • Blood pressure • Patient centred care • Adult hypertensives
Citation
Ofili RA, Nwajei AI, Aigbokhaode AQ, Owolabi AO, Owolabi MO, et al. (2021) Patient Satisfaction among Adult Hypertensives Attending the Medical Outpatient Clinic of a Tertiary Healthcare Facility in South-South Nigeria. J Family Med Community Health 8(1): 1184.
INTRODUCTION
As the healthcare industry shifts toward patient-centered models, healthcare providers will need to fully understand patient satisfaction measures and how they affect their practices. Patient satisfaction is a key criterion by which the quality of health care services is evaluated. It can be defined as a subjective evaluation of the service received against the individual’s expectations [1]. Risser in 1975 first defined patient satisfaction as the degree of convergence between the expectations the patients have of ideal care and their perception of the care they really get [2]. Patients’ judgment of hospital service quality and their feedback are essential in quality of care monitoring and improvement. Patient satisfaction data are routinely collected and used for continuous quality improvement by healthcare institutions and hospitals in developing countries. Patient satisfaction is measured over a wide range of health service dimensions. Some studies suggest that certain patient demographic and clinical characteristics, including age, health status and the severity of illness, are associated with satisfaction scores more than the technical quality of care provided [1]. Hypertension already affects one billion people worldwide, leading to heart attacks and strokes. Researchers have estimated that raised blood pressure currently kills almost ten million people every year worldwide [3,4]. It is believed that improved patient satisfaction will lead to an increase in adherence to doctor’s advice and prescription which in turn will improve blood pressure control and reduce morbidity and mortality.
Aim and objectives The aim of the study was to determine the level of patient satisfaction among adult hypertensives.
Specific objectives 1. To determine the level of patient satisfaction among the respondents. 2. To determine the relationship between level of patient satisfaction and the socio-demographic characteristics of the respondents.
MATERIALS AND METHODS
Study population This was a clinic-based cross-sectional study involving 200 adult patients attending the hypertensive clinic of the Federal Medical Centre, Asaba. Participants were aged 18 and above. The study sought to measure the level of patient satisfaction among adult hypertensives at the hypertension clinic of the hospital. Tools used included a questionnaire for socio-demographic characteristics and to assess level of patient satisfaction with the satisfaction components of access to care, patient waiting time, patient provider relationship, hospital bureaucracy and hospital environment. Each satisfaction item was scored in a five?point Likert scale ordinal response which was converted to points as follows: Excellent = 5 points, Very good = 4 points, Good = 3 points, Fair = 2 points and Poor = 1 point. This gave a total score of 125 points which was then converted to percentage scores with the following operational percentage range definitions: excellent (90%–100%), very good (70%–89.9%), good (50%–69.9%), fair (30%–49.9%), and poor (0%–29.9%). People who scored higher than 50% were said to be satisfied while those who scored below 50% were said to be not satisfied. Adult patients seen during the study period were selected through a process of systematic sampling which involved picking the first patient from an initial ballot and then using every fourth patient from the first that registered to see the Physician and who met the selection criteria.
Ethical considerations Ethical approval was obtained from the Ethical and Research Committee of the Federal Medical Centre, Asaba and informed written consent was obtained from each subject prior to inclusion into the study. The participants were adequately counseled before administering the questionnaire. Confidentiality and privacy was maintained in accordance with research protocols/ethics. Each participant was also given the option to opt out of the study at any point if they so wished. There was no discriminatory treatment between those who refused to give consent to participate in the study and those who gave consent. Refusal to participate did not affect the quality of healthcare provided. Inclusion Criteria: Registered hypertensive patients from the ages of 18 years and above who gave informed consent and hypertensive patients of either sex who have been diagnosed and are on treatment. Exclusion Criteria: Critically ill patients as these patients require urgent medical attention. Hospital staffs were also excluded to prevent bias.
Data analysis The data was analyzed using the statistical software programme Statistical Package for Social Sciences Version 22.0 (SPSS Inc 233 S walker drive, 11th floor, Chicago, Illinois). Qualitative data such as educational status and marital status were presented as figures and percentages while continuous variables that were normal in distribution (such as age) were expressed as means ± standard deviation. Discrete data suchas level of patients’ satisfaction among the respondents were expressed as frequency and percentages.
RESULTS
*Statistically significant, p-value is <0.05, Chi square = χ2 Gender, Educational Status and Marital Status have statistically significant relationships with patient’s satisfaction components.
DISCUSSION
The objective of this study was to determine the level of patient satisfaction among the respondents and also determine the relationship between level of patient satisfaction and the socio-demographic characteristics of the respondents. It was carried out among hypertensive patients in a tertiary healthcare facility. The highest number of respondents was in the 40-49 years age group and there were no respondents in the 18-29 years age group recorded in this study (Table 1).
| Characteristic | Frequency (n=200) | Percentage (%) |
| Age (in years) | ||
| 30-39 | 12 | 6.0 |
| 40-49 | 56 | 28.0 |
| 50-59 | 26 | 13.0 |
| 60-69 | 51 | 25.5 |
| ≥70 | 55 | 27.5 |
| Gender | ||
| Male | 69 | 34.5 |
| Female | 131 | 65.5 |
| Occupation | ||
| Self employed | 83 | 41.5 |
| Retiree | 60 | 30.0 |
| Civil/Public Servants | 41 | 20.5 |
| Unemployed/Student | 16 | 8.0 |
| Educational Status | ||
| No Formal Education | 18 | 9.0 |
| Primary | 51 | 25.5 |
| Secondary | 80 | 40.0 |
| Tertiary | 51 | 25.5 |
| Marital Status | ||
| Married | 128 | 64.0 |
| Not currently married | 72 | 36.0 |
| Religion | ||
| Christianity | 195 | 97.5 |
| Others | 5 | 2.5 |
| Ethnicity | ||
| Igbo | 148 | 74.0 |
| Others | 19 | 9.5 |
| Urhobo | 14 | 7.0 |
| Yoruba | 9 | 4.5 |
| Edo | 8 | 4.0 |
| Hausa | 2 | 1.0 |
This is in keeping with theage statistics in the studies done by Iloh et al., on hypertensives who had no patients in the 18-29 age range [5,6]. This was different however from the findings reported by Ekwunife, Udeogaranya and Nwatu [7] who recorded most patients at 20- 29 years age range with 40-49 years age group being their second most populous. This may be because their study was conducted in a teaching hospital in Nsukka which contains a higher proportion of students from the University of Nigeria Nsukka. Contrary to the gender distribution of hypertension that sees males as being more likely to develop hypertension than females [8-10], in this study the majority of the study population were females. This may be attributable to the poor health-seeking behaviour of men [11-13]. However, studies carried out by Iloh et al., Ramli et al., Wu et al and Kim et al., showed similar higher female preponderances [5,6,14-16]. Majority of the patients were married and a high proportion had secondary education. A high proportion of the respondents also were self-employed which is a reflection of the thriving business environment that the city of Asaba has evolved into over the years. These findings were similar to the findings in the studies done among hypertensives in the Eastern part of Nigeria [5,6]. This study showed that majority of the respondents were satisfied with the level of care received while 11.5% were not satisfied (Figure 1).
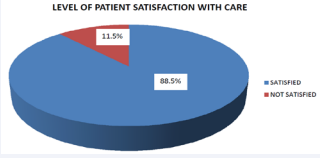
Figure 1 Shows a Pie chart indicating the level of satisfaction with care. Of the 200 respondents 177(88.5%) were satisfied with care while 23(11.5%) were not satisfied.
This is consistent with the favourable satisfaction responses found in other studies on patient satisfaction with care in various hospitals [17-20]. Although markedly higher than the overall satisfaction score of 62% reported in Umuahia, South-Eastern Nigeria [21], 59.3% recorded in Calabar [22] and 38.5% in a semi-urban community in SouthWestern Nigeria [23]. The reason may not be unconnected to response bias as most of the respondents that agreed to participate in the study may most likely be those that are satisfied with the care they received from the centre. Patient socio-demographic characteristics also have some influence on patient satisfaction. Overall, respondents who were of lower educational status were more satisfied than those who were of higher educational standing (Table 2).
| Characteristic | Satisfaction Category | χ2 | p-value | |
| Not Satisfied p-value N=23 (n%) | Satisfied N=177 (n%) | |||
| Age group (in years) | ||||
| 30-39 | 0 (0.0) | 12 (100.0) | ||
| 40-49 | 10 (17.9) | 46 (82.1) | 4.90 | 0.29 |
| 50-59 | 2 (7.7) | 24 (92.3) | ||
| 60-69 | 4 (7.8) | 47 (92.2) | ||
| ≥70 | 7 (12.7) | 48 (87.3) | ||
| Gender | ||||
| Male | 12 (17.4) | 57 (82.6) | 3.59 | 0.06 |
| Female | 11 (8.4) | 120 (91.6) | ||
| Occupation | ||||
| Self employed | 11 (13.3) | 72 (86.7) | ||
| Civil/Public servants | 0 (0.0) | 41 (100.0) | 8.76 | 0.03* |
| Retirees | 11 (18.3) | 49 (81.7) | ||
| Unemployed/Student | 1 (6.3) | 15 (93.8) | ||
| Educational Status | ||||
| No Formal Education | 0 (0.0) | 18 (100.0) | ||
| Primary | 2 (3.9) | 49 (96.1) | 7.86 | <0.01* |
| Secondary | 13 (16.3) | 67 (83.6) | ||
| Tertiary | 8 (15.7) | 43 (84.3) | ||
| Marital Status | ||||
| Not currently married | 4 (5.6) | 68 (94.4) | 3.91 | 0.06 |
| Married | 19 (14.8) | 109 (85.2) | ||
| *Statistically significant, p-value is <0.05, Chi square = χ2 | ||||
A closer look at the various components of patient satisfaction under scrutiny in this study showed that there was a consistent finding of higher satisfaction among the less educated patients, that is, those withprimary education or no formal education, than among those who were more educated. This may be because those with lower levels of education are not as knowledgeable and so may not have as high an expectation of service as those who are better educated while those with higher education might be more vocal, information-seeking and know what to expect and be more disappointed when they do not get it. A study done by NabbuyeSekandi et al. [1], on patient satisfaction with services at the Outpatient Clinics of a national referral and teaching hospital in Uganda showed a similar outcome when it was found that patients with post-secondary/higher education tended to score lower in satisfaction with services than those with no education. Rahmqvist and colleagues [24] in a study on patient characteristics and quality dimensions related to patient satisfaction carried out at Ostergotland County in Sweden also discovered a positive statistical significance between lower educational levels and satisfaction. Other studies also made similar discovery [25-28]. Abodunrin, Adeomi and Adeoye [23] also noticed an association between level of education and patient satisfaction in a study on client satisfaction among mothers attending infant welfare clinics in South-Western Nigeria, but in that case the more educated the patients were, the more satisfied they were with services rendered while most of the less-educated patients were dissatisfied. The relationship between occupational status and patient satisfaction level was also found to be statistically significant as those who were employed by the government were more likely to be satisfied with services followed closely by those who were unemployed while the self-employed and retirees were less likely to be satisfied. This most likely is linked to time ownership as the civil/public servants would have had to take excuse off work and would be happy to finally have time to take care of their medical ailments while the unemployed would be under no constraint to report to anyone about the time they spent at the hospital. Also, it is possible that the civil/public servants are more familiar with the processes and bureaucracies of public services being used at the hospital and thus have a higher level of tolerance and patience. For the self-employed however, their time is their money as the time spent in the hospital markedly reduces the time they would have spent attending to their businesses and making profit. The retirees might have someone waiting for them at home and might have other engagements and social events and so would be less satisfied with the time spent at the hospital. Other studies were also able to demonstrate a statistical significance between occupation and patient satisfaction. Abodunrin, Adeomi and Adeoye [23]in their study done on client satisfaction among mothers attending Infant Welfare Clinics in South-Western Nigeria noted that occupational status was significantly associated with patient satisfaction. Another study done on Assessment of Clients’ Satisfaction with Health Service Deliveries at Jimma University Specialized Hospital, Southwest of Addis Ababa in Ethiopia by Assefa, Mosse and Hailemichael [29] revealed a significant association of occupational status with client satisfaction. However a study done by Al-Sakkak and colleagues [30] on Patient Satisfaction with primary health care in Riyadh failed to find any statistical significance with patient satisfaction and occupational status. This is possibly because the study was done in three military establishments among militarypersonnel where almost all the respondents would have been engaged in the same occupation. Studies done have shown that increasing age has a positive relationship with patient satisfaction [24,31,32] however in this study the youngest age group had the highest number of respondents who were satisfied. Since the numbers of respondents within this group was very small (12 patients) it is possible that the younger age bracket was not ably represented in this study. It is also interesting to note that a systematic review done by Bjertnaes and colleagues [33] in 2011 titled “Overall patient satisfaction with hospitals: Effects of patient-reported experiences and fulfilment of expectations” which included 63 hospitals in five health regions in Norway showed no significant relationship between age and patient satisfaction. This study also showed no statistically significant relationship between age and patient satisfaction. There was significant association between sociodemographic characteristics (gender, education status and marital status) and patient satisfaction domains of access to care, hospital bureaucracy, patient waiting time and patient provider relationship (Table 3).
| Socio-demographic Characteristics | Patient Satisfaction Components | |||||
| Access to Care | Patient Waiting Time | Patient Provider Relationship | Patient Provider Communication | Hospital Environment | Hospital Bureaucracy | |
| Age group (in years) | ||||||
| 30-39 | ||||||
| 40-49 | ||||||
| 50-59 | 0.83 | 0.59 | 0.10 | 0.09 | 0.92 | 0.93 |
| 60-69 | ||||||
| ≥70 | ||||||
| Gender | ||||||
| Male | 0.03* | 0.26 | 0.11 | 0.77 | 0.09 | 0.40 |
| Female | ||||||
| Occupation | ||||||
| Self employed | ||||||
| Civil/Public servants | 0.07 | 0.44 | 0.73 | 0.13 | 0.08 | 0.57 |
| Retirees | ||||||
| Unemployed/Student | ||||||
| Educational Status | ||||||
| No Formal Education | ||||||
| Primary | 0.04* | 0.05 | 0.07 | 0.33 | 0.95 | <0.001* |
| Secondary | ||||||
| Tertiary | ||||||
| Marital Status | ||||||
| Not currently married | ||||||
| Married | 0.11 | <0.01* | 0.04* | 0.32 | 1.00 | 0.04* |
| *Statistically significant, p-value is <0.05, Chi square = χ2 Gender, Educational Status and Marital Status have statistically significant relationships with patient’s satisfaction components | ||||||
There was no statistical significance between some of the patient satisfaction domains (patient provider communication, hospital environment) and the sociodemographic characteristics of the patients. This is not an uncommon finding as other studies done on patient satisfaction have also shown no significant relationship between any of the socio-demographic characteristics and the domains of patient satisfaction [22,34].
CONCLUSION
Paramount for healthcare providers is an understanding of what makes a patient tick. Being able to determine what does and does not affect patient satisfaction is an integral part of making satisfaction a priority in healthcare delivery. In this study, the level of patient satisfaction was significantly associated with educational level and occupation of the respondents. Also, statistically significant associations was found between gender, marital status, and education level and the patient satisfaction components of access to care, patient waiting time, patientprovider relationship and hospital bureaucracy. In the wake of patient-centred healthcare reforms, it is pertinent that healthcare providers understand the subtle differences in what gives patients satisfaction. This will help in providing effective strategies that will boost patients’ satisfaction. This will have a positive effect on several aspects of healthcare delivery.
LIMITATIONS OF THE STUDY
This was a cross sectional study and thus causality cannot be determined. Also the responses of the respondents may not be a true representative of the actual situation. There may also have been recall bias as respondents filled the questionnaire.
REFERENCES
15.Wu PH, Yang CY, Yao ZL, Lin WZ, Wu LW, Chang CC. Relationship of blood pressure control and hospitalization risk to medication adherence among patients with hypertension in Taiwan. American journal of hypertension. 2010; 23: 155-160.
16.Kim S, Jang S. Relationship between antihypertension medication adherence, medical utilizations, and medical expenditure among patients with hypertension. YakhakHoeji. 2013; 57.
24.Rahmqvist M, Bara AC. Patient characteristics and quality dimensions related to patient satisfaction. International Journal for Quality in Health Care. 2010; 22.


