The Role of the Triglyceride Glucose Index in the Risk of Progression to Diabetes: A Case Control Study
- 1. Department of Family Medicine, Besni State Hospital, Adiyaman, Turkey
- 2. Department of Family Medicine, Izmir Bozyaka Training and Research Hospital, Bozyaka, Izmir, Turkey
Abstract
Aim: To evaluate the diagnostic performance of the Triglyceride Glucose (TyG) index in predicting prediabetes and to assess its utility as a practical screening tool in primary healthcare settings.
Material and Methods: This retrospective case control study included 350 adults with prediabetes and 350 age and sex matched normoglycemic controls from a Family Medicine Unit in ?zmir, Türkiye. Data on sociodemographic characteristics, lifestyle factors, anthropometric measurements, and laboratory values were obtained from electronic medical records. ROC curve analysis and three step logistic regression models were used to determine the predictive value of the TyG index and its association with prediabetes risk.
Results: The TyG index was significantly higher in the prediabetes group than in controls (p < 0.001). Logistic regression showed that each one-unit increase in the TyG index was associated with a 2.26 fold increase in prediabetes risk. Individuals in the highest TyG quartile had a 3.71–4.20 fold increased risk compared to the lowest quartile across models. The TyG index also showed strong correlations with HbA1c, fasting glucose, lipid parameters, and waist circumference. ROC analysis yielded an AUC of 0.680 for the TyG index alone, which increased to 0.834 when combined with fasting glucose and lifestyle variables.
Conclusion: The TyG index is a low cost, accessible, and effective screening marker for prediabetes in primary care. Its integration into clinical decision-making processes may support early identification and risk stratification of individuals prone to developing type 2 diabetes.
Keywords: Triglyceride Glucose Index; Prediabetes; Primary Care; ROC Analysis; Risk Prediction
Introduction
According to the World Health Organization (WHO) 2021 report, approximately 537 million adults aged 20–79 years are living with diabetes worldwide. It is estimated that the global prevalence will rise to 643 million by 2030 and reach 784 million by 2045 [1]. In recent years, diabetes-related health expenditures have steadily increased globally, with a disproportionately greater burden observed in low- and middle-income countries [1].
Prediabetes, characterized by asymptomatic and moderate hyperglycemia, is frequently more prevalent than diabetes. Compared with individuals with normal glucose metabolism, those with prediabetes are at significantly higher risk of developing type 2 diabetes mellitus and related complications, including microangiopathy and cardiovascular diseases [2,3]. Effective preventive strategies and therapeutic interventions aimed at halting the progression from prediabetes to diabetes are critical in reducing diabetes-related morbidity and mortality.
Insulin Resistance (IR) is one of the key metabolic disturbances in the pathogenesis of type 2 diabetes mellitus [4]. While the Hyperinsulinemic-Euglycemic Clamp (HIEC) remains the gold standard for assessing IR, its high cost and time-consuming nature limit its routine use. Therefore, simpler and more affordable surrogate markers such as HOMA-IR, Triglyceride to HDL cholesterol ratio (TG/HDL), McAuley index, and the Triglyceride Glucose (TyG) index have been extensively studied [5,6]. The TyG index is a low-cost marker calculated using fasting plasma glucose and triglyceride levels, with the formula: ln [fasting triglycerides (mg/dL) × fasting glucose (mg/dL) / 2] [7,8].
Numerous studies have investigated the relationship between the TyG index and both prediabetes and metabolic syndrome components, reporting varying degrees of predictive accuracy across different populations. However, studies evaluating the diagnostic value of the TyG index in identifying prediabetes at the primary care level in Türkiye remain limited.
The aim of this study is to evaluate the diagnostic performance of the TyG index in predicting prediabetes and to assess its feasibility as a screening tool in primary healthcare settings.
Materials and Methods
Study Design and Data Collection:
This retrospective case control study was conducted among individuals aged 18 years and older registered at the 13th Family Medicine Unit in Karaba?lar, ?zmir. Assuming a prediabetes prevalence of 35%, a minimum of 350 individuals with a diagnosis of prediabetes were included using a sample size formula for an unknown population. A control group of 350 normoglycemic individuals, matched for age and sex, was also selected. Pregnant women, individuals under 18 years of age, and records with missing data were excluded. Sociodemographic characteristics, lifestyle factors, anthropometric measurements, and laboratory findings were retrospectively retrieved from the Family Medicine Information System. Laboratory parameters included fasting glucose, hemoglobin, HbA1c, TSH, total cholesterol, HDL, LDL, and triglyceride levels.
Ethical Approval:
The study was approved by the Clinical Research Ethics Committee of ?zmir Bozyaka Training and Research Hospital on February 6, 2025 (Approval No: 2025/09) and was conducted with permission from the ?zmir Provincial Health Directorate.
Statistical Analysis:
Statistical analyses were performed using IBM SPSS Statistics for Windows, version 27.0 (IBM Corp., Armonk, NY, USA). Categorical variables were expressed as counts and percentages, while continuous variables were reported as mean ± Standard Deviation (SD) or median (Q1–Q4), depending on data distribution. The normality of distribution was assessed using the Shapiro Wilk test and visual methods. Independent samples t-test was used for normally distributed variables, and the Mann Whitney U test for non-normally distributed variables. Homogeneity of variances was assessed with Levene’s test. Comparisons across more than two groups were conducted using one-way ANOVA or Kruskal Wallis tests, with appropriate post hoc analyses applied where significant differences were found. Categorical variables were analyzed using Pearson’s chi-square test or the Fisher Freeman Halton test when necessary.
Receiver Operating Characteristic (ROC) analysis was used to evaluate test performance, including Area Under The Curve (AUC), sensitivity, specificity, and optimal cutoff points, determined using the Youden index and Kolmogorov Smirnov statistic. A three-step logistic regression model was constructed to assess predictors of prediabetes. Model 1 included fasting glucose and TyG index; Model 2 added age and sex; and Model 3 further incorporated lifestyle and clinical variables. For all models, Odds Ratios (OR), 95%Confidence ?ntervals (CI), and p-values were reported. Model fit was assessed using the Hosmer–Lemeshow test, Cox & Snell R², and Nagelkerke R² values. Multicollinearity was evaluated using Variance ?nflation Factor (VIF) and tolerance values. A two tailed p-value < 0.05 was considered statistically significant.
Table 1
Table 1. Comparison Of Clinical And Laboratory Variables Between The Control Group And ?ndividuals With Prediabetes.
t: Independent samples t-test statistic; U: Mann–Whitney U test statistic; p: Significance level (two-tailed); d: Cohen’s d; r: Rank biserial correlation
Table 2
Table 2. Characteristics Of Participants Across Tyg ?ndex Quartiles (One-way ANOVA analysis)
Table 3
Table 3: Results of the ROC curve analysis.
Table 4
Table 4: Relationship between TyG index and prediabetes in Model 1 (adjusted for fasting glucose only).
Table 5
Table 5. Association Between TyG Index and Prediabetes Across Predictive Models
Results
The TyG index, age, fasting plasma glucose, HbA1c, total cholesterol, LDL-C, triglycerides, body weight, height, and waist circumference values were significantly higher in the prediabetes group compared to the control group. In contrast, HDL-C levels were significantly lower (p < 0.05). The TyG index also showed a statistically significant difference between the groups (p < 0.001) (Table 1). Analysis of participants’ lifestyle factors revealed that smoking was significantly associated with prediabetes (OR = 1.75), while no significant associations were observed for alcohol consumption, physical activity, or psychiatric comorbidities. Chronic medication use was significantly related to prediabetes status.
According to quartile-based analysis of the TyG index, variables such as age, waist circumference, fasting glucose, HbA1c, total cholesterol, LDL-C, triglycerides, and hemoglobin increased progressively across TyG quartiles, whereas HDL-C levels decreased significantly (p < 0.001). No significant differences were observed in TSH and BMI levels among quartile groups (Table 2).
Prediction of Prediabetes Using Logistic Regression Models
Three-stage logistic regression models were constructed to predict prediabetes, and their predictive performance was evaluated using receiver operating characteristic (ROC) curve analysis.
Model 1, which included only fasting glucose and the TyG index, demonstrated that each 1 mg/dL increase in fasting glucose was associated with a 13.5% increase in the risk of prediabetes (OR = 1.135; p < 0.001), while each one-unit increase in the TyG index increased the risk by 2.26 times (OR = 2.257; p < 0.001).
Model 2, expanded to include age and sex, revealed that female sex was associated with a significantly increased risk (OR ≈ 1.5; p = 0.039), while age approached statistical significance (p = 0.057).
Model 3, which incorporated lifestyle and anthropometric variables, indicated that smoking significantly increased the risk by 1.8 times (p < 0.01). However, age, BMI, waist circumference, and alcohol consumption did not show significant associations (p > 0.05).
In ROC analysis, Model 1 yielded an AUC value of 0.819, indicating strong discriminatory performance. While the TyG index alone had an AUC of 0.680, its predictive power substantially improved when combined with fasting glucose. AUC values increased slightly with the addition of further variables: Model 2 reached an AUC of 0.824, and Model 3 achieved an AUC of 0.834 (Table 3).
These findings suggest that biochemical parameters particularly fasting glucose and HbA1c are the primary determinants for identifying prediabetes. Incorporating lifestyle factors may enhance diagnostic sensitivity and enable a more individualized risk assessment (Table 3, Figure 1). Although the TyG index alone appears to be a limited predictor, its integration with fasting glucose significantly strengthens the model’s discriminatory ability, offering a practical tool for screening in primary care settings. Furthermore, Model 3, which includes modifiable risk factors, may provide a more comprehensive approach for risk stratification and targeted interventions.
Relationship Between TyG Index Quartiles and Prediabetes: A Comparative Analysis of Three Models
In three logistic regression analyses conducted across TyG index based quartile groups, increasing TyG levels were found to be significantly associated with a higher risk of prediabetes. Compared to the reference group (Q1), individuals in Q4 had a 4.17-fold increased risk of prediabetes in Model 1, which was adjusted only for fasting blood glucose (FBG) (OR = 4.17; 95% CI: 2.45–7.12; p < 0.001). This risk further increased to 4.20 in Model 2, which included age and sex, and was slightly lower in Model 3 at 3.71, after additionally adjusting for lifestyle and clinical variables such as smoking, alcohol use, chronic medication use, BMI, and waist circumference (p < 0.001 for all). While the Q2 group showed a statistically significant increase in risk across all three models, the Q3 group did not reach statistical significance. Nevertheless, the “p for trend” was < 0.001 in all models, indicating a significant dose-response relationship between increasing TyG index levels and the risk of prediabetes (Table 4).
The observation of similar risk estimates across all three models suggests that the TyG index remains a strong predictor of prediabetes despite varying levels of adjustment. In Model 3, a slight decrease in odds ratios was observed following the inclusion of lifestyle related variables. This finding indicates that the independent effect of the TyG index was maintained even when evaluated alongside other confounding factors (Table 5).
Figure 1
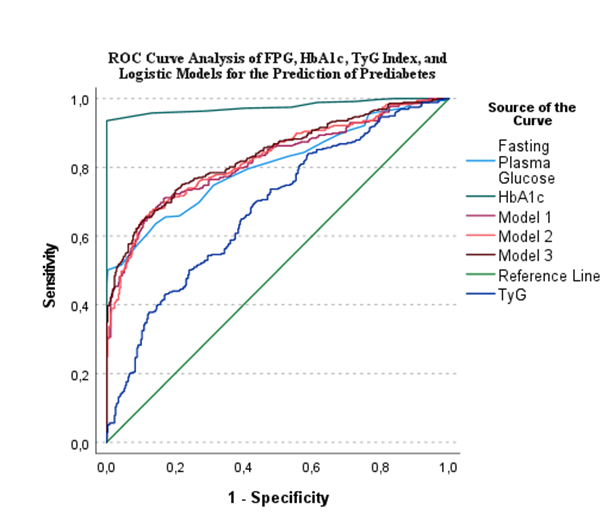
Figure 1: Receiver operating characteristic (roc) curves comparing the diagnostic performance of fasting blood glucose, hba1c, the tyg index, and logistic regression models (model 1–3) in predicting prediabetes.
Discussion
This study is one of the few Turkey based investigations conducted at the primary healthcare level that evaluates the diagnostic value of the TyG index in predicting prediabetes. The findings demonstrated a significant and positive association between the TyG index and the risk of prediabetes. In particular, individuals in the highest 25% group (4th quartile) based on TyG levels exhibited a markedly increased risk. According to logistic regression analysis, each one-unit increase in the TyG index elevated the risk of developing prediabetes by 2.26 times; this risk reached up to 3.71 times in the highest quartile group. These results are consistent with previous literature and support the potential of the TyG index as a strong and independent biomarker for the early identification of prediabetes [9,10].
In a study conducted in the United States, the TyG index and its derivatives (TyG-waist circumference and TyG-BMI) were found to be strongly associated with cardiovascular diseases and mortality [9]. Similarly, prospective cohort studies conducted in China have emphasized that the TyG index is significantly correlated with components of the metabolic syndrome and serves as a valuable marker in predicting prediabetes [11]. In our study, fasting blood glucose, HbA1c, triglycerides, total cholesterol, and LDL levels were observed to increase significantly across TyG quartiles, while HDL levels decreased. These findings suggest that the TyG index may reflect cardiometabolic risk in a more comprehensive manner. Our results are consistent with previous literature and indicate that the TyG index is associated not only with glycemic abnormalities but also with a range of metabolic parameters.
Our study also suggests that the TyG index is not merely a biochemical parameter, but when considered alongside lifestyle-related variables, it can predict prediabetes risk with greater accuracy. A cohort study conducted in China reported that each standard deviation increase in the TyG index was associated with a 22% higher risk of developing diabetes, with this effect being particularly pronounced in women and individuals over the age of 65 [12,13]. These findings highlight the importance of incorporating the TyG index into individualized risk assessments, taking demographic characteristics into account. In our dataset, smoking was significantly associated with prediabetes risk, indicating that the TyG index may be influenced by lifestyle factors. Previous studies have also demonstrated that smoking increases insulin resistance and facilitates the development of type 2 diabetes [13]. On the other hand, variables such as alcohol consumption and body mass index did not show a significant contribution in multivariate analyses, suggesting that the TyG index may serve as a relatively independent marker from these factors.
In the evaluation based on TyG index quartiles, individuals with higher TyG levels also exhibited significantly increased waist circumference measurements, an indicator of abdominal obesity. This finding is consistent with previous literature demonstrating a direct association between TyG and abdominal obesity [12,11]. Furthermore, the concurrent increase in HbA1c and fasting glucose levels alongside TyG supports its direct association with glycemic control parameters and its potential as a surrogate marker for insulin resistance [9].
Another noteworthy finding is the parallel increase in hemoglobin levels across TyG quartiles. This may suggest a potential pathophysiological link between insulin resistance and erythropoietic activity. In the study by Zhang and Zeng, HbA1c was reported to play a partial mediating role in the relationship between TyG and cardiovascular diseases [9]. Although insulin levels were not directly measured in our study, the simultaneous elevation of HbA1c and hemoglobin levels in conjunction with TyG supports this hypothesis. In this context, further mechanistic studies are clearly warranted.
In the ROC analysis, the discriminative power of the TyG index in predicting prediabetes was found to be moderate (AUC = 0.68). However, in a five-year follow-up study conducted by Chen et al. among individuals with prediabetes, the TyG index yielded a higher AUC value of 0.72 [10]. The discrepancy in AUC values may be explained by differences in the study populations, as the former was based on a secondary care clinical setting, whereas our study was conducted at the primary care level. Although insulin levels were not directly measured in our study, the significant associations between the TyG index and HbA1c, fasting glucose, and hemoglobin levels are consistent with known surrogate biomarkers of insulin resistance. These findings are in line with previous reports describing a potential pathophysiological link between insulin resistance and erythropoietic activity [12-14]. Therefore, the TyG index may be considered not only a marker of glycemic status but also a potential indicator of underlying metabolic and hematologic processes.
The TyG index represents a valuable screening tool in clinical practice due to its ease of applicability, cost effectiveness, and practical interpretability at the primary care level. Nevertheless, its utility should be further supported by prospective and longitudinal studies incorporating direct measurements of parameters such as insulin and HbA1c.
Conclusion
Delayed diagnosis of prediabetes contributes to the increasing prevalence of type 2 diabetes and the widespread occurrence of related complications, posing a significant public health concern. The findings of this study demonstrate a strong positive association between the TyG index and prediabetes, indicating that higher TyG levels are accompanied by a significantly increased risk of developing prediabetes. These results suggest that the TyG index is not only a biochemical parameter but also a feasible, accessible, and cost-effective screening tool for use in primary healthcare settings.
Particularly in primary care environments where oral glucose tolerance tests are not routinely performed, a risk stratification approach based on the TyG index may serve as a strategic tool for the early diagnosis and prevention of diabetes. In this respect, our study is among the few investigations that highlight the clinical potential of the TyG index in predicting prediabetes at the primary care level. The findings provide important insights that may contribute to strengthening public health policies aimed at the early detection and prevention of prediabetes. Further large-scale, multicenter, and prospective studies are warranted to explore the integration of the TyG index into clinical decision support systems.
Acknowledgment/Disclaimers/Conflict Of ?nterest
The concept, study design, data collection, and manuscript preparation were carried out by Dr. Merve Nur Alagöz. Statistical analyses were performed by Dr. ?brahim Ery?lmaz, and the final revision and critical supervision of the manuscript were conducted by Dr. Özge Tuncer.
The authors declare that they have no conflicts of interest regarding this study. No financial support was received for this research.
Informed Consent
This study was approved by the ?zmir Bozyaka Training and Research Hospital Clinical Research Ethics Committee (Approval No: 2025/09; Date: February 6, 2025) and conducted with the permission of the ?zmir Provincial Health Directorate. As this was a retrospective study using anonymized data from electronic health records, obtaining written informed consent from participants was not required, in accordance with institutional and national ethical guidelines.


