A Cereal Product High in Slowly Digestible Starch Increases Subsequent Feelings of Satiety and Decreases Glucose and Insulin Responses
- 1. Mondelez Int R&D, Nutrition Research, France
- 2. Université Paris 7, Faculté Xavier Bichat, France
- 3. Laboratoire des Réponses Cellulaires et Fonctionnelles à l’Hypoxie, Université Paris 13, France
Abstract
Objectives: To compare the effects of two cereal products differing by their slowly digestible starch (SDS) content and by their glycaemic index (GI) on plasma glucose and insulin (Experiment I) and on subjective satiety scores (Experiment II) when eaten as part of a realistic breakfast.
Design: A randomised double-blind within-subject design with subjects eating the breakfast with a high SDS (HSDS) or low SDS (LSDS) cereal product in counter-balanced order.
Subjects: Twelve healthy young adults (6 males, 6 females) participated in both Experiments I and II and 12 adults (6 males, 6 females) were added to participate in Experiment II.
Methods: In Experiment I, blood samples were drawn prior to and at various rates over a postprandial interval of 240 min for plasma glucose and insulin assays. In Experiment II, hunger and gastric fullness scales were rated prior to and every 30 min over the same postprandial interval as in Experiment I.
Results: In Experiment I, plasma glucose and insulin incremental areas under the curves (iAUC) over 120 min were lower in the HSDS than in the LSDS condition (P = 0.03 and P = 0.004 respectively). Total AUC over the 240 min (tAUC) for plasma insulin but not glucose was lower in the HSDS than in the LSDS condition (P = 0.01). At 240 min, plasma glucose concentrations were higher in the HSDS than in the LSDS condition (P = 0.04). In Experiment II, hunger ratings were lower and gastric fullness ratings higher in the HSDS than in the LSDS but this difference occurred mainly between 90 and 160 min.
Conclusions: A cereal product with a high SDS content reduces the postprandial glucose and insulin responses and increases the satiety of a breakfast.
Keywords
• Slowly digestible starch
• Glycaemic index
• Satiety
• Insulin
• Cereal products
• glucose response
Citation
Vinoy S, Aubert R, Chapelot D (2020) A Cereal Product High in Slowly Digestible Starch Increases Subsequent Feelings of Satiety and Decreases Glucose and Insulin Responses. J Hum Nutr Food Sci 8(1): 1132.
INTRODUCTION
The glycaemic index (GI) concept [1] has led to a better understanding of the biological and behavioural effects of carbohydrate (CHO) containing foods. Accumulating evidence suggests that the consumption of low GI foods as opposed to high GI foods can affect a number of health outcomes. Thus, in normal weight sedentary women, a high-GI diet was reported to be associated with an increase in body weight and body fat over the 6 years of follow-up [2]. In several meta-analyses identified, a low GI diet had a beneficial effect in the prevention of type 2 diabetes and cardiovascular diseases [3-6], and additional works suggested that a high-GI diet is associated with oxidative stress [7,8]. GI is also considered to improve the control of eating behaviour and energy balance. Several studies have suggested that the adoption of low GI diets could contribute to the prevention of obesity and its associated risk factors [9-13] although in a recent review did not confirm this health interest due to potential confounding factors [14].
As breakfast is usually high in CHO, this meal is particularly appropriate for studying the impact of GI on satiety. Breakfast consumption in children [15] and in adults [16] was associated with lower hunger feelings over the morning, resulting in less spontaneous snacking and a reduced energy intake at lunch [17,18]. However, the effect of breakfast on satiety may vary according to the type of CHO-rich food that is usually consumed at breakfast. Therefore, breakfasts based on low-GI cereal products should be more satiating than those with a high GI since the uptake of glucose would be spread over the whole morning period. However, a recent study did not confirm the interest of low GI breakfast on food choices and satiety [19].
A major concern relates to whether the GI of each individual food item can predict the GI of the total meal. A predictive model based on the various GIs of high-CHO foods appears to be satisfactory when the meal is moderate in fat [20] but they are more strongly associated with the GI of the meal than the carbohydrate GI per se when the fat and protein contents of the meal are high [21].
It is known that GI may depend mainly on digestive factors including the rate of gastric emptying, [22-24] digestion and uptake of glucose, leading to a modulation of the insulin response [1,23]. This difference is influenced by botanical origin and/or food processing [25-28]. Thus, using cereal-based products, we have previously demonstrated that a slowly digestible starch (SDS) high content, due to a low level of starch gelatinisation, actually resulted in a low GI of this food [29,30].
The aim of this study was to assess whether a high-SDS (HSDS) low GI food included in a traditional breakfast could modify the biological and behavioural postprandial profiles. In a first part (Experiment I), glucose and insulin responses were assessed. In a second part (Experiment II), we followed the time-course of satiety scores in a larger subject sample, since behavioural variables show a greater variability [31] than biological ones.
METHODS
Subjects
Twenty-four subjects participated in the study, divided in two experimental parts. The same twelve healthy adults (6 males, 6 females) participated in Experiments I and II and a further 12 adults (6 males, 6 females) participated in Experiment II. They were 18-40 years old, with a body mass index (BMI) of 19.0-25.1 kg/m2 (Table 1).
|
Table 1: Anthropometric characteristics of the subjects (mean ± s.e.m). |
||
|
|
Experiment I (n = 12) |
Experiment II (n = 24) |
|
Age (yrs) |
23.4 ± 1.0 |
23.5 ± 0.68 |
|
Body weight (kg) |
64.1 ± 2.4 |
65.9 ± 1.9 |
|
Height (cm) |
174 ± 2 |
175 ± 1 |
|
BMI (kg/m2) |
21.1 ± 0.4 |
21.4 ± 0.4 |
|
BMI: body mass index |
||
They were recruited through local advertisement. All subjects underwent a pre-study clinical examination and were healthy with no personal history of illness or gastrointestinal surgery. The absence of restrained eating habits was confirmed by the Three-Factor Eating Questionnaire [32]. Subjects were excluded if they reported food allergies. All subjects signed a written informed consent prior to the beginning of the study. The protocol was approved by the Ethics Committee of Lorraine (France) and complied with the ethical guidelines of the Declaration of Helsinki (amended at Tokyo, Venice, Hong Kong and Somerset West).
Test meals
The subjects consumed two breakfasts (Table 2), which were similar in energy and macronutrient content with the same proportion of energy provided by protein (11%), fat (23%) and carbohydrate (66%).
|
Table 2: Energy and macronutrient contents of the high slowly available glucose (HSDS) and the low slowly available glucose (LSDS) versions of the test breakfasts. |
||
|
|
HSDS |
LSDS |
|
Energy (kJ) |
1730 |
1678 |
|
Protein (g) |
11 |
11 |
|
Fat (g) |
12 |
10 |
|
Fibre |
2 |
2 |
|
Carbohydrate (g) |
65 |
68 |
|
starch (g) |
24 |
21 |
|
slowly-digestible starch (g) |
9.6 |
0.5 |
|
rapidly-digestible starch (g) |
34 |
47 |
|
Calculated glycaemic index * |
47 |
73 |
|
* Each carbohydrate component is expressed as a percentage of total carbohydrate in the meal and multiplied by the relevant glycaemic index (GI). The sum of these values represents the calculated GI for the meal: the GI values used for each carbohydrate component are skimmed milk 32, full fat milk 27, chocolate powder 65, orange juice 57, honey plain biscuit 45, chocolate-flavoured ready to eat cereal 84. All GI values were taken from Foster-Powell et al.(Foster-Powell et al., 2002) with the exception of both cereal products for which the GI was previously measured (internal data). |
||
The choice of energy load (about 1674 kJ, 400 kcal) was based on the mean energy intake of French adult consumers at breakfast [33]. The breakfast meals were composed of items usually consumed for breakfast in France. They differed in the GI of the cereal product, previously determined according to the recommended protocol [34]. The in vitro CHO digestibility profiles of the cereal foods were determined by the Englyst method [35,36]. The difference in SDS content was a consequence of the level of starch gelatinisation parameters used in manufacturing both cereal products [28,29]. The HSDS version of the breakfast consisted of 62.5 g of commercial honey-plain biscuit for breakfast with chocolate chips (GI = 45 and SDS = 15.4 g / 100 g), skimmed milk (180 ml), chocolate powder (10 g) and orange juice (80 ml). The low SDS (LSDS) version of the breakfast consisted of 56 g of commercial chocolate-flavoured ready-to-eat cereal (GI = 84 and SDS = 0.9 g / 100 g), full fat milk (180 ml), chocolate powder (10 g) and orange juice (80 ml).
Design of Experiment I
A within-subject design was used. The two versions of the breakfast meal were consumed in counterbalanced order, one week apart. All the twelve subjects (6 males and 6 females) were required to fast from 8.00 pm in the evening preceding each test day and to refrain from fluid intake from midnight. Subjects arrived at the study centre at least 30 min prior to the beginning of the session and stayed in throughout the session. They were isolated and comfortably installed. The onset of breakfast ingestion, designated as T0, was set according to the subject’s usual breakfast time (± 30 min) and the measurement period lasted 240 min. A catheter was inserted into the antecubital vein of one arm prior to the breakfast test and blood samples were drawn 15 min before T0, at T0, and subsequently at various intervals during the postprandial period (15, 30, 60, 90, 120, 150, 180 and 240 min). The total blood volume for each subject did not exceed 150 ml for the whole trial.
Plasma assays
Blood samples were immediately centrifuged (3000 rpm, 10 min) after withdrawal and plasma was stored at -20°C. Samples for glucose analysis were stored at 4°C and analysed within 6 hrs using the enzymatic colorimetric method GOD-PAP (Boehringer Mannheim reagents, 0.9% and 1.8% CV, intra- and interassay respectively). Insulin analysis was conducted using a radio-immunological method (Cis bio reagents, 2.1% and 2.6% CV, intra- and interassay respectively). The means of the withinand between- assay coefficients of variation (CV) were 3.5% and 5.3% respectively.
Design of Experiment II
It was previously recommended to increase the number to at least n = 18 because of the large between-subject and betweenday variability of the scores derived from visual analogue scales [37]. Thus, we decided to increase the sample to 24 subjects. The 12 subjects from Experiment I participated in Experiment II and 12 new subjects were recruited.
The same design and test breakfast meals were used as in Experiment I. Subjects were asked to assess hunger sensations and gastric fullness on 100 mm linear visual analogue scales (VAS). The scale for assessment of hunger sensations ranged from 0 (“not hungry at all”) to 100 (“very hungry”). The scale for gastric fullness ranged from 0 (“stomach not full at all”) to 100 (“stomach full”). Hunger and gastric fullness were assessed before the onset of eating (baseline) and 30, 60, 90, 120, 160, 190, 220 and 240 min throughout the postprandial period.
Calculations and statistical analyses
Analyses were conducted on Systat 10.1 (SPSS, Chicago, IL). According to the method for analysing serial measurements [38], four pre-planned comparisons were considered of interest, 1) a plasma glucose incremental area under the curve (iAUC) over the 120 min following breakfast such as that usually used to determine the GI 2) a total AUC (tAUC) to evaluate the difference in the total amount of glucose disposal during the morning session (from T0 to T240 min), 3) the plasma glucose peak level and 4) the plasma glucose level during the latter part of the interval between breakfast and lunch time, i.e. at 180 and 240 min, to determine whether the GI of breakfasts might modify glucose availability at the end of the morning period. The insulin variable was analysed similarly. The glucose and insulin data showed a normal distribution. AUCs were calculated using the trapezoidal method and analysed by Student’s t tests. Data are shown as means ± SEM with P < 0.05 considered to be statistically significant. The hunger feelings and gastric fullness ratings were analysed by repeated measures analyses of variance (ANOVA) with condition (high and low SDS), order (day 1, day 2) and time (0 to 270 min) as within-subject factors and gender (male, female) as the between-subject factor. For each variable, a tAUC was calculated on the whole session. They were expressed in mm per min and analysed by Student’s t tests.
RESULTS
Experiment I
The plasma glucose and insulin concentrations before breakfast were not different between the conditions.
Plasma glucose responses to the breakfast meal showed the usual postprandial peak followed by a progressive decrease to the preprandial concentrations (Figure 1A).
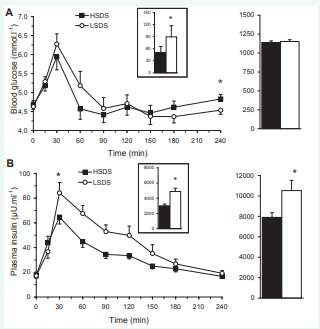
Figure 1: Left. Profiles of plasma glucose (A), insulin (B) concentrations following the consumption of the breakfast high (?) or low (?) in slowly digestible starch (SDS). Right. Corresponding areas under the curves (tAUC) over the whole session. Inset. incremental AUC over 120 min. The data are means ± SEM. *different from the high SDS condition, P < 0.05.
The peak level was observed with a mean delay of 30 min for both groups, with its magnitude not different between conditions (5.9 ± 0.3 and 6.3 ± 0.3 mmol.l-1, ns). The ANOVA confirmed the difference of the glucose responses between breakfasts with a 43% reduction of glucose iAUC over the postprandial 120 min in the HSDS compared to the LSDS condition (50.6 ± 10.8 vs 89.3 ± 16.9 mmol.l-1.min respectively, P = 0.03). Conversely, tAUC of glucose concentrations between T0 and T240min were not different between conditions (1140 ± 34 and 1153 ± 39 mmol.l-1.min in the HSDS and LSDS respectively, ns). Finally, plasma glucose concentrations were not different between conditions at T180 min but were higher at T240 min after the HSDS than for the LSDS breakfast (4.8 ± 0.2 and 4.5 ± 0.1 mmol.l-1 respectively, P = 0.04).
The results for plasma insulin profiles were consistent with glucose (Figure 1B) but the peak was lower after the HSDS than the LSDS breakfast (64.6 ± 5.5 and 84.2 ± 8.4 µU.ml-1 respectively, P = 0.032). A 26% reduction of the insulin iAUC over the 120 min postprandial period was found in the HSDS compared to the LSDS condition (5123 ± 291 and 6938 ± 550 µU.ml-1.min respectively, P = 0.004). The insulin tAUC was also reduced by 25% (7905 ± 449 and 10524 ± 1003 µU.ml-1.min respectively, P = 0.01). There was no significant difference in insulin concentration between the conditions at T180 and T240 min.
There was a positive correlation between the plasma glucose and insulin iAUC (r = 0.62, P = 0.001).
Experiment II
The hunger and gastric fullness scores before breakfast were not different between the conditions. The global ANOVA for hunger scores (Figure 2) revealed a condition effect [F(1,21) = 5.265, P = 0.032] and a condition and time interaction [F(7,147) = 2.829, P = 0.009]. Comparisons showed that mean hunger scores were significantly lower 90 min (P = 0.025), 120 min (P = 0.003) and 160 min (P = 0.05) after the HSDS than the LSDS breakfast. Consistently, the mean tAUC for hunger scores was significantly lower following the HSDS than the LSDS breakfast (P = 0.017).
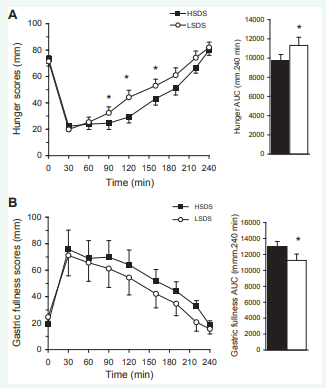
Figure 2: Left. Hunger (A) and gastric fullness score (B) profiles following the consumption of the breakfast high (?) or low (?) in slowly digestible starch (SDS). Right. Corresponding areas under the curves (AUC) over the whole session. The data are means ± SEM. *different from the high SDS condition, P < 0.05
The global ANOVA for gastric fullness scores revealed a condition effect [F(1,21) = 8.589, P = 0.008] with no interaction with time, gender or order, the levels of gastric fullness over the session being higher in the HSDS than in the LSDS condition. Consistently, the mean tAUC for gastric fullness scores was significantly higher following the HSDS than the LSDS breakfast (P = 0.015).
DISCUSSION
Experiment I showed that a low-GI cereal product with a high slowly digestible starch content reduced the postprandial glucose response of the meal in which it was introduced when compared to a meal matched in terms of volume, macronutrients and energy, but based on a high-GI cereal product. This difference was not significant anymore when the whole session was considered i.e., 240 min, suggesting that this difference in glucose concentrations during the beginning of the morning session were compensated at least partially during the rest of the session. This hypothesis is supported by the fact that plasma glucose concentrations were slightly higher 240 min after the HSDS than the LSDS breakfast. Previously, similar results were obtained and showed that the mechanism of this change in postprandial glucose response was the glucose rate of appearance from the cereal product [13,38,39]. Under very-low-moisture conditions, the extent of starch gelatinisation was reduced and resulted in partially intact starch granules that were less susceptible to the action of amylolytic enzymes [29,40]. Due to this low gelatinised starch state, the appearance rate of glucose from the HSDS breakfast was slower than the LSDS breakfast [41], and led to low glycaemic response.
As expected, the glucose and insulin responses were correlated, but the correlation coefficient was rather weak. However, this value is in the range of previous results obtained [16,23] and suggests that other factors are probably involved in the glucose uptake by tissues such as NEFA levels [42,43] or glycogen stores [44], two parameters that can widely vary between subjects after an overnight fast. Indeed, studies have shown that the macronutrient content in link to digestibility of CHOs can dramatically influence the metabolism of glucose derived from cereal products [23,45].
Experiment II showed that the HSDS breakfast modified the feeling of satiety evaluated by hunger and gastric fullness scores on VAS. These differences were mainly found between 90 and 160 min after the meal onset. This suggests that the effect of GI on satiety may occur in a time-window located in the middle of the morning period and not during the late postprandial period as generally suggested. It is important to remind that these satiety scores, including hunger scores, are not to be confused with the hunger signal that triggers the initiation of a meal. Their meaning is still under debate and it is possible that sensations of gastric fullness play a major role. Although there is an increasing amount of data arguing for the relevance of these satiety scores on actual intake [37,46,47,48], this sensation could actually be more the individual interpretation of gastric fullness than hunger per se. This is supported by a previous study showing that gastric fullness scores were the only ones associated with actual intake [49]. Although in this paper, the magnitude of this difference in subjective scores was low, i.e. about 15 mm at its maximum for hunger and 10 mm for gastric fullness on a 100 mm scale, this has been considered to be of clinical relevance [37,49]. Therefore, by modifying the process of a cereal product (biscuit), it is possible to modify the hunger feelings following the breakfast in which this product was incorporated.
Although results of the two experiments cannot be compared directly, the biological and behavioural profiles were consistent. In our studies, the differences in blood glucose disposal and insulin concentration in Experiment I and in the postprandial sensations of satiety in Experiment II were in agreement with such an inverse relationship. The exact mechanism of this glucose-induced effect on satiety is still under debate. Absolute glucose concentrations do not appear to be very important in food intake regulation, but transient and dynamic declines in blood glucose concentration seem to be strongly related to meal initiation [49,50,51]. In addition, glucose influences appetite possibly through glucoreceptors and osmoreceptors in the duodenal lumen, which may induce satiety through direct vagal stimulation of the release of insulin and/or GLP-1 [52]. Based on the type of cereal products used, with a high SDS content, i.e. slow starch digestibility, this hypothesis could be considered.
CONCLUSION
In conclusion, a low-GI, HSDS cereal product consumed in a mixed breakfast meal maintained postprandial plasma glucose levels more efficiently over the whole morning, and reduced total plasma insulin demand compared to a meal containing a high GI, LSDS cereal product. In parallel, satiety feelings were increased transitorily from 90 to 180 min after the consumption of the test breakfast high in slowly digestible starch, suggesting that such cereal products may represent a benefit for consumers in food cravings between meals. The mechanisms of action should be investigated further to better understand how this kind of cereal product may play a role in appetite regulation.
ACKNOWLEDGMENTS
We are grateful to Klaus Englyst, Englyst Carbohydrates - Research & Services Ltd, Southampton, U.K. for his collaboration in determining the carbohydrate digestibility profile of the cereal products, and Jeanine Louis-Sylvestre in the study supervision and her scientific advice regarding the analysis and first draft of manuscript.
REFERENCES
28. Vinoy S, Gerard C, Lang V. The glycaemic index of cereal foods commonly consumed at breakfast depends on the type of food processing. Annals of Nutrition and Metabolism. 2001; 45: 392.
33. Volatier J. Enquête Individuelle et Nationale sur les Consommations Alimentaires (National and Individual Survey on Eating Consumptions), Lavoisier ed. Paris. 2000.


