Comparative Analysis of Food Consumption Pattern and Body Mass Index of University Residential Students
- 1. Department of Sports Science, Afe Babalola University, Nigeria
- 2. Deptartment of Biochemistry, Afe Babalola University, Nigeria
Abstract
Background: College students experience a period of uncertainty and statements that are strongly influenced by models of new behavior patterns found in the university. Poor eating habits are a major public health concern among college students who experience transition into university life, during which they are exposed to stress and lack of time.
Objective: To examine the comparative analysis of food consumption pattern and body mass index of university residential students.
Methods: Descriptive research design was adopted. The sample for the study (556 students: 278 male and 278 female) was drawn from the population of Afe Babalola University, Ado-Ekiti. Stratified and simple random sampling techniques (fishbowl without replacement) were used to draw the sample from the population. A self-structured questionnaire on food consumption pattern (FCP) was administered for the study. Pearson product moment coefficient and multiple regression analysis were used for data analysis.
Results: The result of the correlation analysis showed that nearly all the variables considered for the study had significant positive/negative correlation except for FFS (family financial status) and FCP4 (vegetables). The regression analysis showed the significant composite contribution of FCP to BMI (F(11,544)=2.44, p < .05) with 22% of predictors accounting for variance in the criterion variable (R=.217).
Conclusion: Therefore, the study concluded that food consumption pattern of residential university students is a critical factor that requires close attention of all the stakeholders. Recommendation: It is therefore recommended that the campaign for nutritional guidelines Nutrition society should be extended to the higher institution of learning community
Keywords
• Food consumption pattern
• Body mass index
• Family financial status
• Monthly pocket money
Citation
Gbenga JB, Folake JK (2017) Comparative Analysis of Food Consumption Pattern and Body Mass Index of University Residential Students. J Hum Nutr Food Sci 5(1): 1104
ABBREVIATIONS
FCP: Food Consumption Pattern; FFS: family financial status; BMI: Body Mass Index; FCPS: Food Consumption Pattern Scale; MPM: Monthly Pocket Money
INTRODUCTION
College students experience a period of uncertainty and statements that are strongly influenced by models of new behavior patterns found in the university [1]. According to Márcia, Viviane, Mariana and Roberta [2], college students most often face a different schedule of activities which interferes very much in their feeding behavior. Changes in food pattern, physical exercise, stress, alcohol consumption, smoking and college lifestyle are some of the factors that have made college students more vulnerable to circumstances risky to their health [3]. Poor eating habits are a major public health concern among college students who experience transition into university life, during which they are exposed to stress and lack of time. Kurubaran et al. [4], stressed that college students adopt unhealthy eating habits mainly because of reduced affordability and accessibility of healthy diet on the premises and the presence of an abundance of surrounding fast food outlets. Among many factors which have impact on the food consumption patterns of young people is the school environment in which students spend most of their time. College presents an environment that has been characterized by unhealthy dietary patterns and reduced physical activity which places students at a greater risk of weight gain [5]. College students are at an increased risk of weight gain due to environmental dynamics and behavioral changes. Prevention of weight gain through food consumption monitoring may have a profound impact on the prevalence of overweight or obesity later in life.
The association between poor diet and obesity is well established globally and regionally indicating a low consumption of fruit and vegetables and high consumption of energy-dense food and drinks, along with irregular meal consumption and frequent consumption of snacks [6]. Würbach, Zellner, and KromeyerHauschild [7], in their study found out that regular meal patterns were associated with the lower standardized body mass index (BMI-z) while breakfast skipping, high consumption of snacks, sugary beverages and low consumption of fruit and vegetables were associated with increased BMI-z. Diets mainly consisting of foods such as low-fat milk products, fruits and vegetables, whole grains and high fiber intake are associated with lower energy intakes [8] and smaller gains in body mass index (BMI kg/m2 ) over time [9]. World Health Organization [10] referred to body mass index (BMI) as a statistical measure of a person’s weight scaled according to height, which is used to classify people into the categories of obese (BMI >30), overweight (BMI 25 - < 30), normal range (BMI 18.5 - < 25) and underweight (BMI < 18.5). This paper, therefore, investigated the comparative analysis of food consumption pattern and body mass index of university residential students.
OBJECTIVES OF THE STUDY
The main objectives of this study were:
- To evaluate the body mass index of university residential students
- To assess the food consumption pattern of university residential students
- To do a comparative analysis of the relationship between food consumption pattern and body mass index of the study sample.
MATERIALS AND METHODS
Descriptive survey method of research was adopted for the study. The population comprised the students of Afe Babalola University, Nigeria. Stratified and Simple random sampling techniques (fishbowl without replacement) were used to select the respondents for the study. A total of 556 students of Afe Babalola University participated in the survey in proportion of 278 male (50%) and 278 female (50%) whose age ranges from 14 and above, from five different colleges (College of Sciences, Social and Management Sciences, Law, Engineering and Health and Medical Sciences) voluntarily participated in the study. The setting for this study was the campus of Afe Babalola University, Ado-Ekiti. The ethical approval for the study was given by the directorate of research development, innovation and internship of the University. Informed consent forms were given to the respondents before the questionnaire were given to them. A selfstructured questionnaire on Food Consumption Pattern Scale (FCPS), was used to collect information on the food consumption pattern. The content validity and reliability of the instrument were done through a pilot test on the sample of the neutral population outside the study area and analyzed with Cronbach Alpha (α=.637). The instrument was administered personally by the researcher and three research assistants. Weight was measured using a digital weighing scale in kilogram (kg). Height was measured in meter (m) without shoes on a stadiometer. BMI was derived from CDC BMI-for-age chart for 2-20 years [11] and WHO BMI formula for adult, 20 years and above [10] (Figure 1,2).
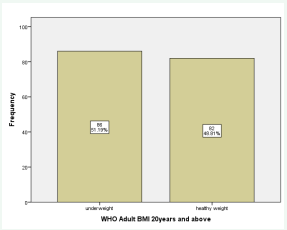
Figure 1: BMI for age Chart less than 20years.
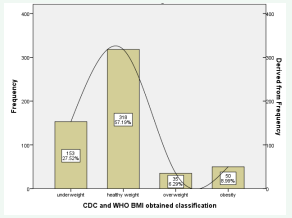
Figure 2: BMI for Adult and Adolescent combined. BMI is categorized into obese, overweight, normal or healthy weight and underweight.
CDC BMI-for-age chart 2-20 years was used as a guide to obtained percentile and adjusted BMI-for-age values for each respondent. The chart classifies BMI into underweight (5th percentile - 85th percentile - 95th percentile). Weight (kg) divided by height (m2 ) was calculated to derive BMI values for adult category. The obtained values were categorized into obese (BMI >30), overweight (BMI 25-< 30), normal range (BMI 18.5-<25) and underweight (BMI<18.5) (Figure 3) [10].
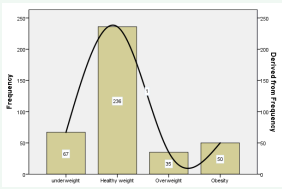
Figure 3: BMI is categorized into obese (BMI >95th percentile), overweight (BMI >85th - < 95th percentile), normal or healthy weight (BMI >5th – 85th percentile) and underweight (BMI <5th percentile).
Descriptive statistics of percentage count, frequency, mean and standard deviation were used to summarize the data collected. Inferential statistics of Pearson Product Moment Correlation and Multiple Regression Analysis were used to test the level of significance of the comparative analysis of food consumption pattern of university residential students. The significance level was set at P < 0.05. The data was transformed with inverse distribution function. Kolmogorov Smirnov and Shapiro Wilk were used to check the normality of the data. Statistical Package for Social Sciences version (SPSS 23.0) was used for the statistical calculations.
RESULTS AND DISCUSSION
The aim of this study is to investigate the food consumption pattern and body mass index of university residential students. The demography showed that 556 students of Afe Babalola University participated in the survey in the proportion of 278 male (50%) and 278 female (50%). Most of the respondents who participated in the study are within the age range of 17-19years (64.2%). The Social Management Science had the largest proportion of representation in the study with 25.5%. The 74.8% of the respondents belonged to Christian religion. Most of the respondents belonged to low and middle class in the family financial status category while 4.1% belonged to high class. This result displaced the notion that most of the students found in the full residential private institutions are from the wealthy class of the society. This shows that the need for educational empowerment has transcended the traditional family financial status. Every family makes efforts to give their children quality education through family financial planning and financial institutions. The MPM of #20000 and above had 67.4% than any other items in the category. This explains the direct effect of family financial planning to ensure healthy welfare for their children. The BMI obtained values from WHO and CDC classification showed that 57.19% belonged to healthy weight, 27.52% belonged to underweight, 6.29% belonged to overweight while 8.99% belonged to obesity category. Lack of adequate time to make a healthy nutritional choice, due to academic workload; peer group influence, body image misconception, and disordered eating could be responsible for data reported for the underweight body mass index. Body mass index may not be a most reliable body fat indicator but it is a reliable reference marker for body size. Olufemi and Abiodun [12] in their study of prevalence of overweight and obesity in an institutionalized multi-ethnic based male adult sample, reported the prevalence of overweight and obesity among Lagos State University undergraduate male adults to be 14.0 % (BMI: 25 – 29) and 2.3 % (BMI: 30 – 40) respectively. Akinpelu et al. [13], found that prevalence of overweight was 0 - 8.1 % and 1.3 - 8.1 % in males and females respectively while that of obesity was 0 - 2.7 % and 0 - 1.9 % still in males and females respectively in a sample of Nigerian adolescents in an urban community aged 12-18 years (Table 1).
|
Table 1: Demographic variables of the respondents. |
||||
|
S/n |
Demographic variables |
Category |
Frequency |
Percent |
|
1 |
sex |
|
|
|
|
|
|
male |
278 |
50.0 |
|
|
|
female |
278 |
50.0 |
|
2 |
Age in years |
|
|
|
|
|
|
14-16years |
26 |
4.7 |
|
|
|
17-19years |
357 |
64.2 |
|
|
|
20-22years |
147 |
26.4 |
|
|
|
23-25years |
18 |
3.2 |
|
|
|
26years and above |
3 |
.5 |
|
3 |
college |
|
|
|
|
|
|
Science |
108 |
19.4 |
|
|
|
SMS |
142 |
25.5 |
|
|
|
Engr |
101 |
18.2 |
|
|
|
MHS |
83 |
14.9 |
|
|
|
Law |
122 |
21.9 |
|
4 |
religion |
|
|
|
|
|
|
christianity |
416 |
74.8 |
|
|
|
islam |
123 |
22.1 |
|
|
|
traditional |
11 |
2.0 |
|
|
|
others |
6 |
1.1 |
|
5 |
FFS |
|
|
|
|
|
|
low class |
259 |
46.6 |
|
|
|
middle class |
274 |
49.3 |
|
|
|
high class |
23 |
4.1 |
|
6 |
MPM |
|
|
|
|
|
|
less than 10000 |
47 |
8.5 |
|
|
|
11000-20000 |
134 |
24.1 |
|
|
|
20000 and above |
375 |
67.4 |
|
FFS: Family Financial Status; MPM: Monthly Pocket Money |
||||
Food Consumption Pattern Scale showed that FCP1 (rice) had the highest mean and standard deviation (3.42+.04) (Table 2).
|
Table 2: Food Consumption Pattern Scale (FCPS) Summary. |
|||||||||
|
ITEM CODE |
ITEMS |
none |
Once a week |
Twice a week |
Thrice a week |
Every day of the week |
Mean |
Std. Error of Mean |
Std. Deviation |
|
FCP1 |
rice |
11 |
30 |
34 |
121 |
360 |
3.42 |
.041 |
.96 |
|
|
|
2.0 |
5.4 |
6.1 |
21.8 |
64.7 |
|
|
|
|
FCP2 |
beans, moinmoin |
47 |
102 |
169 |
151 |
87 |
2.23 |
.050 |
1.17 |
|
|
|
8.5 |
18.3 |
30.4 |
27.2 |
15.6 |
|
|
|
|
FCP3 |
natural fruits |
86 |
203 |
132 |
89 |
46 |
1.65 |
.049 |
1.16 |
|
|
|
15.5 |
36.5 |
23.7 |
16.0 |
8.3 |
|
|
|
|
FCP4 |
vegetable |
106 |
212 |
118 |
78 |
42 |
1.53 |
.050 |
1.17 |
|
|
|
19.1 |
38.1 |
21.2 |
14.0 |
7.6 |
|
|
|
|
FCP5 |
bread, hot dogs. doughnut, sausage roll |
64 |
144 |
148 |
120 |
80 |
2.01 |
.052 |
1.23 |
|
|
|
11.5 |
25.9 |
26.6 |
21.6 |
14.4 |
|
|
|
|
FCP6 |
beverage/fruit juice |
52 |
90 |
109 |
126 |
179 |
2.52 |
.057 |
1.33 |
|
|
|
9.4 |
16.2 |
19.6 |
22.7 |
32.2 |
|
|
|
|
FCP7 |
fish and meat, chicken, turkey |
42 |
70 |
68 |
93 |
283 |
2.91 |
.057 |
1.35 |
|
|
|
7.6 |
12.6 |
12.2 |
16.7 |
50.9 |
|
|
|
|
FCP8 |
swallow |
78 |
245 |
101 |
86 |
46 |
1.60 |
.049 |
1.15 |
|
|
|
14.0 |
44.1 |
18.2 |
15.5 |
8.3 |
|
|
|
|
FCP9 |
yam and egg |
92 |
212 |
157 |
69 |
26 |
1.51 |
.045 |
1.05 |
|
|
|
16.5 |
38.1 |
28.2 |
12.4 |
4.7 |
|
|
|
|
FCP10 |
spaghetti/indomie and egg |
80 |
164 |
142 |
123 |
47 |
1.81 |
.050 |
1.18 |
|
|
|
14.4 |
29.5 |
25.5 |
22.1 |
8.5 |
|
|
|
|
FCP11 |
shawarma/suya |
66 |
190 |
124 |
108 |
68 |
1.86 |
.052 |
1.21 |
|
|
|
11.9 |
34.2 |
22.3 |
19.4 |
12.2 |
|
|
|
|
FCP1: Rice; FCP2: beans/moinmoin; FCP3: natural fruits; FCP4: vegetable; FCP5: bread/hot dogs/doughnut/sausage roll; FCP6: beverage/fruit juice; FCP7: fish/meat/ chicken/turkey; FCP8: swallow; FCP9: yam/egg; FCP10: spaghetti/indomie/egg; FCP11: shawarma/suya |
|||||||||
|
Table 3: correlation matrix of the variables. |
||||||||||||||
|
FCP1 |
FCP2 |
FCP3 |
FCP4 |
FCP5 |
FCP6 |
FCP7 |
FCP8 |
FCP9 |
FCP10 |
FCP11 |
BMI |
FFA |
MPM |
|
|
FCP1 |
1 |
|
|
|
|
|
|
|
|
|
|
|
|
|
|
FCP2 |
.085* |
1 |
|
|
|
|
|
|
|
|
|
|
|
|
|
FCP3 |
-.139** |
.242** |
1 |
|
|
|
|
|
|
|
|
|
|
|
|
FCP4 |
.006 |
-.050 |
.031 |
1 |
|
|
|
|
|
|
|
|
|
|
|
FCP5 |
.069 |
.058 |
.139** |
.069 |
1 |
|
|
|
|
|
|
|
|
|
|
FCP6 |
.139** |
.182** |
.149** |
.031 |
.355** |
1 |
|
|
|
|
|
|
|
|
|
FCP7 |
.187** |
.121** |
.126** |
.046 |
.125** |
.304** |
1 |
|
|
|
|
|
|
|
|
FCP8 |
-.127** |
.196** |
.265** |
.001 |
.150** |
.030 |
.089* |
1 |
|
|
|
|
|
|
|
FCP9 |
-.074 |
.163** |
.238** |
.056 |
.187** |
.059 |
.012 |
.492** |
1 |
|
|
|
|
|
|
FCP10 |
.019 |
.098* |
.171** |
.019 |
.247** |
.258** |
.107* |
.225** |
.410** |
1 |
|
|
|
|
|
FCP11 |
.038 |
.046 |
.195** |
.022 |
.273** |
.231** |
.121** |
.214** |
.307** |
.398** |
1 |
|
|
|
|
BMI |
.019 |
.149** |
.052 |
.025 |
.127** |
.031 |
.036 |
.101* |
.114** |
.071 |
.098* |
1 |
|
|
|
FFS |
.003 |
.053 |
.040 |
.002 |
-.040 |
.019 |
-.002 |
.053 |
.028 |
-.022 |
.007 |
.050 |
1 |
|
|
MPM |
.034 |
-.036 |
-.083* |
-.025 |
.046 |
-.028 |
-.042 |
-.030 |
.001 |
.045 |
.032 |
.050 |
-.161** |
1 |
|
FCP1: Rice; FCP2: beans/moinmoin; FCP3: natural fruits; FCP4: vegetable; FCP5: bread/hot dogs/doughnut/sausage roll; FCP6: beverage/fruit juice; FCP7: fish/meat/ chicken/turkey; FCP8: swallow; FCP9: yam/egg; FCP10: spaghetti/indomie/egg; FCP11: shawarma/suya; BMI: Body Mass Index; FFS: Family Financial Status; MPM: Monthly Pocket Money |
||||||||||||||
Availability, taste, cultural preference, cooking time, rate of digestion and many other reasons may be responsible for the high consumption of rice (mainly jollof, fried and white rice) among the students. FCP7 (fish, meat, chicken, and turkey) had the second highest mean and standard deviation value (2.91+.057). Apart from the nutritional benefits of protein, food in this category is expected to complement serving meal culturally. This could be responsible for high consumption. FCP6 (beverage/ fruit juice) had the third highest mean and standard deviation value (2.52+.057). FCP3 (natural fruits) had mean and standard deviation values of 1.65+.049 (36.5%, once a week and 23.7% twice a week). Non-availability of natural fruits sufficient to meet the growing thirst for diet monitoring may be responsible for the higher mean of beverage/fruit juice. Hedley, Ogden, Johnson, Carroll, Curtin, Flegal [14] affirmed that consuming fruits and vegetables in portions recommended by the 2005 dietary guidelines can reducethe overall energy density of the diet and could displace more energy-dense foods. FCP4 (vegetables) had mean and standard deviation value of 1.53+.05. Sakamaki, Toyama, Amamoto, Liu, Shinfuku [15] reported in their study that 27.3% of respondents consumed fruits at least three times per week similar to study in Syria while this study had 16% (three times per week) consumption of vegetables.This study reported more than 80% of natural fruits consumption, more than 90% of beverage/fruit juice consumption and more than 80% vegetable consumption. In contrast, Adu, Falade, Nwalutu, Elemo and Magbagbeola [16] reported about 3% of their respondents did not consume fruits at all, 50% of them consume vegetables occasionally; 39% of them, weekly and only 11% of them daily. Considering this study this report may be referring to natural fruits and fruit juice. Consumption of fruits and vegetables among adolescents between the ages of 12 and 19 years has been reported to decrease with age [17]. FCP5 (bread, hot dogs, doughnuts, sausage roll) had mean and standard deviation value of 2.01+.052. The frequent consumption of snacks and light meals is a recognizable aspect of teenage food behavior. FCP8 (swallow) had mean and standard deviation value of 1.60+.049. FCP9 (yam and egg) had mean and standard deviation value of 1.51+.045. FCP10 (spaghetti/indomie and egg) had mean and standard deviation value of 1.81+.05. FCP11 (Shawarma/Suya) had mean and standard deviation value of 1.86+.052.
The Table (3) revealed that FCP1 had a positive relationship with FCP6 (.139) and FCP7 (.187) and negative relationship with FCP3 (-.139) and FCP8 (-.127). FCP2 had positive relationship with FCP3 (.242), FCP6 (.182), FCP7 (.121), FCP8 (.196), FCP9 (.163) and BMI (.149). FCP3 had positive relationship with FCP5 (.139), FCP6 (.149), FCP7 (.126), FCP8 (.265), FCP9 (.238), FCP10 (.171) and FCP11 (.195). FCP5 had positive relationship with FCP6 (.355), FCP7 (.125), FCP8 (.150), FCP9 (.187), FCP10 (.247), FCP11 (.273) and BMI (.127). FCP6 had positive relationship with FCP7 (.304), FCP10 (.258), and FCP11 (.231). FCP7 had positive relationship with FCP10 (.107) and FCP11 (.121). FCP8 had positive relationship with FCP9 (.492), FCP10 (.225), FCP11 (.214), and BMI (.101). FCP9 had positive relationship with FCP10 (.410), FCP11 (.307) and BMI (.114). FCP10 had a positive relationship with FCP11 (.398). FFA had negative relationship MPM (-.161).
Relative contribution of the predictors (FCP) to the criterion variables (BMI) was shown by Table (4). FCP2 (β=.141, p<.05) and FCP5 (β=.109, p<.05) significantly predict changes in BMI of the university residential students. Composite prediction of FCP in BMI was significant (F(11,544)=2.44, P<.05) with 22% (R=.217) accounting for the variance change in the criterion variable which means there are still other 78% yet to be accounted for. Togo et al. [18], and Newby et al (2004) opined that certain food groups and nutrients are related to healthy dietary patterns and decreased the risk of obesity. A diet mainly consisting of foods such as lowfat milk products, a variety of fruits and vegetables, whole grains and high fiber intake is associated with lower energy intakes and smaller gains in BMI over time compared to people with lower intakes. Consuming higher amounts of high energy/low nutrient foods, red and processed meat, fat, sugar and low diet variety is associated with an increased risk of obesity and greater gains in BMI over time [19].
CONCLUSION
The study revealed that food consumption pattern plays a prominent role in the body mass index of young adolescents who are domiciled in the university community. The study is a reflection of the BMI characteristics that could be found in school environment where healthy food choices could be made if well practiced and where the landscape mapping and architectural design of the facilities encourage walking as a form of physical activity. Most of the respondents for the study fell within underweight and healthy (normal) weight range (category) which informed the need to increase awareness of healthy food choices and nutritional guidelines. The significant predictors of body mass index were foods rich in plant protein (beans and moin moin) and foods rich in carbohydrates (bread, doughnut, hotdogs and sausage roll). There is a need for further research to expand the scope of the study to cover more food items found or should be found in the university community and the recommended physical activity for the young adolescents.
RECOMMENDATION
The following are therefore recommended:
- Nutritional campaign by Nutrition Society and other stakeholders should be extended to higher institution students especially university residential students who do not have much of food choices than what is available in the school environment;
- Nutrition Society needs to give adequate attention to the kind of foods that are available to students in the higher institution of learning;
- There is a need to encourage healthy food choices and regular physical activity for young adolescents for improved healthy living.
ACKNOWLEDGEMENTS
We want to thank Prof. M.O. Aji safe for substantial moral support towards this study. We are also grateful to Messrs Toba Bamitale and Emmanuel Oyekan for their supports during the data collection. No funding was therefore received for this work.


