Difference in Nutrient Biomarkers Concentration by Habitual Intake of Milk among Preschool Children in an Urban Area of Indonesia
- 1. Department of Child Health, Medical School, Gadjah Mada University/ Sardjito Hospital, Indonesia
Abstract
Objectives: To determine whether habitual intake of milk distinguishes nutrient biomarkers a preschool children.
Design: a cross sectional study
Setting: urban area of Yogyakarta City, Indonesia
Subjects: Preschool children in Yogyakarta City, Indonesia who were selected randomly to include in a cross sectional study examining biomarkers of nutrient.
Results: There were 249 children included in the analysis. The prevalence of anemia, iron deficiency, iron deficiency anemia, deficiencies of zinc, iodine, and vitamin D were 2.0%, 32.1%, 0.4%, 49.2%, 54.3%, and 63.5% respectively; whereas prevalence of vitamin D insufficiency was 36.1%. Children who mainly consumed growing-up formula (GF group) showed highest median concentration of serum zinc (79.12 µg/dl), ionized calcium (1.3 mmol/l), and 25-OH vitamin D (48.4 nmol/l, P<0.05) compared to children who consumed sweetened condensed milk (SCM group) and less amount of milk (LM group).
Conclusions: Almost thirty percent of children consumed sweetened condensed milk as the substitute of growing-up formula. Micronutrient deficiencies (iron, zinc, iodine, vitamin D) were still prevalent among preschool children in urban area Yogyakarta, Indonesia. Children in GF group in general had lower prevalence of micronutrient deficiency and better nutrient biomarker concentration. Micronutrient deficiencies have negative impact on child health therefore there is urgent need to address micronutrient deficiency in Yogyakarta. Balanced dietary intake for preschool children should be promoted and consumption of appropriate type of milk for pre-school children should be encouraged to help in fulfilling their nutrients requirements, which growing-up formula as possible option.
Keywords
• Habitual intake of milk
• Formula milk
• Growing-up formula
• Growing-up milk
• Biomarkers
• Nutrients
• Foods intake
• Micronutrient deficiency
Citation
Prawirohartono EP, Lestari SK, Nurani N, Sitaresmi MN (2015) Difference in Nutrient Biomarkers Concentration by Habitual Intake of Milk among Preschool Children in an Urban Area of Indonesia. J Hum Nutr Food Sci 3(1): 1055.
ABBREVIATIONS
GF: Growing-up Formula; SCM: Sweetened Condensed Milk; LM: Less Milk; WAZ: Weight-for-Age Z-scores; HAZ: Height-forAge Z-scores; HWZ: Weight-for-Height Z-scores; EAR: Estimated Average Requirements; DRI: Dietary Reference Intake; AGP: Alpha-1 glycoprotein; CRP: C-reactive protein.
INTRODUCTION
Undernutrition is one form of malnutrition which include being underweight, stunting, wasting, and deficient in essential vitamins and minerals (micronutrient deficiencies) [1]. Childhood malnutrition in low and middle income countries is a serious problem because of its high prevalence and its implication on child health and development potential. Many health problems among preschool children have been known as the result of micronutrient deficiencies. Some of it are anemia which caused by iron deficiency [2], growth retardation because of zinc deficiency [3], rickets caused by vitamin D and calcium deficiency [4] and also iodine deficiency during childhood result in learning disability, poor growth, and diffuse goiter [5]. Micronutrient deficiencies usually occur among under five children due to low dietary nutrients intake, increased need of nutrients for rapid growth and development of infectious diseases [6]. Low socio-economic status, poor knowledge, food insecurity are also common risk factor of undernutrition [7].
Milk and other dairy products are important part of child diet as it contains protein of vitamins and minerals necessary for child growth and development [8-11]. Intake of milk and other animal-source foods have been shown to improve dietary quality of children in low-income countries [12]. During infancy period, breast milk is the most suitable foods which can provide infants’ nutrients needs. However, the rate of exclusive breastfeeding up to six months of age is as low as 12% in certain area in Indonesia [13] and ranges 9%-46% in other developing countries [14,15]. Lack of information [16], being a working mother [17], and intensive campaign for formula use especially in developing countries [18] are several factors which lead to this low rate of breastfeeding and increase use of infant formula milk as substitute. In addition mothers’ low education, misleading advertisement and low economic status could also result in the use of several types of milk which not suitable for infants.
In Laos, coffee creamer are often thought and used as breast milk substitute due its logo of a cartoon ‘baby bear held by its mother in the breastfeeding position’ [19]. While, study conducted in Jakarta, Indonesia, showed that the sweetened condensed milk (SCM) has been used to replace infant formula as breast milk substitute because of its cheaper price compared to infant formula [17]. During toddler and preschool period, parents might also use SCM as complementary feeding.
Although the people of Yogyakarta City are mostly educated, wide range of information sources and economic status might influence the feeding choices. Therefore, inappropriate complementary feeding, such as the use of SCM as substitute for growing-up formula (GF) might be practiced among less privileged families. We attempted to evaluate the effect of different habitual milk intake among preschool children on their nutritional biomarkers concentration as proxy of nutrition status.
MATERIALS AND METHODS
Study site
We performed an observational study in Yogyakarta City, an urban area of Indonesia from July 2011 to April 2012. This study namely the RETO Project mainly aimed to evaluate the difference of nutritional status, development, perception of mothers about milk consumption, and nutrient intakes among preschool children aged 3-5 years by habitual intake of milk. The area of Yogyakarta City is 32.5 km2 where most of it is used for dwelling. The total population in 2008 was 456,915 (223,227 or 48.9% males and 233,688 or 51.1% females). Children <5 years old were 6.3% of the total population [20]. Yogyakarta City consists of 14 kecamatan (district), 45 kelurahan (sub-district), 362 rukun warga (surrounding), and 2,523 the smallest unit rukun tetangga (neighborhood). All of rukun warga have at least a posyandu ( integrated health post) run by volunteers [20].
Study population
Study population was children aged 3 to 5 years who lived in the study areas which was selected randomly using a multiple cluster random sampling method and the parents or guardians consented to participate in this study. Children with congenital anomalies and chronic diseases were excluded from this study. The sampling process shown in Figure , resulted in 1070 children selected to join the pilot study.
Pilot study
Pilot study aimed to identify the habitual intake of milk of preschool children in the study area. Field workers visited the children at home to collect data of milk intake, both the frequency and the type or brand of milk which consumed in one week. Children in the pilot study were classified into 5 groups based on their habitual intake of milk data.
Group I or growing-up formula (GF) group was children who consumed ≥5 servings/week of GF (n=561); group II or sweetened condensed milk (SCM) group was children who consumed ≥5 servings/week of SCM (n=154); group III was children who consumed ≥5 servings/week other types milk instead of either GF or SCM (n=171); group IV or less milk (LM) group was children who consumed ≤4 servings/week any other milk instead of either GF or SCM (n=141); and group V was children whose habitual milk intake did not met the other groups’ criteria (n=43).
We intended to compare the nutrient intakes of children who consumed GF with those who consumed SCM. Therefore we only included children from group I (GF group), group II (SCM group), and group IV (LM as the comparison group) as the eligible subjects (n=856). Out of those children, 564 subjects did not consent to this study, then from those who were recruited, 10 children in GF group, 6 children in SCM group and 3 children in LM group who were excluded from analysis due to rejection for drawing blood for laboratory procedures. Finally, 14 children from GF group, 5 children from SCM group, and 5 children from LM group were excluded from analysis due to inadequate blood sampling and parents refused second blood sampling. Therefore, 249 children were included in the analysis (Figure 1).
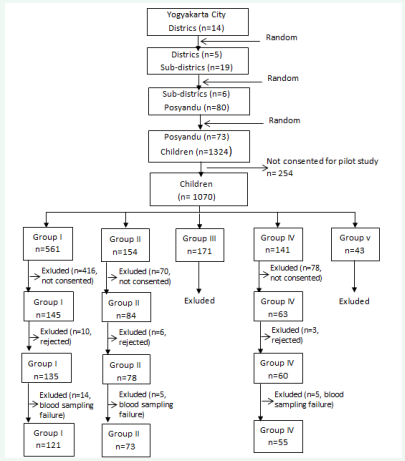
Figure 1: Data generation process
n= number of children
Socio-demographic data
Field workers collected socio-demographic data, including mother’s age, education, occupation, and also ownership of household facilities. While child’s data included in this study were sex and age.
Anthropometric indicators of nutritional status
The anthropometric indicators of nutritional status presented in this report, weight-for-age z-scores (WAZ), heightfor-age z-scores (HAZ), and weight-for-height z-scores (WHZ), were calculated by using the WHO Anthro version 3.1.0 software for children aged <5 years (World Health Organisation, Geneva, Switzerland). Then, nutritional status of children classified as stunted, wasted, or underweight if their HAZ, WHZ, WAZ less than-2SD, respectively [21].
Food intakes
Data of food intakes were collected using 3 days of 24-hour recall method including weekend days which were randomly selected with the intervals ranged between one week and one month to yield valid data of nutrient intakes [22]. The dietary data was then analysed by using Inafood software which was developed by Gadjah Mada University and the Nutrition Academy, Yogyakarta [23]. Inafood used food recipes, serving measure and composition of mixed dishes that usually consumed by the Javanese [24].
In general, Inafood works in 4 steps, 1) assigning code for each food, beverage, and supplement reported, 2) converting portion sizes consumed to grams, 3) converting the weights of food items based on portion weight and food recipes, 4) calculating nutrient intake based on the weight of each food items and Indonesian Nutrient Composition database and additional nutrients composition database [22-24].
Dietary intake data were collected by dieticians by interviewing mother or caregiver. The questioner used in interview was specially designed for the Inafood software which includes question regarding the type, amount or serving (using local serving size: glass, spoon, etc), cooking methods, brand, and component of food (for mix food or meal) for each food, beverages (including milk) and supplement consumed. Then in the analysis process, the nutritional composition of each brand of milk , snack or other processed food consumed by study subjects were added in Inafood database to increase dietary intake estimation precision. The outcomes of food analysis were intakes of energy, macro and micro nutrients per day. Dietary vitamin D from food could not be estimated as vitamin D nutrient composition for most of food consumed was not available. The cut-offs of estimated average requirements (EAR) of dietary reference intake (DRI) of Institute of Medicine of USA/Health Canada [25] were used to assess intake adequacy.
Laboratory procedures
We assessed biomarkers of nutrients (hemoglobin, ferritin, zinc, ionized calcium, 25-OH vitamin D, thyroglobulin, and albumin) and inflammation status [alpha-1 glycoprotein (AGP), and C-reactive protein (CRP)]. Blood samples were collected and prepared for further analysis in the field laboratory and were sent directly to the laboratory for biomarkers analysis using standardized procedures [26-34]. Ionized calcium and 25- OH vitamin D assays were done by Laboratorium Klinik Prodia Jakarta, whereas hemoglobin, ferritin, albumin, thyroglobulin, CRP, and AGP were performed by Laboratory of Biochemistry Department, Medical School, Gadjah Mada University, and Yogyakarta, Indonesia.
Anemia defined as having hemoglobin concentrations less than the WHO cut-off point of 110 g/l [35], while iron deficiency was assessed if the corrected ferritin concentration <12 µg/l [36]. Ferritin serum was corrected by inflammation status which classified as reference/ normal (both AGP and CRP were normal, ≤1.0 g/l and ≤5 mg/l respectively), incubation (AGP was normal and CRP was high), early convalescence (both AGP and CRP were high), and late convalescence (AGP was high whereas CRP was normal), with the correction factors of 0.77, 0.53, and 0.75 respectively [36]. Iron deficiency anemia defined as having both low hemoglobin and corrected serum ferritin concentrations.
According to their serum zinc concentration, subjects were classified as zinc deficient if its concentration <65 µg/dl for blood sample which collected in the morning, and <57 µg/dl for blood sample which was collected in the afternoon [37,38]. While the serum ionized-calcium considered as normal if its value ranged 1.22-1.37 mmol/l [39]. As biomarker of vitamin D, the 25-OH vitamin D <20 ng/l or <50 nmol/l regarded as vitamin D deficiency, >30 ng/l or 72 nmol/l was sufficient or normal vitamin D, and 20-30 ng/l or 50-72 nmol/l was vitamin D insufficient [40]. Thyroglobulin concentration which indicated normal iodine level was defined as <10 µg/l [41]. Lastly, the normal range for albumin used in this study was 3.5-5.2g/dl [39].
Statistical analysis
Basic characteristics of the subjects, the difference of inflammation status and nutrient deficiency based on biomarker concentrations by habitual intake of milk were analysed by using chi-square test. Medians of nutrient biomarkers were compared across habitual intake of milk using Kruskal-Wallis test. While Mann Whitney-U test was used in analyzing the difference of nutrient biomarkers median values by nutrient intake adequacy for each group, by nutritional status, and by household socio economic status. A P-value of <0.05 indicated a statistical significance.
Ethical consideration
This study was approved by the Ethical Committee of the Medical School at Gadjah Mada University in Yogyakarta, Indonesia.
RESULTS AND DISCUSSION
Basic characteristics
Out of 249 children 48.6%, 29.3%, and 22.1 % were from GF, SCM, and LM groups respectively. This proportion was comparable with the proportion of the pilot study. Table 1 showed basic characteristics of the subjects and their mothers.
Table 1: Basic characteristics by habitual milk intake among children in urban area of Indonesia, as number and percentages.
|
|
Total (n=249) |
GF* (n=121) |
SCM† (n=73) |
LM‡ (n=55) |
P§ |
|
Child |
|
|
|
|
|
|
Sex |
|
|
|
|
|
|
Boy |
129 (51.8) |
68 (56.2) |
37 (50.7) |
24 (43.6) |
0.29 |
|
Girl |
120 (48.2) |
53 (43.8) |
36 (49.3) |
31 (56.4) |
|
|
Age (months) |
|
|
|
|
|
|
≤48 |
112 (45.0) |
65 (53.7) |
25 (34.2) |
22 (40.0) |
0.02a |
|
>48 |
137 (55.0) |
56 (46.3) |
48 (65.8) |
33 (60.0) |
|
|
Anthropometric nutritional status indices |
|
|
|
|
|
|
Underweight (WAZ <-2SD) |
35 (14.1) |
19 (15.7) |
13 (17.8) |
3 (5.5) |
0.27 |
|
Stunted (HAZ <-2SD) |
41 (16.5) |
22 (18.2) |
14 (19.2) |
5 (9.1) |
0.24 |
|
Wasted (WHZ <-2SD) |
18 (7.2) |
8 (6.6) |
5 (6.8) |
5 (9.1) |
0.97 |
|
Mother |
|
|
|
|
|
|
Age (years) |
|
|
|
|
|
|
20-30 |
105 (42.2) |
43 (35.5) |
35 (47.9) |
27 (49.1) |
0.12 |
|
31-50 |
144 (57.8) |
78 (64.5) |
38 (52.1) |
28 (50.9) |
|
|
Education |
|
|
|
|
|
|
Primary |
30 (12) |
9 (7.4) |
9 (12.3) |
12 (21.8) |
<0.001a |
|
Secondary |
173 (69.5) |
77 (63.6) |
60 (82.2) |
36 (65.5) |
|
|
Secondary + |
46 (18.5) |
35 (28.9) |
4 (5.5) |
7 (12.7) |
|
|
Occupation |
|
|
|
|
|
|
Unemployed (housewife) |
139 (55.8) |
71 (58.7) |
37 (50.7) |
31 (56.4) |
0.55 |
|
Working |
110 (44.2) |
50 (41.3) |
36 (49.3) |
24 (43.6) |
|
|
Household facilities |
|
|
|
|
|
|
Electricity |
249 (100) |
121 (100) |
73 (100) |
55 (100) |
- |
|
Radio/tape recorder |
162 (65.1) |
89 (73.6) |
44 (60.3) |
29 (52.7) |
0.02 a |
|
Television set |
241 (96.8) |
119 (98.3) |
72 (98.6) |
50 (90.9) |
0.02 a |
|
Refrigerator |
119 (47.8) |
74 (61.2) |
26 (35.6) |
19 (34.5) |
<0.001a |
|
Telephone |
241 (96.8) |
118 (97.5) |
72 (98.6) |
51 (92.7) |
0.14 |
|
Computer |
63 (25.3) |
42 (34.7) |
11 (15.1) |
10 (18.2) |
0.004a |
|
Internet connection |
35 (14.1) |
25 (20.7) |
6 (8.2) |
4 (7.3) |
0.02a |
|
Car |
29 (11.6) |
20 (16.5) |
5 (6.8) |
4 (7.3) |
0.07 |
|
Motor bike |
205 (82.3) |
104 (86) |
62 (84.9) |
39 (70.9) |
0.04a |
|
Bicycle |
191 (76.7) |
96 (79.3) |
55 (75.3) |
40 (72.7) |
0.6 |
|
Improved water sources |
222 (89.2) |
114 (94.2) |
64 (87.7) |
44 (80.0) |
0.02a |
|
Improved sanitation facilities |
212 (85.1) |
103 (85.1) |
64 (87.7) |
45 (81.8) |
0.74 |
* Growing-up formula group; † Sweetened condensed milk group; ‡ Less milk group; § Chi-square test; a Significant; Weight-for-age Z-score (WAZ); Height-for-age Z-score (HAZ); Weight-for-height Z-score (WHZ)
Among three mother’s characteristics analysed, only education significantly differed across study groups. The proportion of mothers with high education level (secondary +) from GF group was significantly higher than mothers from SCM or LM groups. Analysis of household facilities characteristics showed that, GF group had significantly higher proportion of household facilities such as, radio/tape recorder, refrigerator, computer, internet connection, motor bike, and improved water sources. Indicating that family with higher socioeconomic status choose GF and on the contrary family with lower socioeconomic status preferred to give their children SCM.
Regarding children’s characteristics, statistical analysis showed that number of boys and girls across study groups were similar. However, age was significantly different across groups. The GF group had the highest proportion of younger age group, and LM group had the highest proportion of older children compared to other groups. Possible methodological reason for this, was a selection bias of sampling strategy. However, in our opinion this was the least likely reason, as explained in the method section, we randomly selected from eligible subjects from age 3-5 years old who participated in the pilot study. On the other hand, this finding could tell us about the different pattern of milk consumption among children according their age. As children get older the parents tend to stop giving them formula milk and turn to SCM or other kinds of milk. Possibly because parents may think that after certain age their children will not need formula milk anymore so they choose other kinds of milk which is less expensive than formula milk.
Prevalence of nutrient deficiencies
Total and by group prevalence of nutrient deficiency based on the biomarkers concentration assessed were presented in Table 3.
Table 3: Nutrient deficiency based on biomarker concentrations by habitual intake of milk groups in preschool children in an urban area of Indonesia as total number and percentages.
|
|
Total (n=249) |
GF* (n=121) |
SCM† (n=73) |
LM‡ (n=55) |
P§ |
|
Anemia (Hb<11g/dl) |
5 (2.0) |
3 (2.4) |
1(1.4) |
1 (1.8) |
0.88 |
|
Ferritin (<12ng/ml)| |
80 (32.1) |
37 (30.1) |
23 (32.9) |
20 (35.7) |
0.77 |
|
Zinc ** |
122 (49.2) |
53 (43.1) |
38 (54.3) |
31 (56.4) |
0.16 |
|
Ionized calcium (<1.22 mmol/l) |
16 (6.4) |
5 (4.1) |
8 (11.4) |
3 (5.4) |
0.19 |
|
25-OH vitamin D insufficiency†† |
90 (36.1) |
49 (39.8) |
24 (34.3) |
17 (30.4) |
0.59 |
|
25-OH vitamin D deficiency † |
158 (63.5) |
73 (59.3) |
46 (65.7) |
39 (69.6) |
0.59 |
|
Iodine (thyroglobulin>10 ng/ml) |
134 (54.3) |
65 (52.8) |
40 (58.0) |
29 (52.7) |
0.77 |
|
Albumin (<3.5 g/dl) |
0 |
0 |
0 |
0 |
- |
§ Chi-square test; | Corrected by inflammation status; ** morning blood sampling (<65µg/dl), afternoon blood sampling (<57 µg/dl); † <50 nmol/l; †† 51-72 nmol/l
Statistical analysis found that there was no difference in nutrient deficiency prevalence across the three groups. All children had albumin level within normal range, but micronutrient deficiencies were found in this study.
Anemia, indicated by low hemoglobin level, was the least prevalent (2%) among our study subjects. However, 32.1% (80 children) had iron deficiency (low corrected serum ferritin) and only 0.4% (1 child) had iron deficiency anemia indicated by both low hemoglobin and corrected ferritin concentration (data not shown). We used corrected serum ferritin concentrations as the indicator of iron deficiency because the use of uncorrected serum ferritin as the indicator of iron deficiency anemia might underestimates the true prevalence due to high prevalence of infection and inflammation [42-46]. The inflammation status of children in this study was mostly reference/ normal (86.3%), late convalescence (8.4%), and incubation (5.2%) (Table 2).
Table 2: Median and interquartile ranges of nutrient biomarkers and inflammation indicators by habitual intake of milk groups in preschool children in an urban area of Indonesia.
|
Total (n=249) |
GF* (n=121) |
SCM† (n=73) |
LM‡ (n=55) |
P value§ |
|||||
|
Median |
IQR |
Median |
IQR |
Median |
IQR |
Median |
IQR |
||
|
Biomarkers |
|
|
|
|
|
|
|
|
|
|
Hemoglobin (g/dl) |
12.73 |
12.13 - 13.26 |
12.70 |
12.02- 13.15 |
12.70 |
12.32-13.20 |
12.86 |
12.22-13.58 |
0.15 |
|
Ferritin (ng/ml)| |
17.03 |
10.42-21.41 |
17.81 |
10.72-21.78 |
16.2 |
11.06-21.34 |
15.56 |
8.82-21.09 |
0.49 |
|
Zinc (µg/dl) |
63.37 |
38.83-91.62 |
79.12 |
44.575-94.12 |
57.84 |
33.85-90.56 |
51.76 |
30.83-84.12 |
0.01* |
|
Ionized calcium (mmol/l) |
1.29 |
1.25-1.32 |
1.3 |
1.26-1.32 |
1.28 |
1.24-1.31 |
1.28 |
1.24-1.32 |
0.03* |
|
25-OH vitamin D (nmol/l) |
47.1 |
40.95-53.60 |
48.4 |
43.35-54.55 |
46.6 |
40.80-51.65 |
45.5 |
36.90-52.10 |
0.01* |
|
Thyroglobulin (ng/ml) |
10.51 |
6.26-15.88 |
10.43 |
6.41-15.36 |
10.52 |
6.19-16.32 |
10.68 |
5.90-16.52 |
0.96 |
|
Albumin (g/dl) |
4.71 |
4.49-4.95 |
4.72 |
4.49-5.02 |
4.71 |
4.46-4.91 |
4.67 |
4.53-4.88 |
0.83 |
|
Inflammation indicators |
|
|
|
|
|
|
|
|
|
|
AGP (µg/ml) |
494.43 |
356.83-690.03 |
497.31 |
348.10-697.31 |
476.65 |
322.49-744.40 |
492.26 |
374.73-623.32 |
0.94 |
|
CRP (mg/l) |
0.494 |
1.25-1.32 |
0.494 |
0.35-0.94 |
0.52 |
0.38-1.00 |
0.474 |
0.31-1.57 |
0.89 |
|
Inflammation status |
n |
% |
n |
% |
n |
% |
n |
% |
P value§ |
|
Reference |
215 |
86.35 |
104 |
86.00 |
64 |
87.70 |
47 |
85.50 |
0.165 |
|
Incubation |
13 |
5.22 |
5 |
4.10 |
2 |
2.70 |
6 |
10.90 |
|
|
Early convalescence |
0 |
0 |
0 |
0 |
0 |
0 |
0 |
0 |
|
|
Late convalescence |
21 |
8.43 |
12 |
9.90 |
7 |
9.60 |
2 |
3.60 |
|
* Growing-up formula group; † Sweetened condensed milk group; ‡ Less milk group; § Kruskal-Wallis test; | Corrected by inflammation status; ¶ Chi square test; a Significant
Without correction of acute phase status, the prevalence of iron deficiency was 31.2%, thus indicating underestimation of iron deficiency (Table 3).
Prevalence of anemia in our population is far lower compared to estimated anemia prevalence among preschool children in Indonesia in 2006, which was 44.5% [35]. However, our finding did not differ quite much compared to anemia (Hb<11g/dl) prevalence of children aged ≤14 in Yogyakarta Province in 2007 (8.7%), and the national prevalence 9,8% [47].
Anemia can be caused by several factors such nutritional deficiencies, including iron, vitamins B-12, B-6, and A, riboflavin, and folic acid, inflammation, chronic disease, hemoglobinopathies and other conditions which cause blood loss or hemolysis (e.g., parasitic infections such as hookworm or malaria) [2]. As mentioned earlier, there was only one case of iron deficiency anemia found in our study, the rest cases of anemia might be caused by other factors. On the other hand, iron deficiency itself seemed to be more prominent problem. It most often occurs as result of inadequate iron intake [6]. Among infant and young child (up to 4 years), low iron content of milk and other preferred food, and also rapid growth rate can cause iron deficiency. According to WHO criteria, the prevalence of anemia <4.9% is not a public health problem [48]. However, we could expect the increasing prevalence of iron deficiency anemia if we did not address this high iron deficiency problem immediately as iron deficiency (low ferritin) is only the earliest sign of iron depletion and when the deficiency is severe enough it will result in iron deficiency anemia [49].
Prevalence of zinc deficiency in our population (49.2%) that exceeds 20% indicated that zinc deficiency was a health problem in our population. [38]. However, zinc deficiency prevalence in this study was lower than estimated of population at risk for low zinc intake in Southeast Asian region i.e. 71.2% [50]. In addition, our study showed that the prevalence of diarrhea was low (1/249 or 0.4%, data not shown) which was one possible explanation for the medium prevalence of zinc deficiency. Dhingra and coworkers showed that children with low zinc had significant increased risk of days of all illnesses, diarrhea, dysentery, and acute lower respiratory infection and pneumonia episodes by 15%, 22%, 44%, 49%, and 5% respectively [51].
More than half of children (54.3%) had high serum thyroglobulin concentration which indicating iodine deficiency, showing that iodine deficiency was still a community health problem. Yogyakarta City is not an endemic area of iodine deficiency but two mountainous areas surrounding are recognized as endemic area of iodine deficiency. It was likely that migration from these areas to the city was one possible explanation. The government of Indonesia targets at least 90% of households consumes sufficient iodine (>30 ppm) through a program called ‘Universal Salt Iodization’. However, according to a national survey only 62.3% of household members consume sufficient iodized salt, whereas 23.7% insufficient and 14.0% of them are lack of iodized salt distribution [52]. This situation was other possible explanation for high iodine deficiency in our population.
There was no hypercalcemia found in this present study and the prevalence of hypocalcemia was quite low (6.4%). However, this result should be interpreted cautiously because ionized calcium, as part of serum calcium, is well regulated that it usually indicates little about calcium status, but it still can reflect changes in calcium metabolism [6]. The most surprising result of present study was the high prevalence of hypovitaminosis D. Out of 249 subjects, only 1 child (0.4%) had vitamin D sufficiency (normal serum 25-OH vitamin D concentrations), whereas the other 36.1% had vitamin D insufficiency and the rests 63.5% had vitamin D deficiency (Table 3).
Vitamin D could be obtained from food, but very few foods naturally contain vitamin D (such as liver, beef, veal, eggs, and salmon) [6,53], and in our setting consumption of those foods are low, since food the prices are quite expensive. Beside foods, the most important source of vitamin D is from its synthesis in the skin upon exposure to ultraviolet B radiation (UVB) [40,54]. In tropical countries which close to equator line, such as Indonesia, UVB rays are the most intense [54] allowing vitamin D synthesis in the skin throughout the year [53,54]. Therefore, high prevalence of vitamin D deficiency found in this study seems unbelievable, but other studies also have shown high vitamin D deficiency in countries with high exposure to sunlight, including Indonesia [40,54,55].
Possible explanation for this is that even in high sun exposure region, the optimal time period to get enough sunlight for vitamin D synthesis are between 10.00 to 15.00 [53]. During early morning and late afternoon, because of the zenith angle of sunlight is so oblique very little or any vitamin D is produced in skin. Generally, preschool children in urban area of Yogyakarta experience less outdoor activities during daytime with hot environment. It have been shown that less time spent outdoors as well as low socioeconomic situation [56], low milk consumption, vegetarian diet, limitation of supplement use, and low fish intakes [57] are risk factors of vitamin D deficiency
When micronutrients deficiency prevalence compared across study groups, even though the difference was not significant, there were interesting pattern that can be observed. The lowest prevalence of several micronutrient deficiencies (iron, zinc, and vitamin D deficiency) were found in GF group and its highest prevalence found in LM group. While, Iodine deficiency was the highest in SCM group (58%) and the other two groups had similar prevalence. On the other hand, prevalence of vitamin D insufficiency was the highest in GF group (39.8%) and lowest in LM group (30.4%) (Table 3). Generally, this pattern may reflect the benefit of consuming growing-up formula for pre-school children.
Association of biomarker levels, dietary intake, nutritional status and habitual milk intake
Table 2 presents the median concentration of each biomarker by study group. Statistical analysis showed that only median concentration of zinc, ionized calcium and vitamin D were significantly different across study group, or in other words, the concentrations of those biomarkers were associated with children habitual milk intake. Besides, there was similar pattern we can observed from these 3 biomarkers concentrations, GF group had significantly highest median concentration and LM the lowest, even though the median concentration of ionized calcium in SCM and LM groups were relatively same. This results indicated that children who mostly consumed growing-up formula had better zinc, calcium, and vitamin D biomarkers status.
In this study we also analysed associations between several micronutrient dietary intake adequacies with its biomarker concentrations. Regarding dietary intake adequacy, in general, more than 60% of children in the present study showed sufficient intake of macronutrient according EAR of DRI cut-off. While, for micronutrients, only 5.2% of children had inadequate dietary iron intake and 52.6% of the children had insufficient intake of zinc (data not shown). Statistical analysis results, both overall and by study groups, showed that median concentration of hemoglobin and ferritin did not differ between those who had sufficient intake of iron and those who did not. Similar result was observed when zinc median concentration among those with sufficient zinc intake compared to those with insufficient intake (Table 4).
Table 4: Median and interquartile ranges of nutritional biomarkers by levels of nutrient intakes and habitual intake of milk groups in an urban area of Indonesia.
|
Nutrients |
Total (n=249) |
|
GF* (n=121) |
|
SCM† (n=73) |
|
LM‡ (n=55) |
P§ |
||||
|
Median |
IQR |
P# |
Median |
IQR |
P# |
Median |
IQR |
P# |
Median |
IQR |
|
|
|
Hemoglobin (g/dl) |
|
|
|
|
|
|
|
|
|
|
|
|
|
Sufficient iron intake |
12.7 |
12.1-13.2 |
0.69 |
12.7 |
12.0-13.2 |
0.53 |
12.7 |
12.0-13.2 |
0.40 |
12.8 |
12.5-13.6 |
0.98 |
|
Insufficient iron intake |
12.6 |
12.0-13.3 |
12.2 |
12.0-12.6 |
12.1 |
12.0-13.3 |
12.9 |
12.1- a |
||||
|
Ferritin (ng/ml) | |
||||||||||||
|
Sufficient iron intake |
17.0 |
9.7-21.8 |
0.36 |
17.4 |
10.4-21.8 |
0.64 |
15.7 |
11.0-21.1 |
0.15 |
16.0 |
9.1-20.9 |
0.83 |
|
Insufficient iron intake |
18.3 |
16.0-22.5 |
18.3 |
18.3-20.0 |
22.5 |
17.6-22.6 |
14.3 |
8.0- 21.1 |
||||
|
Zinc (µg/dl) |
||||||||||||
|
Sufficient zinc intake |
62.9 |
38.3-91.5 |
0.64 |
76.1 |
44.5-92.5 |
0.75 |
58.5 |
33.8-89.6 |
0.90 |
49.0 |
30.9-80.1 |
0.16 |
|
Insufficient zinc intake |
94.4 |
54.7-99.0 |
96.2 |
94.4-99.0 |
38.9 |
33.8-117.2 |
90.4 |
65.6-96.2 |
||||
* Growing-up formula group; † Sweetened condensed milk group; ‡ Less milk group; § Mann-Whitney U-test; | Corrected by inflammation status
This finding shows that dietary intake may not directly affect the biomarker levels. Nutrient bioavailability and homeostatic mechanism regulating concentration of biomarker in human body are factors which could influence association of dietary intake and nutrient biomarker level [6,58]. Regarding iron intake, there is no reliable biomarker which can reflect its quantity of dietary intake, mainly due to variation in its bioavailability and large difference between heme iron and inorganic iron in term of absorption [58]. Moreover, iron can be stored in human body, which is reflected by plasma/serum ferritin levels, and unless iron deficiency is severe enough that the iron stores unable to compensate the iron need, hemoglobin level will remain normal [6]. Moreover, it is possible that the low dietary iron intakes observed were only acute, so that it did not correlate to ferritin and hemoglobin levels as iron store still able to provide the iron needs
Similarly, no significant association between zinc intake and serum zinc concentration could be explained by a highly efficient homeostatic mechanisms which maintain serum zinc concentration within normal range even after zinc intakes above or below requirement are consumed [37,58]. When the zinc intakes fall, this homeostatic mechanism will increase zinc absorption and reduce losses via the gastrointestinal tract and kidneys [59]. However, serum zinc concentrations may change under circumstances of prolonged inadequate or excessive dietary zinc intake [37]. Besides, it was likely that zinc intake in our population was moderately restricted. In a population where zinc intake is moderately restricted among those who are previously adequately nourished serum zinc concentrations remain unchanged or slightly decreased just slightly after more prolonged episode of exposure to restricted diet [38].
The anthropometric assessment of nutritional status showed that more than 80% of children in our study had normal WAZ, HAZ, and, WHZ status. The prevalence of underweight, stunted, and wasted were 14.1%, 16.5%, 7.2% respectively. In addition there were no significant differences in nutritional status across study groups (Table 1).
Further, the association of biomarker concentration and nutritional status were analysed. We found that thyroglobulin level significantly higher among underweight children (12.0; 95%CI 10.0-17.0) compared to children who did not underweight (10.0; 95% CI 6.1-15.4). While for zinc those who stunted have higher concentration of zinc (81.9; 95% CI 51.8-95.1) compared to children who did not stunted (61.6; 95% CI 36.4-91.4) while the rest biomarkers’ concentration did not differ by nutritional status (Table 5).
Table 5: Median and interquartile ranges of nutrient biomarkers by nutritional status in preschool children in an urban area of Indonesia.
|
|
Underweight* |
Stunted† |
Wasted‡ |
||||||
|
|
No (n=214) |
Yes (n=35) |
P§ |
No (n=208) |
Yes (n=41) |
P§ |
No (n=231) |
Yes (n=18) |
P§ |
|
Hemoglobin (g/dl) |
12.8 (12.1-13.3) |
12.4 (12.1-13.0) |
0.07 |
12.8 (12.1-13.3) |
12.6 (12.1-13.1) |
0.31 |
12.7 (12.1-13.3) |
12.4 (12.0-12.8) |
0.07 |
|
Ferritin (ng/ml) | |
17.2 (10.8-21.3) |
18.8 (8.2-22.4) |
0.99 |
16.9 (10.2-21.3) |
17.6 (11.1-21.4) |
0.65 |
17.0 (10.8-21.3) |
17.1 (8.0-22.6) |
0.96 |
|
Zinc (µg/dl) |
62.8 (38.8-91.5) |
79.9 (39.5-97.1) |
0.35 |
61.6 (36.4-91.4) |
81.9 (51.8-95.1) |
0.02a |
65.2 (38.9-91.6) |
50.1 (34.6-83.6) |
0.42 |
|
Ionized calcium (mmol/l) |
1.29 (1.25-1.32) |
1.29 (1.26-1.32) |
0.88 |
1.29 (1.24-1.32) |
1.29 (,26-1.32) |
0.87 |
1.29 (1.25-1.32) |
1.29 (1.24-1.31) |
0.61 |
|
25-OH vitamin D (nmol/l) |
47.1 (41.0-53.3) |
45.6 (39.5-55.9) |
0.91 |
47.1 (41.3-53.7) |
45.7 (40.9-51.4) |
0.31 |
47.1 (41.0-53.4) |
46.3 (38.7-56.5) |
0.88 |
|
Thyroglobulin (ng/ml) |
10.0 (6.1-15.4) |
12.0 (10.0-17.0) |
0.03a |
10.5 (6.1-15.7) |
10.5 (8.5-16.4) |
0.35 |
10.3 (6.2-15.5) |
12.8 (9.4-17.0) |
0.23 |
|
Albumin (g/dl) |
4.7 (4.5-5.0) |
4.7 (4.5-4.9) |
0.79 |
4.7 (4.5-5.0) |
4.7 (4.5-4.9) |
0.28 |
4.7 (4.5-4.9) |
4.7 (4.5-5.0) |
0.87 |
* WAZ <-2 SD; † HAZ <-2 SD; ‡ WHZ <-2 SD; § Mann Whitney U-test; | Corrected by inflammation status; a Significant
In our study, both underweight and iodine deficiency (high thyroglobulin level) were more likely the result of inadequate diet including inadequate dietary iodine intake [6,60]. While, severe zinc deficiency in infantile and early childhood has been associated with stunted growth, immune dysfunction, poor wound healing [59], learning, psychomotor and neurobehavioural problems [3]. However, in this study zinc levels was higher among stunted children. As mentioned earlier, serum zinc concentration is well regulated and stunted is one of effect of severe zinc deficiency. Thus it was possible that children who were stunted have already improved their zinc intake, therefore, their serum zinc became higher than those who were not stunted. Moreover, zinc deficiency is not the only risk factor of stunted, deficiency of other nutrient, and other factors such as maternal malnutrition, and infectious diseases, could also result in stunted growth [61].
Habitual milk intake and micronutrient deficiencies
Important findings in this study are that in general, prevalence of iron deficiency (low ferritin), zinc deficiency, iodine deficiency, vitamin D insufficiency and deficiency were high in our population. Indicating the urgent needs to address these problems since micronutriens deficiencies will result in health and growth problems among children [1-5,62]. Present study also showed potential measure to improve micronutrients deficiency through consumption of proper habitual milk intake. Eventhough the prevalence of micronutrient deficiency did not significantly differ across habitual milk intake group, lowest prevalence of iron, zinc, and vitamin D deficiency found in the group of children who mostly consumed growing-up formula, and the highest prevalence of those micronutrients deficiencies found among children who consumed less milk. In addition, the highest prevalence of ionized calcium and iodine deficiencies were found in SCM group (Table 3). Benefit of consuming growingup formula was also shown by significantly higher serum zinc, ionized calcium, and 25-OH vitamin D concentration in GF group. GF Group also had the highest ferritin concentration and lowest thyroglobulin concentration even though the differences were not significant.
In general, milk and milk products are important part of children’s diet as it contains macronutrients and micronutrient such as calcium, magnesium, phosphorus, zinc, potassium, vitamin D, vitamin A, riboflavin, and vitamin B-12, [3,8-1,62,63]. However, there are various type of milk available in the market and their nutritional value may depend on their intended use. Sweetened condensed milk is milk product which contains 44% of sugar which mainly used as cooking ingredient [64] hence it is not suitable for feeding young children [65]. While, growingup formula or growing-up milk is a liquid food, part of weaning diet, after the breastfeeding stop, usually from aged 12 months onward [66], or for children aged 12-36 months [62,67]. In this study, the subjects were children aged 36-59 months and in Indonesia, consumption of growing -up milk among children aged above 3 years old are common since there are a lot of growing -up milk products for children aged 3 until 12 years old available in the market.
There is no legal definition or regulated composition criteria of growing-up formula [62,66,67], but in general it contains low protein and added with minerals and vitamins [62], which intended to fulfill the nutritional requirements of young children [67]. This nutrients composition is the most likely explanation why in our study GF group had better micronutrient profile, in term of its deficiency prevalence and its biomarker concentration, compared to SCM group and group who consumed less milk. Scientific evidence of the advantages of consuming growingup formula are very rare [67]. However, a literature review concluded that consumption of growing-up formula which contains balanced nutrition and do not contains sweeteners and taste improvers will increase iron, zinc and vitamin D intake hence will fulfill dietary requirements , especially for children whose dietary habits do not meet the recommended dietary intakes [62]. On the other hand, SCM may contribute to energy and sugar intake but fewer nutrients [8]. Until recently, studies that investigate the effect of SCM on children nutritional status are scarce. However, consumption of SCM as substitution of milk without adequate micronutrient intake from food may lead to micronutrient deficiency and the high sugar content of SCM may increase the risk of obesity among children.
STRENGTHS AND LIMITATIONS
Strength of our study is the use of Inafood to analyze nutrient intakes which was designed specifically for local foods. It has been validated and showed comparable precision with manual analysis and the International Mini List. Besides, three days of 24- hour recalls are sufficient to yield valid data of nutrient intakes. However, there was potential effect of recall bias in dietary intake estimates.
Use of field laboratory in preparing the blood samples before further process in the present study is another strength. The field laboratory with standardized procedures could prevent the problem of delay before the blood samples could be analysed in the laboratory. Further, we selected randomly the study subjects using multiple cluster random sampling. Therefore, our study is representative for Yogyakarta City. Major limitation of this present study is the study design. We performed a cross-sectional study that cannot summarize any causality.
CONCLUSION
Around a third to a half of children indicated deficiencies in iron, zinc, iodine, and vitamin D. Children from GF group had significantly highest serum zinc, ionized calcium and, 25- OH vitamin D concentrations compared to SCM and LM groups. Micronutrient deficiencies (iron, zinc, iodine, vitamin D) were still prevalent among preschool children in our population. Children in GF group in general had lower prevalence of micronutrient deficiency and better nutrient biomarker concentration.
Micronutrient deficiencies have negative impact on child health therefore there is urgent need to address micronutrient deficiency in Yogyakarta. Balanced dietary intake for preschool children should be promoted and consumption of appropriate type of milk for pre-school children should be encouraged to help in fulfilling their nutrients requirements, which growing-up formula as possible option.
ACKNOWLEDGMENTS
This study was funded by PT Sarihusada Tbk and Danone. We would like to acknowledge the following for their support to the study: Rio Jati Kusuma and Kurniawan Satria Denta (research assistants); Th. Ninuk Sri Hartini, Muhammad Arifin, and Isti Ristanto (nutrition team); Nur Rohmah, Dyah Kumalasari, Sunari Asih and Agung Wijayanto (Laboratorium Klinik Prodia staffs), Budi Lestari, Ida Darojatun, Bambang Subagya, Dwi Nuhriyadi, Yuenleni, Yuswibowo Suryo, and Tri Putro (staffs of the Biochemistry Laboratory of the Medical School Gadjah Mada University); Maya Indriati, Annisa Lady Umoro, and Sunardi (administrative personnel). We thank the field workers who collected data and conducted field activities (Wulan Trisnaningsih, Nurlina Ratnawati, Bety Wahyu Hapsari, Zhafir Thiara Thiurmila, Astari Puruhita, Alfi Fairuz Asna, Savira Evia, Slamet Sunaryo, Siska Puspita Sari, Farida Nur Isnaeni, and Sri Kadaryati). The authors also appreciate Professor Jacques Bindle, dr. Tonny Sundjaya, Laksmi Murti, and Armita D. Kusuma for providing scientific materials and critical review of the study results and interpretation of the data; Professor Yati Soenarto (consultant), and Professor Mohammad Juffrie (the Head of the Department of Child Health, Medical School, Gadjah Mada University, Yogyakarta, Indonesia). We would like to acknowledge the Ethics Committee of the Medical School, Universitas Gadjah Mada and Dr. Sardjito Hospital Yogyakarta that approved the ethical clearance of this study.
EPP conceptualized and designed the study, designed and validated the data collection questionnaires, coordinated data collection, performed data acquisition and analyses, interpreted data analysis, drafted the initial manuscript, and approved the final manuscript as submitted, SKL coordinated and supervised data collection, contributed to the acquisition and analysis data, critically reviewed the manuscript, and approved the final manuscript as submitted. NN and MNS contributed to development of concept and design of the study, data interpretation, critically reviewed the manuscript, and approved the final manuscript as submitted. Authors declare no conflict of interest.
REFERENCES
3. Nriagu J. Zinc deficiency in human health. Encyclopedia Environ Health. 2010: 789-800.
5. Zimmermann MB1. Iodine deficiency. Endocr Rev. 2009; 30: 376-408.
6. Gropper S, Smith J. Advanced Nutrition and Human Metabolism: Cengage Learning; 2008.
17. Sugito FS, Djoharnas H, Darwita RR. Relationship between breastfeeding and early childhood caries (ECC) severity of children under three years old in DKI Jakarta. Makara of Health. 2008; 12: 87- 92.
20. BPS-Statistics of Yogyakarta City and Regional Government of Yogyakarta City. Yogyakarta in figure. Yogyakarta BPS-Statistics of Yogyakarta City; 2009.
21. WHO. Module C: Interpreting growth indicators WHO child growth standards: training course on child growth assessment Geneva: WHO; 2008.
22. Hartini TNS, Dibley M, Serdula M, Sadjimin T. Sistem analisis data konsumsi makanan metode recall 24 jam yang lalu (Analysis system of 24-hour recall food consumption data). Gizi Indon. 2004; 27: 35-43.
25. Health Canada. Dietary reference intakes 2010 [cited 2012 2 April].
26. DiaSys Diagnostic Systems GmbH. Albumin FS * [lab manual]. Germany. 2006.
29. DRG International Inc. DRG® CRP, HS (C-Reactive Protein) [lab manual]. USA. 2010.
30. DRG International Inc. DRG® Ferritin ELISA [lab manual]. USA. 2010.
32. Perking Elmer Inc. Analytical methods for atomic absorption spectroscopy [lab manual]. USA. 1996.
33. R&D Systems I. Quantikine® ELISA: Human a1-Acid Glycoprotein Immunoassay [lab manual]. USA. 2010.
39. Soldin SJ, Brugnara C, Wong EC. Pediatric Reference Ranges. 4th ed: AACC Press. 2003.
40. Holick MF. Vitamin D deficiency. N Engl J Med. 2007; 357: 266-281.
52. Siswono. Konsumsi garam yodium untuk semua (Universal salt iodization) [cited 2012 27 April]. 2010.
58. Hambidge M. Biomarkers of trace mineral intake and status. J Nutr. 2003; 133 Suppl 3: 948-955.
60. Zimmermann MB. Methods to assess iron and iodine status. Br J Nutr. 2008; 99 Suppl 3: 2-9.
64. Mcwilliams M. Nutrition and Dietetics. 8th ed. Philippine: Rex Bookstore. Inc. 2007.


