Extraction, Isolation and Identification of Rutin from Ruta chalepensis L. Cultivated in Tunisia by Fractional solubilization
- 1. Laboratory of Animal Ecophysiology, Faculty of Sciences of Sfax, University of Sfax, Tunisia
- 2. Plateforme RMN-RPE, UFR Sciences et Techniques, University of Western Brittany, France
- 3. Enzyme Bioconversion Unit (UR13ES74), National School of Engineering of Sfax, Sfax University, Tunisia
- 4. Laboratory of Electrochemistry and Environment, National School of Engineers of Sfax, University of Sfax - Tunisia
Abstract
The biological screening of the various Ruta chalepensis L. extracts through several in vitro antioxidant assays, including DPPH radical scavenging, scavenging activity of ABTS radical cation, reducing power and quantification of the total antioxidant capacity identified the MeOH60 fraction (F6) as having antioxidant properties, suggesting strong therapeutic potential. This fraction was therefore chosen for the structural identification of chemical compounds composing it. 2D NMR analyses allowed for the complete characterization of its primary compound, which was identified as nearly pure rutin. Rutin was isolated as a yellow powder, whose molecular formula C27H30O16 was deduced through the analysis of mass spectrometry data (m/z = 611 [M+H]+). This compound exhibits two adsorption maxima at λmax = 264 and 353 nm. HPLC, IR and UV data further confirm that rutin is the predominant component in fraction 6.
Keywords
• Antioxidant activity
• 1H NMR
• Rutin
• Ruta chalepensis L
citation
Kacem M, Simon G, Kacem I, Mansour AB, Chaabouni S, et al. (2026) Extraction, Isolation and Identification of Rutin from Ruta chalepensis L. Cultivated in Tunisia by Fractional solubilization. J Hum Nutr Food Sci 11(1): 1204
INTRODUCTION
Ruta chalepensis L., locally called ‘ruda’ or ‘rue’ is a plant of the family Rutaceae. The small shrub, distributed in temperate and tropical countries, was introduced in America following Spanish colonization [1]. R. chalepensis has been traditionally used in many countries for the treatment various diseases [2]. Regarding its composition, Hnatyszyn et al. [3], reported that the leaves and young stems contain alkaloids, flavonoids, phenols, amino acids, furocoumarins, saponins and essential oils. Flavonoids, a major class of natural polyphenolic compounds emanating from 2-phenylchromane, are generally found in numerous plants, vegetables and flowers [4]. Flavonoids are among the most abundant natural products in plants, with over 9000 distinct compounds occurring as both free aglycons and glycosides [5]. On the structure level, they are divided into various classes of molecules, including flavones, flavonols, flavanones, catechins, anthocyanidins, isoflavones, dihydroflavonols and chalcones [6].
In recent years, both natural and synthetic flavonoids have been utilized in modern medicine for a wide range of therapeutic applications, including anti-inflammatory and antioxidant activities [7], metal chelation [8,9], inhibition of lipid peroxidation and antiproliferative, anticarcinogenic, antibabacterial, anti-inflammatory, antialergic and antiviral effects [10-13]. Rutin, the rhamnoglucoside of the flavonoids quercetin, is found in several plants and used for the treatment of diverse vascular diseases [14].
In previous research work, Kacem et al. [15], have shown that the ethanol extract of the aerial part of Ruta chalepensis L. has a potent antioxidant activity, adequate to prevent the oxidative stress induced by sepsis obtained by the peritonitis model (cecal ligature and puncture (CLP)). Indeed, this extract inhibits lipid peroxidation and stimulates antioxidant enzymes activities such as SOD, CAT and GPx, consequently attenuating kidney and liver dysfunction. Similarly, Kacem et al. [16], have reported that Ruta chalepensis L. ethanol extract inhibits the secretion of NO inflammatory mediator, suppresses the expression of iNOS and COX-2 genes through the inhibition of NF-κB activation, and protects against oxidant stress in RAW 264.7 macrophage cells stimulated with LPS.
In another study, the authors have shown that the ethanol extract of Ruta chalepensis L. displays the most powerful antioxidant and antibacterial activities and that the protective effect observed in previous studies exhibited by the ethanol extract of Ruta chalepensis L. could be accredited to the existence of phenolic compounds. Moreover, rutin is confirmed to be the main antioxidant compound of the ethanol extract of the aerial part of Ruta chalepensis L. [17].
The utmost goal of this study is to extract, isolate and identify the rutin from Ruta chalepensis L., molecule bioactive playing an important role in the antioxidant activity of ethanolic extract of Ruta chalepensis L. observed in vivo and in vitro by fractional solubilization.
MATERIALS AND METHODS
Chemicals
All chemicals, reagents and solvents used for the experiments are analytical grade.
Plant Material
Aerial parts (stem and leaves) of Ruta chalepensis L., generally called Ruda were collected in March 2011 in Chebba region, Tunisia, and identified by Prof. Mohamed Chaieb (Department of Botany, Faculty of Sciences, University of Sfax, Tunisia), according to the Flora of Tunisia [18,19]. A voucher specimen with reference MK1-2013 was deposited at the herbarium of the Department of Biology, Faculty of Sciences, Sfax (Tunisia).
Extractions and Fractionation
An amount of 40 g of the powder plant material was extracted by maceration in 300 mL of EtOH 95% at ambient temperature for 48 h. The resulting solution was then filtered, and the solvents were subsequently
vacuum evaporated at 40°C, yielding the ethanol extract of Ruta chalepensis L. (A).The EtOH extract was diluted in MeOH and subsequently extracted with hexane. After concentration, this process yielded a MeOH extract (C) and a hexane extract (B), the latter of which was discarded. The MeOH extract (C) was then diluted with water (H2O) and extracted with ethyl acetate (EtOAc). After concentration, this produced an aqueous extract (E) and an EtOAc extract (D), the latter of which was also eliminated. An amount of 300 mg of aqueous extract (E) was were fractionated on a C18 silica gel (5 g) using a sequential elution with 20 mL of H2O (F1), MeOH 10% (F2), MeOH 20% (F3), MeOH 30% (F4), MeOH 40% (F5), MeOH60% (F6), MeOH 80% (F7) and MeOH 100% (F8). Afterwards, the obtained solutions were concentrated by rotary evaporation under vacuum at 40°C. The fractions were then stored at a temperature of -4°C until use.
DPPH Radical Scavenging Activity Assay
The antioxidant activity of the extracts (A, B, C, D and E) and fractions (F1 to F8) was assessed based on their hydrogen donating or radical scavenging abilities using the stable radical 1.1-diphenyl-2-picrylhydrazyl (DPPH), following the method of Kirby and Schmidt [20]. In brief, 1 mL of various concentrations (0.06-1.0 mg.mL-1) of the extracts in methanol was mixed with 1 mL of 4% (w/v) DPPH radical solution in methanol. The mixture was energetically shaken and left at ambient temperature in the dark for 30 minutes. The measurement of the absorbance of samples and control solutions was conducted at 517 nm against a blank, and the percentage DPPH free radical inhibition (I %) was calculated in following way:
I% = 100 × (Acontrol-Asample)/Acontrol
where Acontrol is the absorbance of the control reaction (containing all reagents except the test compound) and Asample is the absorbance of the test compound.
It is trusty to mention that the ascorbic acid was used as a control.
Reducing Power
The reducing power of the extracts was evaluated following the Oyaizu method [21]. Extract samples (0.125, 0.25, 0.5 mg.mL-1) were combined with 1 mL of 200 mM sodium phosphate buffer (pH 6.6) and 1 mL of 1% potassium ferricyanide [K3Fe(CN)6], then incubated at 50°C for 20 min. Next, 1 mL of 10% Trichloroacetic acid was added, and the mixture was centrifuged at 3000 rpm/min for 10 min. The upper layer (1.5 mL) was mixed with 1.5 mL of deionized water and 0.1 mL of 0.1% ferric chloride
(FeCl3). The absorbance was measured at 700 nm against a blank, with ascorbic acid serving as reference standard.
Total Antioxidant Capacities (TCA)
The crude extracts’ total antioxidant capacities (TCA) were evaluated using Prieto et al. [22], phosphomolybdenum technique. The sample’s reduction of Mo (VI) to Mo (V) and the subsequent formation of a green phosphate/Mo (V) complex at an acidic pH are the basis for this assay. One milliliter of the reagent solution (0.6 M sulfuric acid, 28 mM sodium phosphate and 4 mM ammonium molybdate) was combined with an aliquot of 0.1 mL of the methanolic sample solution. After being sealed, the tubes were incubated for 90 min at 95°C in a boiling water bath. Samples were allowed to reach room temperature following incubation, and then the test sample’s absorbance was measured at 695 nm against a bank. One milliliter of the reagent solution and the proper volume of the same solvent that was used for the sample were present in the blank. The same incubation conditions were used for the rest of the samples. The antioxidant activity of the samples was measured in milligrams of ascorbic acid equivalents per gram of dry weight.
Scavenging Activity of ABTS Radical Cation
The decrease of the radical cation of 2,2’-azinobis-(3-ethylbenzothiazoline-6-sulfonic acid) (ABTS) by antioxidants measured using the Trolox equivalent antioxidant capacity (TEAC) assay, which was carried out as previously described by Re et al. [23]. To put it briefly, ABTS was dissolved in water to a concentration of 7 mM, then potassium persulfate was added to the mixture to form the ABTS radical cation (ABTS+) at a final concentration of 2.45 mM. Before usage, the radical generation was obtained in the dark at ambient temperature for 12-16
h. To get the absorbance at 734 nm to be 0.70 ±0.02 for the present research work, it was diluted with ethanol. For 45 seconds, 1 mL of the ABTS+ solution and 100 µl of antioxidant solution were mixed for the photometric test. After 5 min, a measurement was taken at 734 nm with methanol serving as the blank. Five distinct concentrations of the compound were tested, all of which fell under the dose–response curve’ linear range. A calibration curve was created using varying Trolox concentrations (0-20 µM). Trolox concentration in millimolars was used to express the results.
NMR Experiments
Nuclear magnetic resonance (NMR) experiments were conducted on a Bruker AVANCE 500 spectrometer, equipped with an inverse 5 mm TCI 1H/13C/15N
cryoprobe. The samples were dissolved in MeOD, CDCl3 or D2O based on their polarity. The NMR spectra were then phase-shifted, baseline-corrected and calibrated (TSP at 0.0 ppm). The spectra were acquired using a 30° pulse, with a 2-second delay, and the temperature was maintained at 25°C throughout the experiment.
Spectrophotometric Analysis
Infrared spectrum of isolated rutin (by fractionation and precipitation) was recorded using PerkinElmer spectrum 100 FT-IR spectrometer.
Isolated rutin (by fractionation and precipitation) was dissolved in water and UV absorption spectrum was recorded and compared with standard rutin (using M550 Double Beam Scanning UV/Visible Spectrophotometer).
LC–MS/MS analysis
The methodology used was an analytical LC–UV–MS/MS study, following Kite et al. [24]. In summary, the analytical work involved chromatography on a Phenomenex Luna C18 (2) column (150 × 4.6 mm i.d., 5 µm particle size) with a linear mobile phase gradient of 1 mL/min of 20–50% aq. MeOH (containing 1% AcOH) in 30 min. Thermo Scientific ‘LCQ Classic’ ion trap mass spectrometer equipped with an ESI source was used to record mass spectra. Together with Finnigan MAT900 XLT, Thermo Scientific LTQ Orbitrap XL mass spectrometers were used to detect masses accurately in both negative and positive ESI modes.
HPLC Analysis
HPLC analysis of isolated rutin was performed and compared with standard rutin, using Discovery® HS C18 Cat#: 568523-U (25cm× 4.6 mm, 5µm) column and a mixture of methanol: water (70:30 ratio) as a mobile phase with a flow rate of 0.5 mL/min, and identified at 340 nm.
Infrared Spectroscopy (IR)
Infrared spectroscope Equinox 55 (BRUKER, Billerica, MA, USA) at the range of 4000-700 cm-1 was applied to determine the structure of the isolated rutin.
Statistical analysis
The results were expressed as mean ± standard deviation (SD) of three measurements for the analytical determination. Significant differences between the values of all parameters were determined at p<0.05 according to the one-way ANOVA: Student Newman-Keuls test, using SPSS Statistics 17.0 for Windows (SPSS Inc., 2008). Correlation and regression analyses were carried out using EXCEL program (Microsoft corporation, USA).
RESULTS AND DISCUSSION
In recent decades, very powerful methods have been developed to elucidate the composition of a crude extract and purify one of these constituents [25-28]. These methods generally use chromatographic (TLC, HPLC) and spectroscopic (NMR, MS) techniques. More recently, bioguidance has been developed to enable the isolation of active compounds from an extract. This approach consists of fractionating an active crude extract and testing each of the fractions (see subfractions) resulting from it until the active molecule is isolated [28,29]. Furthermore, it should be noted that in the case of a complex extract, the molecules can interact, be rearranged and their structure modified according to the polarity of the solvent, which leads to a decrease in their biological activity in the mixture [30]. Amarowicz et al. [25], have thus demonstrated that the total antioxidant activity of the of crude extract fractions was significantly higher than that of the extract itself, indicating that separating an extract into multiple fractions often enhances the expression of its biological activity [28].
Antioxidant activity of the different extracts and fractions of Ruta chalepensis L.
DPPH reduction
A series of extractions (B, C, D and E) from the EtOH95% extract (A) was carried out, followed by the fractionation of extract E into fractions (F1 to F8). At each stage, the 1H NMR spectra were recorded
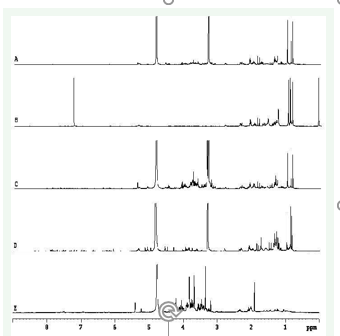
Figure 1 500 MHz 1H NMR spectra of EtOH95 extract and its extracts of Ruta chalepensis L. A: crude EtOH95 extract; B: hexane extract of EtOH95 extract; C: MeOH extract of EtOH95 extract; D: EtOAc extract of MeOH extract of EtOH95 extract; E: aqueous extract of MeOH extract of EtOH95 extract.

Figure 2 The DPPH free radical-scavenging of Ruta chalepensis L. fractions at different concentrations (µg/mL) expressed as percentages of inhibition (%), versus the positive control (ascorbic acid). Each value represents the mean ± SD of two experiments.
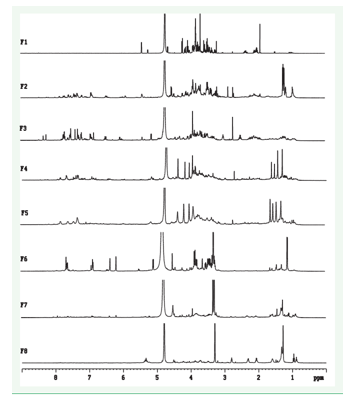
Figure 3 500 MHz 1H NMR spectra of fractionation of the aqueous extract of MeOH extract of Ruta chalepensis EtOH95 extract. Elution with water (F1), MeOH10 (F2), MeOH20 (F3), MeOH30 (F4), MeOH40 (F5), MeOH60 (F6), MeOH80 (F7) and MeOH (F8).
The capacity of the different extracts (A, B, C, D and E) and fractions (F1 to F8) to give an electron or a hydrogen atom to free radicals was measured using the bleaching of 1.1-diphenyl-2-picrylhydrazyl (DPPH). DPPH is a stable violet radical with maximum absorbance at 517 nm, which can accept an electron or a hydrogen atom, forming a stable and non-radical pale-yellow diphenylpicrylhydrazine molecule [31,32], which causes the absorbance decrease at 517 nm. The efficacies of antioxidants are often associated with their ability to scavenge stable free radicals [33]. Indeed, the reaction between the antioxidant and DPPH typically involves the transfer of a hydrogen atom. However, kinetic data suggests that an electron transfer mechanism may also be involved [34,35]. The progress of the reaction depends on the ability of antioxidants present in the extract to give hydrogen [36]. The ability of molecules present in the extracts to provide a hydrogen atom to free radicals is very important since it allows them to inhibit or delay initiating free radical chain reactions and interrupt the spread of the autoxidation converting peroxyl radicals and alkyl compounds to less stable radical [37]. This prevents the reactive radical species to achieve the biomolecules in food and biological systems, such as lipoproteins, polyunsaturated fatty acids, DNA, amino acids, proteins and sugars [38]. The Anti-radical activity of different extracts (A, B, C, D and E) and different fractions (F1 to F8) of the 95% ethanol extract of Ruta chalepensis L. are presented in Figure 2 and Table 1.
Table 1: The evaluation of the IC50 values in the DPPH free radical-scavenging of Ruta chalepensis L. fractions. Ascorbic acid was used as standard
|
Sample |
DPPHa (IC50 ) (µg/mL) |
|
Ethanol |
150±0.01 |
|
Hexane extract of ETOH95 |
>200 |
|
MeOH extract of ETOH95 |
140±0.00 |
|
ETOAC extract of MeOH |
150±0.01 |
|
Aqueous extract of MeOH |
80±0.00 |
|
Water (F1) |
>200 |
|
MeOH10(F2) |
200±0.00 |
|
MeOH20 (F3) |
70±0.00 |
|
MeOH30 (F4) |
75±0.01 |
|
MeOH40 (F5) |
50±0.00 |
|
MeOH 60 (F6) |
30±0.00 |
|
MeOH80 (F7) |
100±0.00 |
|
MeOH (F8) |
>200 |
|
Ascorbic acid |
32.5±3.54 |
a Each value represents the means ± SD of two experiments.
The representative 1H NMR spectrum of the 95% ethanol extract of Ruta chalepensis L. is presented in Figure
1. The NMR signals in the aromatic region (6.0-8.0 ppm) were found to be smaller than those in the aliphatic region (0.5-3.3 ppm) and the sugar region (3.3-6.0 ppm). The effective concentration of the 95% ethanol extract of Ruta chalepensis at which 50% of DPPH radicals were reduced (IC50) was calculated graphically (IC50= 150±0.01 µg.mL1).
The initial step involved diluting the EtOH 95% extract in MeOH and extracting it with hexane. The 1H NMR
spectrum of the hexane extract (B) indicates that lipids represent the predominant organic compounds (0.5-3.3 ppm) and that the test DPPH exhibits minimal radical scavenging activity (IC50>200 µg.mL-1). Consequently, the NMR spectrum of the methanol phase (C) exhibits diminished peaks in the aliphatic region (0.5-3.3 ppm) and elevated aromatic and sugar signals (3.3-8.0 ppm). The DPPH test indicates that the anti-radical activity remains largely consistent with that of the crude EtOH 95% extract (IC50 = 140 ± 0.00 µg.mL-1). Therefore, the hexane phase allows for the removal of a portion of the lipids present in the Ruta chalepensis EtOH 95% extract, while the compounds responsible for its anti-radical activity remain in the MeOH phase.
Subsequently, the MeOH extract (C) was diluted in H2O and extracted with EtOAc. Significant discrepancies were evident between the corresponding 1H NMR spectra. Indeed, the 1H NMR spectrum of the aqueous phase (E) reveals the presence of carbohydrates, observed between
3.3 and 6.0 ppm. Furthermore, the spectra display a minimal presence of aromatic (6.0-8.0 ppm) and aliphatic (0.5-3.3 ppm) signals. However, the 1H NMR spectrum of the EtOAc phase (D) displays augmented aromatic signals (6.0-8.0 ppm) and diminished carbohydrate signals (0.5-3.3 ppm). It is trusty to note that despite the presence of numerous aromatic signals in the EtOAc extract, the aqueous extract (E) exhibits superior anti-radical activity compared to the EtOAc extract (D) (IC50 = 80 ±0.00 vs 150-1 Ruta chalepensis L. fractions. Ascorbic acid was used as standard ±0.01 µg.mL )
|
Sample |
DPPHa (IC50 ) (µg/mL) |
|
Ethanol |
150±0.01 |
|
Hexane extract of ETOH95 |
>200 |
|
MeOH extract of ETOH95 |
140±0.00 |
|
ETOAC extract of MeOH |
150±0.01 |
|
Aqueous extract of MeOH |
80±0.00 |
|
Water (F1) |
>200 |
|
MeOH10(F2) |
200±0.00 |
|
MeOH20 (F3) |
70±0.00 |
|
MeOH30 (F4) |
75±0.01 |
|
MeOH40 (F5) |
50±0.00 |
|
MeOH 60 (F6) |
30±0.00 |
|
MeOH80 (F7) |
100±0.00 |
|
MeOH (F8) |
>200 |
|
Ascorbic acid |
32.5±3.54 |
. a Each value represents the means ± SD of two experiments.
1. The NMR signals in the aromatic region (6.0-8.0 ppm) were found to be smaller than those in the aliphatic region (0.5-3.3 ppm) and the sugar region (3.3-6.0 ppm). The effective concentration of the 95% ethanol extract of Ruta chalepensis at which 50% of DPPH radicals were reduced (IC50) was calculated graphically (IC50= 150±0.01 µg.mL1).
The initial step involved diluting the EtOH 95% extract in MeOH and extracting it with hexane. The 1H NMR Because the aqueous extract exhibited the highest antioxidant activity (IC50 = 80 ± 0.00 µg.mL-1), our subsequent investigation was interested in this extract. To identify the compound(s) responsible for the anti-radical activity of Ruta chalepensis EtOH95% extract, we fractionated the aqueous extract using a C18 silica gel column. The 1H NMR spectra obtained for each fraction are presented in Figure 3.
The 1H NMR spectra demonstrate the presence of carbohydrate signals (3.3-6.0 ppm) for F1, primarily aromatic and carbohydrate signals (3.3-8.0 ppm) for F2 to F6, and predominantly aliphatic signals (0.5-3.3 ppm) for F7 and F8. These observations align with the results of the DPPH test, which indicate that F1 to F6 exhibit enhanced anti-radical activity, while F7 and F8 demonstrate minimal anti-radical activity [Figure 2, Table 1]. The separation of the aqueous phase enables the isolation of a highly potent anti-radical agent, namely F6 fraction, with an IC50 value of 30 µg.mL-1.
Reducing power ability
The antioxidant activity of different extracts (A, B, C, D and E) and different fractions (F1 to F8) of Ruta chalepensis L. was determined using the reducing power assay. This method is generally used for evaluating the ability of the antioxidant to reduce an oxidant by donationg an electron [39]. The presence of reducing agents in plant extracts causes the reduction of ferric ion (Fe3+) of potassium ferricyanide to ferrous ion (Fe2+) to form the potassium ferrocyanide. The latter reacts with ferric chloride (FeCl3 ) to form a complex Fe3+-Fe2+ which has a maximum absorbance at 700 nm [40,41]. At a concentration of 500 µg/mL, the reducing powers of the various extracts (A, B, C) were ranked as follows: MeOH extract of ETOH95% (0.255±0.0025)> Ethanol 95% (0.2205±0.005)> Hexane extract (0.088±0.003). After diluting the MeOH extract of EtOH95% extract (C) in H2O and extracting with EtOAc, we found that the strongest activity of the reducing power was exhibited by the EtOAc extract of MeOH (D) (0.308±0.004). This is followed by aqueous extract of MeOH (0.166±0.007). After fractionating the aqueous on C18 silica gel column, to extract the active molecules present in this phase, it was revealed that the highest activity of the reducing power was exhibited by the MeOH60 (F6) 1.205±0.0065. This is followed by MeOH80 (F7)1.197±0.0055, MeOH30 (F4) (1.109±0.028), MeOH20 (F3) 0.848±0.027, MeOH40 (F5) 0.667±0.01, MeOH10 (F2) 0.303±0.014, MeOH (F8) 0.168±0.008 and Water (F1) 0.162±0.0025 (Table 2)
Table 2: Reducing power (absorbance at 700 nm) of different fractions and phases of Ruta chalepensis L. at different concentrations a.
|
Sample |
Sample concentration (mg.mL-1) |
||
|
|
0.125 |
0.25 |
0.5 |
|
Ethanol 95% |
0.035±0.0016a; x |
0.094±0.0040a; y |
0.2205±0.005a; z |
|
Hexane extract of ETOH95 |
0.065±0.0005b; x |
0.085±0.0005a; y |
0.088±0.003b; z |
|
MeOH extract of ETOH95 |
0.075±0.003c; x |
0.137±0.006b; y |
0.255±0.0025c; z |
|
ETOAC extract of MeOH |
0.116±0.005d; x |
0.177±0.007c; y |
0.308±0.004d; z |
|
Aqueous extract of MeOH |
0.053±0.002e; x |
0.118±0.004d; y |
0.166±0.007e; z |
|
Water (F1) |
0.070±0.003c; x |
0.098±0.004a,e; y |
0.162±0.0025e; z |
|
MeOH10(F2) |
0.116±0.003d; x |
0.198±0.005f; y |
0.303±0.014f; z |
|
MeOH20 (F3) |
0.281±0.012f; x |
0.498±0.005g; y |
0.848±0.027g; z |
|
MeOH30 (F4) |
0.495±0.02g; x |
0.810±0.0185h; y |
1.109±0.028h; z |
|
MeOH40 (F5) |
0.249±0.012h; x |
0.374±0.004i; y |
0.667±0.01i; z |
|
MeOH 60 (F6) |
0.569±0.001i; x |
0.941±0.04j; y |
1.205±0.0065j; z |
|
MeOH80 (F7) |
0.338±0.0165j; x |
0.672±0.01k; y |
1.197±0.0055k; z |
|
MeOH (F8) |
0.055±0.002k; x |
0.089±0.0015a; y |
0.168±0.008e; z |
|
Ascorbic acid |
0.388±0.0010l; x |
0.688±0.0200l; y |
0.7795±0.0370g; z |
Each value represents the mean of three determinations (n=3) and three independent experiments. Different lower-case letters (a,b,...,n) within the same column indicate significant differences (p<0.05) between the samples in the same concentration. Different lower-case letters (x, y, z) within the same line indicate significant differences (p<0.05) for each solvent.
The reducing properties are generally associated with the presence of reductones in the sample. The antioxidant action of reductones emanates from their ability to terminate the free radical chain by donating a hydrogen atom [42].
Total antioxidant capacities (TCA)
The total antioxidant capacities (TCA) of the different phases and fractions of 95% ethanol extract of Ruta chalepensis L. was determined spectrophotometrically through phosphomolybdenum method, which is based on the reduction of Mo (IV) to Mo (V) by the sample analyte and the subsequent formation of green phosphate/Mo (V) compounds with a maximum absorption at 695 nm. The total antioxidant capacities (TCA) of the tested fractions was compared to those of ascorbic acid, used as positive control. The results of the total antioxidant capacity of the different fractions and phases of the ethanol95% extract of the aerial parts of Ruta chalepensis L. indicate a large variability(Figure 4).
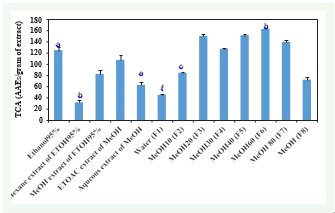
Figure 4:Antioxidant capacity of the phases and fractions of Ruta chalepensis L. by phosphomolybdenum method. Each value represents the mean of three determinations (n=3) and three independent experiments. Different lowercase letters (a, b, .., m) indicate significant differences (p <0.05) for different solvents.
Indeed, the crude EtOH95% extract of Ruta chalepensis L. presents a TCA of the order of 123.85±6.1 AAEs/gram of extract. After washing with hexane of the crude ethanol extract diluted in methanol, we observed that activity of the MeOH extract (81.70±4.05 AAEs/gram of extract) was higher than that of the hexane extract (31.29 ±1.5 AAEs/gram of extract). Then, MeOH extract of EtOH95% extract (C) was diluted in H2O and extracted with EtOAc. After concentration, this process yielded an aqueous extract of MeOH extract of EtOH95% extract (E) and EtOAc extract of MeOH extract of EtOH95% extract (D), the latter of which was eliminated. Furthermore, the total antioxidant capacity of EtOAc extract (106.60±5.73 AAEs/gram of extract) was proven to be higher than the aqueous phase (62.18±3.01AAEs/ gram of extract). To extract the most active fraction from the aqueous phase, we fractionated it on C18, yielding eight fractions. We have shown maximum capacity for the fraction F6 (161.40±1.96 AAEs/gram of extract), medium for fractions MeOH20 (F3) (149±2.13 AAEs/ gram of extract), MeOH30 (F4) (126.42±0.65 AAEs/gram of extract) and MeOH 40 (F5) (150.45±1.94 AAEs/gram of extract) and very low for water (F1), MeOH10 (F2) and MeOH (F8) (respectively 44.67±1.35, 83.72±0.69 and 71.63± 2.75 AAES/gram of extract).
ABTS (2, 2, azonobis 3, ethylene benzothiazoline-6 sulphonic acid) radical scavenging assay
By reacting with potassium persulfate, ABTS produces ABTS radical cation (ABTS+), which is a blue green chromogen with maximum absorption at 734 nm. The extent of decolorization is a significant indicator of the sample’s antioxidant activity. Indeed, the antioxidants’ reaction on ABTS radical cation is due to its hydrogen donating availability, visually observed by the transformation of color radical cation (ABTS+) into colorless ABTS. The obtained results for the ABTS radical scavenging assay of the different fractions and phases of the ethanol 95% extract of the aerial parts of Ruta chalepensis L. showed a large variability [Figure 5].
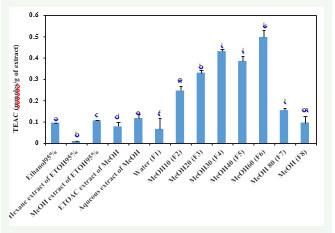
Figure 5 The ABTS radical scavenging of the phases and fractions of Ruta chalepensis L. Each value represents the mean ± SD of two experiments.Each value represents the mean of three determinations (n=3) and three independent experiments. Different lowercase letters (a, b, .., m) indicate significant differences (p <0.05) for different solvent.
Actually, the crude EtOH95% extract of Ruta chalepensis L. (A) presents an ABTS radical scavenging capacity of the order of 0.095 ± 0.00 mmol/gram of extract. After separating the extract with hexane and MeOH, we found that while MeOH extract (C) possessed the highest ABTS scavenging capacity (0.106±0.00 mmol/gram of extract), hexane extract (B) showed the lowest ABTS scavenging activity (0.01 ± 0.00 mmol/gram of extract). To further increase the scavenging capacity of ABTS radical, we separated MeOH extract of EtOH 95% extract (C) with H2 O and EtOAc. It can clearly be seen that the aqueous extract (E) has a more elevated capacity of ABTS radical scavenging (0.117±0.004 mmol/ gram of extract) than that of the EtOAc extract (D) (0.078 ± 0.003 mmol/gram of extract). We, therefore, fractionated
the aqueous extract (E) on C18 gel with H2O, MeOH10%, MeOH 20%, MeOH 30%, MeOH 40%, MeOH 60%, MeOH
80% and MeOH 100% elutions to specify the main fraction of this extract, offering the most elevated antioxidant capacity of ABTS+. It was revealed that even though the antioxidant capacity varied from one fraction to another, F6 fraction presented the most elevated ABTS radical scavenging capacity (0.497 ± 0.03 mmol/gram of extract). This result further suggests that the antioxidant capacity of the aqueous extract of MeOH extract of EtOH 95% extract
(E) originates essentially from the F6 fraction. This capacity is followed in increasing order by: MeOH30 (F4) (0.431± 0.01mmol/gram of extract)> MeOH40 (F5) (0.385±0.018 mmol/gram of extract)> MeOH20 (F3) (0.33±0.01mmol/ gram of extract)> MeOH10 (F2) (0.246±0.011 mmol/gram of extract)> MeOH80 (F7) (0.154±0.005 mmol/gram of extract) >MeOH (F8) (0.096±0.003mmol/gram of extract)> water (F1) (0.066±0.003 mmol/gram of extract).
Despite the similarity of the working mechanism of the ABTS method for the assessment of antioxidant activity and that of DPPH method, the latter is proven to be more reliable than DPPH method due to the solubility of ABTS reagent as compared to DPPH method [43]. For this reason, ABTS assay is better than DPPH assay when applied to a variety of plant foods containing hydrophilic, lipophilic, and high-pigmented antioxidant compounds [44].
Identification of rutin
The combination of 1D 1H and 13C NMR spectroscopy with 2D COSY 1H/1H, HMQC 1H/13C and HMBC 1H/13C NMR of the F6 fraction revealed that the predominant compound in this fraction was rutin (quercetin-3-O-rutinoside) [Figure 6].

Figure 6 Chemical structure of rutin (quercetin-3-O-rutinoside)
The chemical shifts of rutin in MeOD given below are in line with those reported in the literature [45].
1H NMR chemical shifts for rutin (CD3OD, 500 MHz): δ = 1.11 (3H, d, 3JHH=6.5 Hz, CH3-6’’’), 3.25-3.45 (3H, m, H-3’’, H-4’’, H-5’’), 3.30 (1H, m, H-4’’’), 3.45 (1H, m, H-5’’’),
3.47 (1H, m, H-2’’), 3.53 (1H, dd, 3JHH=9.5 Hz,4JHH=3.5Hz, H-3’’’), 3.62 (1H, m, H-2’’’), 3.79 (1H, d, 3JHH=10.0Hz, H-6’’), 4.51 (d, 1H, 3JHH=1.0 Hz, H-1’’’), 5.09 (1H, d,3JHH=8.0 Hz, H1’’), 6.19 (1H, d,4JHH=2.0 Hz, H-8), 6.38(1H, d, 4JHH=2.0 Hz, H-6), 6.86 (1H, d, 3JHH=8.5 Hz, H-5’),7.62 (1H, dd, 3JHH=8.5 Hz, 4JHH=2.0 Hz, H-6’), 7.65 (1H, d,4JHH=2.0 Hz, H-2’).
13C NMR chemical shifts for rutin (CD3OD, 125 MHz): δ = 17.9 (C-6’’’), 68.6 (C-6’’), 69.7 (C-5’’’), 71.3 (C-4’’), 72.0 (C 3’’’), 72.2 (C-2’’’), 73.9 (C-4’’’), 75.7 (C2’’), 77.2 (C3’’), 77.8 (C5’’), 95.1 (C-8), 100.3 (C-6), 102.4 (C-1’’’), 104.8 (C-1’’), 05.2 (C-10), 116.1 (C-5’), 117.6 (C-2’), 123.1 (C-1’), 123.5 (C-6’), 135.6 (C-3), 145.9 (C-3’), 149.9 (C-4’), 158.5 (C-5), 159.1 (C-2), 162.9 (C-5), 167.0 (C-7), 172.9 (C-4).
HPLC, UV and mass spectrometry analysis confirmed NMR characterization of rutin
Characterization of rutin the isolated in fraction F6 by ultraviolet (UV)
The ultraviolet spectrum of isolated rutin and standard showed similar absorption bands at 264 and 353 nm (Figure 7).
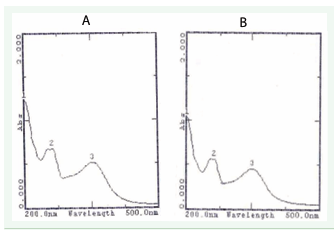
Figure 7 Spectrum of rutin: rutin obtained by fractionation (A) compared by standard rutin (B).
Characterization of rutin isolated in fraction F6 by HPlC
The chromatograms of the standard rutin and rutin isolated in fraction 6 (F6) of the ethanol extract of Ruta chalepensis L. present the same peak at the retention time tR= 6 min [Figure 8].
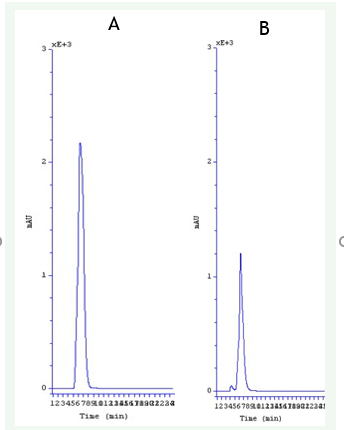
Figure 8 HPLC Chromatograms HPLC of rutin molecule (A) and fraction 6 of ethanol extract of Ruta chalepensis L. (B), made in the same experimental conditions.
Characterization of rutin the isolated in fraction F6 by mass spectrometry
The mass spectrum obtained for fraction 6 of the ethanol extract of Ruta chalepensis L. displayed characteristic fragments at m/z = 611, 465 and 303. While the first peak at m/z = 611 corresponds to the molecular ion [M+H] + and the second one at m/z represents the major fragment. Based on these data and comparison with the standard compound, the presence of rutin was confirmed in fraction 6 [Figure 9].
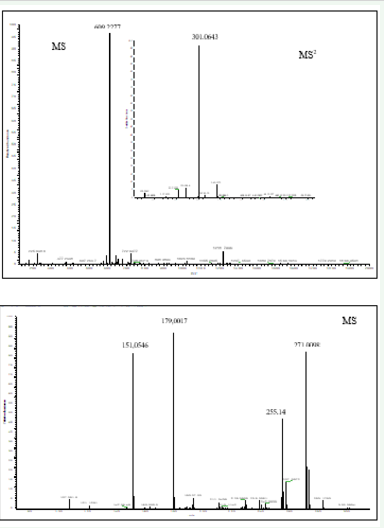
Figure 9 Masse spectrum of the isolated rutin in fraction F6
Characterization of rutin isolated in fraction F6 by infrared (IR)
The IR spectrum of isolated rutin showed a broad band (3600-3000 cm-1) corresponding to hydroxyl groups (OH group bound), the band at 2900 cm-1 can be attributed to the presence of Csp3-H (CH3 or CH2) bond, the band at 1715 cm-1 indicates the presence of carbonyl group (C=O). The bands between 1638 and 1484 cm-1 may be due to C=C bonds of an aromatic ring, the bands between 1433 and 1368 cm-1 to Csp3-H (CH3 or CH2) bond deformations and the bands present between 1300 and 1000 cm-1 to C-O bond while the bands below 900 cm-1 indicate the deformation of aromatic Csp2-H bonds. Finally, the distinct band at 829 cm-1 indicates the presence of α-D-glucoside linkage [Figure 10].
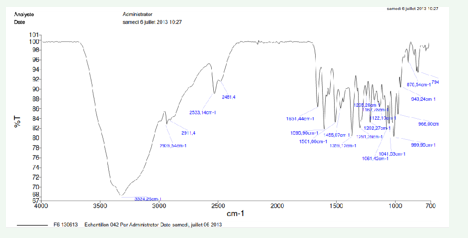
Figure 10 Infrared (IR) spectrum of rutin isolated from fraction F6
CONCLUSION
These results clearly show that rutin is the main active compound of the MeOH60 fraction (F6) of the ethanol extract of the aerial part of Ruta chalepensis L.
ACKNOWLEDGEMENTS
The authors would like to thank the Ministry of Higher Education and Scientific Research, Tunisia for the support of this research work. They also wish to extend their thanks to Mrs. Leila Mahfoudhi, an English teacher at the Sfax Faculty of Science, for editing and proofreading the manuscript
REFERENCES
- Al-Majmaie S, Nahar L, Sharples GP, Wadi K, Sarker SD. Isolation and antimicrobial activity of rutin and its derivatives from Ruta chalepensis (Rutaceae) growing in Iraq. Rec Nat Prod. 2019; 13: 64-70.
- Iauk L, Mangano K, Rapisarda A, Ragusa S, Maiolino L, Musumeci R, et al. Protection against murine endotoxemia by treatment with Ruta chalepensis L., a plant with anti-inflammatory properties. J Ethnopharmacol. 2004; 90: 267-272.
- Hnatyszyn O, Arenas P, Moreno AR, Rondita R, Coussio JD. Estudio fitoquímico preliminar de plantas medicinales paraguayas. I. Plantas reguladoras de la fecundidad según la medicina folklórica. Rev Soc Cient Parag. 1974; 14: 23-57.
- Lisa MS, Rahman RA, Mandana B, Jinap S, Rahmat A, Zaidul ISM, et al. Supercritical carbon dioxide extraction of bioactive flavonoid from Strobilanthes crispus (Pecah Kaca). Food Bioprod process. 2010; 88: 319-326.
- Martens S, Mithöfer A. Flavones and flavone synthases. Phytochem. 2005; 66: 2399-2407.
- Crozier A, Jaganath IB, Clifford MN. Dietary phenolics: chemistry, bioavailability and effects on health. Nat Prod Rep. 2009; 26: 1001-1043.
- Tian XJ, Yang XW, Yang X, Wang K. Studies of intestinal permeability of 36 flavonoids using Caco-2 cell monolayer model. Int J Pharm. 2009; 367: 58-64.
- Heim KE, Tagliaferro AR, Bobilya DJ. Flavonoid antioxidants: chemistry, metabolism and structure-activity relationship. J Nutr Biochem. 2002; 13: 572-584.
- Seyoum A, Asres K, El-Fiky FK. Structure-radical scavenging activity relationships of flavonoids. Phytochem. 2006; 67: 2058-2070.
- Merken HM, Beecher GR. Liquid chromatographic method for the separation and quantification of prominent flavonoid aglycones. J Chromatogr A. 2000; 897: 177-184.
- Ajila CM, Rao LJ, Rao UJS. Characterization of bioactive compounds from raw and ripe Mangifera indica L. peel extracts. Food Chem Toxicol. 2010; 48: 3406-3411.
- Abraham LCN, Masakuni T, Isao H, Hajime T. Antioxidant flavonoid glycosides from the leaves of Ficus pumila L. Food Chem. 2008; 109: 415-420.
- Barreca D, Bellocco E, Caristi C, Leuzzi U, Gattuso G. Distribution of C- and O-glycosyl flavonoids, (3-Hydroxy-3-methylglutaryl) glycosyl flavanones and furocoumarins in Citrus aurantium L. juice. Food Chem. 2011; 124: 576-582.
- Toker G, Turkoz S, Erdemoglu N. High performance liquid chromatographic analysis of rutin in some Turkish plants II. J Chem Soc Pak. 1998; 20: 240-243.
- Kacem M, Simon G, Elleuch A, Makni Ayadi F, Boudawara T, Elfeki A. Protective effect of Ruta chalepensis L. extract on oxidative stress and liver-kidney function induced by polymicrobial sepsis in rats. JAC. 2014; 10: 2146-2161
- Kacem M, Simon G, Leschiera R, Misery L, Elfeki A, Lebonvallet N. Antioxidant and anti-inflammatory effects of Ruta chalepensis L. extracts on LPS-stimulated RAW 264.7 cells. In Vitro cell Dev Biol-Animal. 2014; 51: 128-141.
- Kacem M, Kacem I, Simon G, Ben Mansour A, Chaabouni S, Elfeki A, et al. Phytochemicals and biological activities of Ruta chalepensis L. growing in Tunisia. Food Biosci. 2015; 12: 73-83.
- Chaieb M, Boukhris M. Flore Succinct et Illustré des Zones Arides et Sahariennes de Tunisie. 1998; 49: 43-44.
- Pottier-Alaptite G. Flore de la Tunisie, Angiosperme-dicotylédones Apétales- Dialypetales. Imprimerie officielle de la Republique Tunisienne. 1979; 291-293.
- Kirby AJ, Schmidt RJ. The antioxidant activity of Chinese herbs for eczema and of placebo herbs. J Ethnopharmacol. 1997; 56: 103-108.
- Oyaizu M. Studies on products of browning reaction: antioxidative activities of products of browning reaction prepared from glucosamine. Japan J Nutr Diet. 1986; 44: 307-316.
- Prieto P, Pineda M, Aguilar M. Spectrophotometric quantitation of antioxidant capacity through the formation of a phosphomolybdenum complex: specific application to the determination of vitamin E. Anal Biochem. 1999; 269: 337-341.
- Re R, Pellegrini N, Proteggente A, Pannala A, Yang M, Rice-EvansC. Antioxidant activity applying an improved ABTS radical cation decolorization assay. Free Radic Biol Med. 1999; 26: 1231-1237.
- Kite GC, Stoneham CA, Veitch NC. Flavonol tetraglycosides and other constituents from leaves of Styphnolobium japonicum (Leguminosae) and related taxa. Phytochem. 2007; 68: 1407-1416.
- Amarowicz R, Estrella I, Hernández T, Robredo S, Troszynska A, Kosinska A, et al. Free radical-scavenging capacity, antioxidant activity, and phenolic composition of green lentil (Lens culinaris). Food Chem. 2010; 121: 705-711.
- Meot-Duros L, Cérantola S, Talarmin H, Le Meur C, Le Floch G, Magné C. New antibacterial and cytotoxic activities of falcarindiol isolated in Crithmum maritimum L. leaf extract. Food Chem Toxicol. 2010; 48: 553-557.
- Falleh H, Oueslati S, Guyot S, Dali BA, Magné C, Abdelly C, et al. LC/ ESIMS/MS characterisation of procyanidins and propelargonidins responsible for the strong antioxidant activity of the edible halophyte Mesembryanthemum edule L. Food Chem. 2011; 127: 1732-1738.
- Martinez-Correaa HA, Magalhães PM, Queiroga CL, Peixoto CA, Oliveira AL, Cabral FA. Extracts from pitanga (Eugenia uniflora L.) leaves: Influence of extraction process on antioxidant properties and yield of phenolic compounds. J Supercrit Fluids. 2011; 55: 998-1006.
- Myjavcovà R, Marhol P, Kren V, Simànek V, Ulrichovà J, Palikovà I, et al. Analysis of anthocyanin pigments in Lonicera (Caerulea) extracts using chromatographic fractionation followed by microcolumn liquid chromatography–mass spectrometry. J Chromatogr A. 2010; 1217: 7932-7941.
- Sokol-Letowska A, Oszmianski J, Wojdylo A. Antioxidant activity of the phenolic compounds of hawthorn, pine- and skullcap. Food Chem. 2007; 103: 853-859.
- Naik GH, Priyadarsini KI, Satav JG, Banavalikar MM, Sohoni DP, Biyani MK, et al. Comparative antioxidant activity of individual herbal components used in Ayurvedic medicine. Phytochem. 2003; 63: 97-104.
- Laskar RA, Sk I, Roy N, Begum NA. Antioxidant activity of Indian propolis and its chemical constituents. Food Chem. 2010; 122: 233-237.
- Krishnaraju AV, Rao CV, Rao TVN, Reddy KN, Trimurtulu G. In vitro and In vivo antioxidant activity of Aphanamixis polystachya Bark. Am J Infect Dis. 2009; 5: 60-67.
- Foti MC, Daquino C, Geraci C. Electron-transfer reaction of cinnamic acids and their methyl esters with the DPPH radical in alcoholic solutions. J Organ Chem. 2004; 69: 2309-2314.
- Huang D, Ou B; Prior RL. The chemistry behind antioxidant capacity assays. J Agric Food Chem. 2005; 53:1841-1856.
- Bondet V, Brand-Williams W, Bereset C. Kinetics and mechanisms of antioxidant activity using the DPPH free radical methods. LWT- Food Sci Technol. 1997; 30: 609-615.
- Reische DW, Lillard DA, Eitenmiller RR. Antioxidants. In: Akoh C.C., Min D.B. (edit.). Food lipids: chemistry, nutrition, and biotechnology. CRC Press, 3ème édition, USA, 2008; 409-433.
- Halliwell B, Aeschbach R, Löliger J, Aruoma OI. The characterization of Antioxidants. Food Chem Toxicol. 1995; 33: 601-617.
- Yildirim A, Mavi A, Kara AA. Determination of antioxidant and antimicrobial activities of Rumex crispus L. extracts. J Agric Food Chem. 2001; 49: 4083-4089.
- Lakshmi Devi S, Kannappan S, Anuradha CV. Evaluation of in vitro antioxidant activity of Indian bay leaf, Cinnamomum tamala (Buch-Ham) T. Nees and Eberm using rat brain synaptosomes as model system. Indian J Exp Biol. 2007; 45: 778-784.
- Chung YC, Chang CT, Chao WW, Lin CF, Chou ST. Antioxidative activity and safety of the 50 ethanolic extract from red bean fermented by Bacillus subtilis IMR-NK1. J Agric Food Chem. 2002; 50: 2454-2458.
- Gordan MH. Food antioxidants.London/New York: Elsevier. 1990; 1-18
- Teow CC, Truong VD, McFeeters RF, Thompson RL, Pecota KV, Yencho GC. Antioxidant activities, phenolic and β-carotene contents of sweet patato genotypes with varying flesh colours. Food Chem. 2007; 103: 829-838.
- Floegel A, Kim DO, Chung SJ, Koo SI, Chun OK. Comparison of ABTS/ DPPH assays to measure antioxidant capacity in popular antioxidant-rich US foods. J Food Camp Anal. 2011; 24: 1043-1048.
- Sintayehu B, Asres K, Raghavendra Y. Radical scavenging activities of the leaf extracts and a flavonoid glycoside isolated from Cineraria abyssinica Sch. Bip. Exa. Rich. J App Pharm Sci. 2012; 02: 44-49.