Functional Biscuit with Detarium microcarpum Fruit
- 1. Department of Food Science and Nutrition
- 2. Department of Food Science and Nutrition
- 3. Department of Biological Sciences
- 4. Department of Food Science and Nutrition
- 5. Department of Food Science and Nutrition
- 6. Department of Biological Sciences
Abstract
Background:
Biscuits are the most consumed bakery products globally due to the fact that they are ready to eat, have a reasonable cost, available in different flavors and has an extended shelf life and are consumed by all age groups worldwide. Therefore, there is an interest to produce functional biscuits using functional ingredients. Fruits of D. microcarpum contains functional properties with high natural antioxidant components which can help to reduce oxidative stress. However, it is less used, so its incorporation with other flours in processing of baked products such as biscuits can be considered. This work aimed to valorize fruits of D. microcarpum in biscuits production.
Methods:
Formulations were developed. physicochemical caracteristics, antioxidants activities and sensory analysis of the biscuits incorporated with D. microcarpum pulp powder were evaluated.
Results:
A total of 13 formulations were developed. In a global sense, increase in fruit powder proportion implies an increase in the nutritional quality of the biscuits and in the antioxidant activity of the biscuits. On the contrary, increase in proportion of fruit powder into the biscuit formulation leads to a decrease in sensory attributes and consumer acceptance of the biscuits. The mean sensory scores revealed a statistical difference between samples.
Conclusion:
This study revealed that D. microcarpum pulp can be incorporated in the production of biscuits and that antioxidant activity increases with an increase in fruit powder. Considering the highest antioxidant activity, the sensory analysis and Principal component analyses, it appears that the most appreciated biscuit was B1 with 31.25% wheat flour, 12.50 sugar and 56.25% D. microcarpum powder.
Keywords
Detarium microcarpum, Functional biscuit , Antioxidant, Acceptability
Citation
Josiane NMT, Ghawel NA, Chantal MB, Christian FG, Patrick YY, et al. (2023) Functional Biscuit with Detarium microcarpum Fruit. J Hum Nutr Food Sci 11(2): 1162.
INTRODUCTION
Detarium microcarpum is a wild fruit that grows in the arid sub Saharan Africa commonly known as sweet data. This fruit is rich in phenolic components, flavonoids, vitamin C, magnesium, phosphorus, iron and dietary fibers [1,2]. The consumption of this fruit which is rich in antioxidants will be a good source of natural antioxidants in the body and can help to neutralize the effect of free radicals preventing cancers and cardiovascular diseases [3]. The fruit of D. microcarpum had the highest total phenolic, flavonoid and antioxidant values between fourteen wild edible fruits from Burkina Faso [1, 4]. The fruit is mostly consumed raw or cooked. The pulp is also transformed traditionally into flour and used for cake, bread, baby food and local beer production [2]. This fruit has been used to produced jam and concentrated juice [5]. Baked products such as bread, breakfast cereals and particularly biscuits can be considered as convenient vehicles for the addition of micronutrients and protein to meet these consumer health demands [6]. Consumers demand of more natural products with not only increased nutritional benefits but with medicinal benefits for prevention of disease [6]. The bakery industry is the most stable in food manufacturing industries. The term biscuits refer to the small bread leavened with baking powder or soda and covers a large variety of sweet, salted, filled and coated biscuits. Biscuits are eaten by all categories of people across the board all year round [7]. They can be flavored or enriched with fruits, vegetables, cheese, meat, herbs, or spices. It is widely acceptable and consumed by all age and can be eaten at all times as a result of its relatively long shelf-life, and its convenient due to its wide acceptability by all age groups, it could be considered a good product for antioxidant fortification and other nutritional improvements such as protein, fiber, vitamins and minerals [8,9]. Several investigations have been performed to study the health effects of nutraceutical incorporated bakery products as well as their technological, sensory, and physicochemical properties. There are studies about biscuits enriched with phenolics such as gallic acid [10], or with kiwifruit, apple, which have high phenolic content [11, 12, 13]. Therefore, this study is geared towards incorporating D. microcarpum fruits as a source of antioxidants and other nutrients which could help to neutralize the spectrum of oxidants in the body and help in the prevention of degenerative diseases. The General objective of this study is to valorize in the formulation of an antioxidant functional biscuits.
MATERIAL AND METHODS
Sampling
Dried fruits of D. microcarpum were purchased from the market in Guindi, Mayo-Dallah Division, Mayo-Kebbi West Region of Chad and transported to the Food Biophysics, Biochemistry and Nutrition Laboratory, of the National Advanced School of AgroIndustrial Sciences (ENSAI) of the University of Ngaoundere. The fruits were sorted and cleaned, crushed manually and sieved to separate the pulp from the pits. This pulp was ground to a powder (PDm) using a Retsch electric grinder (grindomix) at 800 rpm and sieved using a 250 µm sieve. The wheat flour, granulated sugar, eggs and margarine used in this study were purchased from the local market in Ngaoundéré.
Biscuits production
For the formulation of biscuits, the recipe used by Miller and Mathew [14], was used with slight modifications on the quantity of egg (2 eggs instead of 1 egg). The quantities of margarine, eggs and baking powder in all preparations were constant that is 125 g, 2 whole eggs, and 10 g respectively. The software Minitab was used to do a mixture design. A simplex centroid mixture with constraints was obtained via the software. This mixture design had three constraints (wheat flour, sugar and sweet data flour), which resulted in nine formulations presented in table 1 below (Table 1).
Table 1: Proportions and quantities of fruit flour, sugar and wheat flour in biscuit formulation
| Samples | Fruit flour | Sugar | Wheat fluor | Codes | |||
| Proportion (%) | Quantity (g) | Proportion (%) | Quantity (g) | Proportion (%) | Quantity (g) | ||
| Biscuit 1 | 56.25 | 286.88 | 12.5 | 63.75 | 31.25 | 158.1 | B1 |
| Biscuit 2 | 65.63 | 334.71 | 18.75 | 95.63 | 15.63 | 79.71 | B2 |
| Biscuit 3 | 53.12 | 270.91 | 6.25 | 31.88 | 40.63 | 207.21 | B3 |
| Biscuit 4 | 75 | 382.5 | 0 | 0 | 25 | 127.5 | B4 |
| Biscuit 5 | 75 | 382.5 | 25 | 127.5 | 0 | 0 | B5 |
| Biscuit 6 | 65.63 | 333.71 | 6.25 | 31.88 | 28.13 | 143.46 | B6 |
| Biscuit 7 | 50 | 225 | 0 | 0 | 50 | 225 | B7 |
| Biscuit 8 | 40.63 | 207.21 | 18.75 | 95.63 | 40.63 | 207.21 | B8 |
| Biscuit 9 | 25 | 127.5 | 25 | 127.5 | 50 | 225 | B9 |
Four other standard biscuit formulations were produced according to Miller and Mathew [14], with slight modifications. These standard biscuits were used to evaluate the effect of wheat flour and/or sugar substitution by D. microcarpum flour on our biscuits. The first one is the normal standard biscuit formulation with just wheat flour and no fruit powder, the other in which wheat is completely substituted by our fruit flour, another in which sugar is substituted by our fruit flour and the last formulation in which both wheat and sugar are substituted by our fruit flour. The sugar content of D. microcarpum is 79.47 g/100g DM. Since for 500 g of dough, 125 g of sugar is required,in order to know the quantity of fruit flour that was required to substitute 125g of sugar. This means that 157.292 g of fruit flour is needed to substitute 125 g of sugar. The proportions and quantities for preparation of 500g of biscuit dough are Shawn in table 2 below (Table 2).
Table 2: Proportions and quantities of fruit flour, sugar and wheat flour in biscuit formulation
All ingredients were measured according to our mixture design using an electronic balance of the mark Sartorius with a sensitivity of 1/1000. The sugar and margarine were creamed until fluffy after which the eggs were then added and mixed until a homogenous and cloudy mixture was obtained. In another vessel, the dry ingredients were sieved and mixed properly. The liquid mixture was then poured into the dry ingredients and kneaded till a homogenous dough was obtained. The dough was then spread on a plane surface using a wooden roller. A biscuit mold was then used to cut the biscuit dough in to desired shapes. The shaped biscuit dough was placed on an oiled baking tray and then baked at 200ºC for 10 minutes. Once baked, the biscuits were cooled at room temperature for 15 minutes and packed in plastic wrappers. They were then placed in large lidded jars for later use.
Determination of the nutritional potential of D. microcarpum powder and biscuits
The water, ash and fat contents were determined using the methods described by AOAC [15], while the nitrogen content was determined by the Kjeldahl method [16], and the colorimetric method of Devani et al [17]. The nitrogen content was converted to protein using the factor 6.25. Carbohydrates were assessed by the differentiation method.
Determination of bioactive compounds
Polyphenol content, the spectrophotometric method using the Folin-Ciocalteu reagent described by Wafa et al., [18] was used for the determination of total polyphenols. The content of flavonoids was determined according to the method described by Mimica-Dukic [19]. The tannins were determined according to the spectrophotometric method using (+) catechin as standard [20].
Evaluation of the anti-oxidant activity in vitro
There are several methods for the determination of anti-radical activity in vitro in food products. In this study, the choice fell on three Methods namely: the free radical test DPPH (2, 2-diphenyl- 1-picrylhydrazyle), ABTS (2,2’azion-bis (3-ethylbenzothizoline-6-sulfonic acid), and Ferric reducing antioxidant power (FRAP).
Preparation of the extract:
The extract was obtained by mixing a mass of 0.1 g of each sample in 10 ml of 70% methanol. It was then stirred for two hours on a magnetic stirrer to homogenize. The resulting mixture was filtered through wattman paper No. 1 and the filtrate was collected for evaluation of the in vitro antioxidant activity by the following methods.
DPPH anti-free radical activity:
The DPPH assay is used to measure the free radical scavenging capacity of the extracts. The DPPH radical scavenging activity was measured according to the protocol described [21]. Indeed, this process is based on the reduction of the synthetic radical 2, 2diphenyl-1-picrylhydrazyl which is a stable radical with a violet coloration. The maximum of its absorption in the visible range is around 515-517 nm caused by the antioxidants. In the presence of the free radical scavengers, the purple DPPH (2, 2-diphenyl-1-picryl hydrazyl) is reduced to the yellow 2, 2 diphenyl-1-picrylhydrazine. Then the IC50 (50% inhibitory concentration) were obtained by graphical determination from the percentages of inhibition as a function of the concentrations obtained by extrapolation from the curve of the percentages of inhibition of the different extracts at different concentrations.
Method using the stable radical ABTS:
The method used is the one described by Re et al. [22]. The ABTS radical method is one of the most widely used tests for the determination of free radical concentration. It is based on the neutralization of a cation radical resulting from the mono-electronic oxidation of the synthetic chromophore ABTS (2, 2’ azino-bis (3- ethylbenzothiazoline -6-sulphonic acid). Method using the FRAP test: Antioxidant activity was assessed by reducing antioxidant power (FRAP). This determined their ability to reduce iron III to iron II [23]. The presence of reducing compounds is indicated by the ability of these extracts to reduce ferric ions (Fe3+) from the ferrocyanide complex to ferrous ions (fe2+). This causes the solution to change the color from yellow to green. This color change is a B function of the reducing power of the sample and its intensity is examined at 700 nm.
Sensory evaluation
As part of our work, 20 panelists [24], were chosen from across the campus on the basis of their frequency of cookie consumption. The sensory evaluation made it possible to assess the perceived sensory characteristics (color, texture, smell, taste, general acceptability) of the different cookies in order to deduce the most appreciated ones. The hedonic test describes the degree of consumer acceptance and satisfaction regarding product attributes and the overall acceptance of a product. Metric scales and ranks were used to quantify the different levels of ratings. The metric grade scales had divisions from 1 to 9 ranging from extreme dislike to extreme like.
Functional properties of D. microcarpum powder and biscuits
Determination of the water absorption capacity of biscuits: It was determined by the method of Phillips et al. [25] which consist of weighing about 1 g of D. microcarpum powder and biscuits in 15 ml centrifuge tubes. Approximately 10 ml of distilled water was added to each tube and mixed thoroughly for 2 min and left at room temperature for 30 min, then centrifuged for 20 min at a centrifugal force of 3000rpm. The pellet was weighed (M2) and oven dried at 105 ± 2°C for 24 hours. The mass of the dry pellet (M1) was then determined. The absorbed water was calculated as water absorption capacity (WAC) according to the following formula: CAE = (M2-M0)/M1×100.
Determination of mass, thickness, density and friability of biscuits: Mass was measured by weighing and thickness by calliper. The quality of dry biscuits is generally assessed by their density, a technological parameter considered to be the best index of the textural properties of biscuits. A low density corresponds to a light biscuit and therefore a high specific volume (V). The density is expressed by the following formula: D = M /V Where D = density of the biscuit (g/cm3); M = mass of the biscuit (g).
Determination of the cracking resistance of biscuits: It was determined by the penetrometric test [26], which consisted of inserting a probe into the biscuit, the force required to reach a certain penetration depth was measured. The following formula was used to convert this into N: 1g = 0.102N.
Statistical Analysis
All samples were analyzed in triplicate and expressed as mean ± standard deviation using EXCEL 2016, and analysis of variance at (p < 0.05) and the Duncan’s classification test was performed using the application software STATGRAPHICS Centurion XVI.I. Sigma plot 12.5 was also used to obtain IC50 for antioxidant activity and to draw graphs.
RESULTS AND DISCUSSION
Nutritional potential and antioxidants of D. microcarpum powder and biscuits
Proximal composition and bioactive compounds of D. microcarpum powder: The results of the proximal analysis of D. microcarpum powder presented in Table 3. Moisture content of foods is very important because biochemical reactions in food depend on the moisture content. The value obtained in this work (10%) is below the maximum 15% moisture required [27], for safe storage of foods, hence it can be stored for long without fear of deterioration. The fruit powder analysed has a lipid content of 2.33%. This value is similar to that obtained by Ngatchic et al. [1], and Abubakar et al [27]. The protein content of the fruit powder is 4.86% is also similar to that found by Abubakar et al [27]. Total phenolics content of pulp of D. microcarpum fruit is higher than the values found by Lamien-Meda et al [4], (4946.67 ± 79.41 mg GAE /100g DW) and near to that found by Ngatchic et al [1] (6710.00 ± 182.00 mg GAE /100g DW). The flavonoids content is similar to that obtained by Lamien-Meda et al. [4] (116.05 ± 3.04 mg EQ / 100gDW) (Table 3).
Table 3: Proximal composition and bioactive contents D. microcarpum pulp
| Elements | Contents |
| Water content (g/100g DW) | 10.30 ± 0.25 |
| Total lipids (g/100g DW) | 2.33 ± 0.01 |
| Total proteins (g/100g DW) | 4.86 ± 0.08 |
| Total ash (g/100g DW) | 3.64 ± 0.02 |
| Total sugars (g/100g DW) | 78.87± 0.03 |
| Total polyphenols (mg EAG/100g DW) | 6620.18 ± 102.13 |
| Tannins (g EC/100g DW) | 1516.55 ± 55.02 |
| Flavonoids (g EQ/100g DW) | 143.56 ± 5.01 |
Proximal composition of biscuits: Table 4 show the proximal composition of differents biscuits. The results for the water content of the biscuits ranged from 5.59 to 14.05%. The water contents increase with the amount of D. mespiliformis powder. This would be due to the water content of the D. microcarpum pulp powder added in he preparation of the biscuits. According to FAO and WHO [28], the water content of certain fried foods should not be higher than 10% ; therefore, all biscuits except SBD, B4 and B7 meet the standard and could be stored for a relatively long time. The highest protein content was observed in the standart biscuits C (39.48 ± 5.07 g/100g DW), and the lowest values were found respectively in the SBA and SBB biscuits (27.31 ± 5.17 g/100g DW; 25.75 ± 5.04 g/100g DW), the lower protein content in theses standards can be explained by the absence of wheat flour in theses formulations (Table 4).
Table 4: Proximal composition of biscuits
| Samples | Water content (g/100g) | Proteins (g/100g) | Lipids (g/100g) | Sugar (g/100g) |
| B1 | 9.69 ± 0.81de | 30.08 ± 5.09a | 20.88± 1.71bcd | 39.355 ± 5.01a |
| B2 | 6.10 ± 2.11ab | 30.04 ± 4.07a | 24.33 ± 1.45a | 41.10 ± 5.05a |
| B3 | 7.10 ± 1.12bc | 31.71 ± 2.25ab | 22.11 ± 0.51cd | 39.08 ± 3.01a |
| B4 | 13.35 ± 0.41g | 31.31 ±20.10ab | 28.33 ± 0.58e | 27.06 ± 3.03b |
| B5 | 7.09 ± 2.28bc | 31.13 ± 2.17a | 26.56 ± 1.07abc | 35.22 ± 3.05a |
| B6 | 5.97 ± 0.79ab | 30.04 ± 4.36a | 24.78 ± 0.19a | 39.21 ± 5.01a |
| B7 | 11.87 ± 1.30fg | 31.05± 4.06ab | 28.22 ± 3.41abc | 28.86 ± 3.03a |
| B8 | 8.94 ± 1.31cd | 31.06 ± 4.10a | 29.78 ± 0.36abc | 30.22 ± 3.15c |
| B9 | 5.59 ± 0.48a | 31.35 ± 3.17ab | 26. 00± 1.20ab | 37.06 ± 3.10a |
| SBA | 10.27 ± 2.09ef | 27.31 ± 5.17ab | 24.78 ± 11.36a | 44.64 ± 5.05a |
| SBB | 6.50 ± 1.12abc | 25.75 ± 5.04ab | 28.78 ± 1.71de | 45.97 ± 5.02a |
| SBC | 6.29 ± 2.32a | 39.48 ± 5.07a | 26.44 ± 0.38abc | 36.79 ± 4.01a |
| SBD | 14.05 ± 0.63g | 30.94 ± 4.03a | 29.00 ± 2.08e | 26.01 ± 3.16b |
Antioxidant activities of D. microcarpum pulp and biscuits: The inhibitory concentration (IC50) (Figure 1), represents the extract or concentration of antioxidant required to inhibit the DPPH radical by half. The IC50 of the different biscuit samples vary significantly (p<0.05) from one sample to another. The highest DPPH anti-radical activity was that of the fruit powder followed by sample B5 and of sample B1, B2 standard SBB. The lowest DPPH anti-radical activity was that of standard formulation SBC (0% fruit powder) followed by sample B9. In a general manner, there is an increase in antioxidant activity with an increase in the percentage of incorporation of D. microcarpum pulp powder. This could be explained by its high content in polyphenols, flavonoids and tannins contained in the pulp of D. microcarpum. The fruit powder has a lower IC50 than all biscuit samples implying heat treatments and reactions have an influence on the antioxidant capacity to inhibit DPPH. Its IC50 is very similar to that of Vitamin C. This is because the pulp of this fruit is very rich in vitamin C, 51.04 ± 0.42mg/100g DW, 55.10 mg/100g [1,27] the RDA requirement for vitamin C is 75 - 90 mg/ day. This shows that the fruit is a very good source of vitamin C. The biscuits have a higher IC50 than the powder which can be due to denaturation of vitamin C at high temperatures (Figure 1)
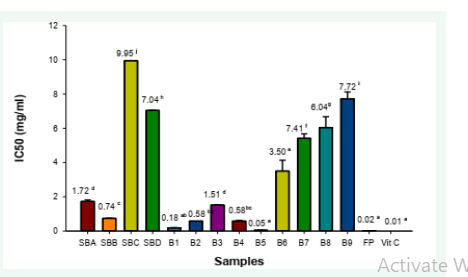
Figure 1: The IC50 of biscuits, fruit powder and vitamin C for DPPH scavenging. Samples having different letters are significantly different (p<0.05).
Concerning ABTS activity, it can be noticed that from figure 2, the IC50 of the samples differ statistically (p<0.05) from one sample to the next. The lowest IC50 value indicates the highest antioxidant activity. Sample B4 and SBB have the highest antioxidant activity while sample SBC and B8 have the lowest antioxidant activity. Samples B4, B5 and SBB have the highest antioxidant activity (2.03, 2.03, 2.07 mg/ml respectively) and are not statistically different (p < 0.05). The lowest antioxidant activity with this test is formulation SBC with an IC50 value of 2.94 mg/ml (Figure 2)
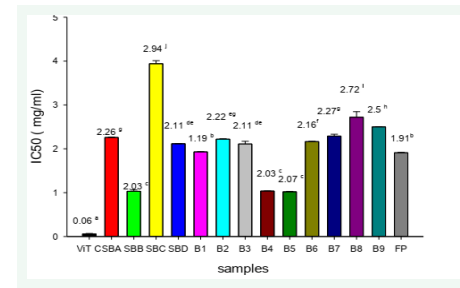
Figure 2: The IC50 of biscuits, fruit powder and vitamin C for ABTS scavenging. Samples having different letters are significantly different (p<0.05).
The reducing power of the biscuits and fruit powder are represented on Figure 3. The values for total reducing power are significantly different (P < 0.05) for the different biscuit samples. From the graph, the standard formulation, SBB (10.57 ± 1.19), has the highest total reducing capacity while the control sample SBC (0% fruit powder) has the least reducing capacity (2.60 ± 0.59). This shows that heat has an effect on the reducing capacity of polyphenols (Figure 3).
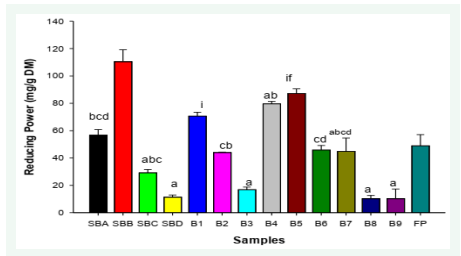
Figure 3: Reducing power of biscuits and fruit powder. Samples having different letters are significantly different (p<0.05).
Physical characteristics of biscuits
The physical characteristics of the biscuits are presented in Table 4
Hardness: The various biscuit hardness values are recorded on Table 4. The values are not statistically different (p <0.05), except for sample SBB (94.00 ± 24.41 N), which is formulated with 100% fruit flour with no sugar. The other biscuit samples were very statistically not different from standard biscuit SBC (46.67 ± 12.06 N). This could be due to the fact that, the powder lacks wheat proteins responsible for extensibility and elasticity (gliadin and glutenin respectively). Sugar inhibits gluten development during dough mixing by competing with the flour for the recipe water, resulting in less tough and crumblier biscuits [29,30]. Increasing the sugar content reduces hardness of the dough [31]
Friability: The friability index is presented on Table 4. For biscuit sample without fruit powder it is 5.10 ± 0.89. The values of the friability index for biscuit samples containing fruit powder ranged from 26.91 ± 1.55 for SBB having 100% of fruit powder with no sugar to 3.98 ± 0.59 for B5 containing 75% powder. The values present a significant difference (p<0.05). There is no significant difference between sample B4 (20.91 ± 1.48), B7 (18.39 ± 1.11) and SBB (26.91 ± 1.55), their high friability can be explained by the absence of the sugar in their formulation.
Water absorption capacity (WAC): The Water absorption capacity is presented on Table 4. The values show a statistically significant difference (p < 0.05) from biscuit mixtures 94.61 ± 26.34 g/100g DM to 276.26 ± 0.77 g/100g DM for samples SBB and B9 respectively. Generally, there is an increase in the WAC of biscuits with increase in sugar content and wheat content. This is the reason why sample B9 has the highest WAC because it has the highest sugar (25 %) and wheat (50 %) percentages in its formulations which have polar bodies that capture water molecules. The capacity of water absorption generally increased with an increase in inclusion compared to the control samples. The increase in water absorption can also be explained by the increase in dry matter of the samples.
Sensory analysis
In terms of aroma, control sample SBC is the most appreciated while sample B4 was the least appreciated, because there was no added sugar to the formulation leading to a rapid rancidity of lipids producing off flavors. With respect to color, sample SBC (no fruit powder) has the most appreciated color followed by sample B9. The least appreciated color is sample B4. The crispiest sample is standard biscuit SBC, followed by B9, then B5 and B6. He least crispy sample is B4. Sample B9 has the most loved taste followed by B5 and B8. Sample B4 is the sample with the least taste followed by standard SBB. Addition of sugar has an effect on the taste and that is why B4 and SBB do not have a good taste according to the panelist (Figure 4).
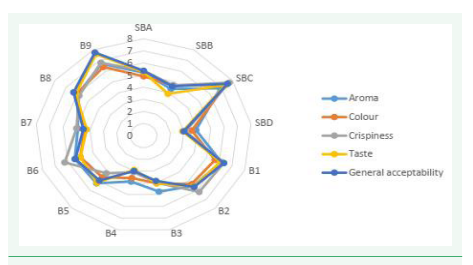
Figure 4: Radar showing sensory analysis of biscuits.
The general acceptability of the biscuit samples is represented in figure 5. In terms of general acceptability, sample SBC was the most accepted, followed by B9, B1, B8, B2, B6, SBA. The sample that was least appreciated generally was B4, SBD. This can be due to the fact that, there was no sugar added in the formulation. The fact that standard SBB was among the least appreciated shows that sugar is important in biscuit formulation (Figure 5).
Figure 5: Diagram showing general acceptability of biscuits
Principal component analyses
Principal component analyses PCA is a dimensionally reduction method that is often used to reduce dimensionality of large dada sets, by transforming a large set of data to a smaller one that still contains majority of the information in the original data. From the figure 6, samples SBB, B1, SBA, B5, B4 have a strong correlation to bioactive components (polyphenols, tannins, flavonoids) and antioxidant activity. Samples SBC, B9, B8, B1, B2 have a higher correlation with sensory attributes. Samples B3, B4, B7 and SBD have a higher correlation to lipids (Figure 6)
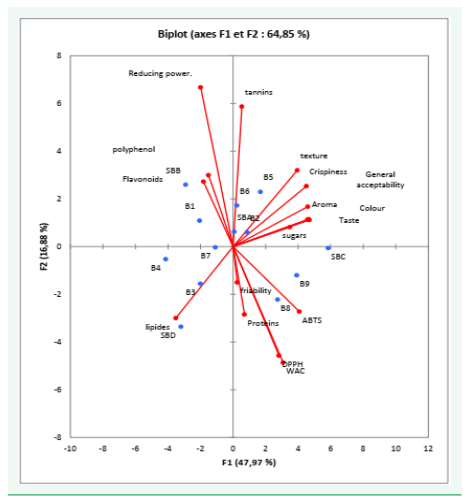
Figure 6: Principal component analyses chart of biscuits.
CONCLUSION
This study showed that biscuits can be produced from D. microcarpum pulp powder. The pulp of D. microcarpum is very rich bioactive compounds. The use of D. microcarpum pulp powder showed significant impact on the final product’s physical properties, macronutrient content, bioactive compounds, antioxidant activity and sensory characteristics of the biscuits produced, which could serve as an anti-stress, hence functional food. In a global sense, increase in fruit powder proportion implies an increase in the nutritional quality of the biscuits and in the antioxidant activity of the biscuits. On the contrary, increase in proportion of fruit powder into the biscuit formulation leads to a decrease in sensory attributes and consumer acceptance of the biscuits. The principal component analysis shows that in terms of bioactive components, SBB, B1, B6 and B5 have the highest phenolic components and antioxidant activity whereas, in terms of general acceptability, SBC, B9 and B1 were the most accepted by panelist. Considering the general acceptability and the antioxidant activity, sample B1 is the optimum.
ACKNOWLEDGEMENTS
The authors acknowledge the technical assistance of the laboratory and the staff from the Department of Food Science and Nutrition of National School of Agro-Industrial Sciences of Ngaoundere University.
REFERENCES
14. Miller RA, Mathew R. Effect of fat and sugar in sugar-snap cookies and evaluation of tests to measure cookie flour quality. Cereal Chemistry. 1985; 62: 124.
19. Mimica-Dukic N. Investigation on secondary biomolecules in some Menthaspecies. Ph.D. Thesis. 1992; University of Novi Sad.
23. Oyaizu M. Studies on products of browning reaction. Japanese J Nutr Diet. 1986; 44: 307-315.
28. FAO/WHO (Food and Agriculture Organisation/World Health Organisation). Cereals, Pulses, Legumes and Plant Protein Products. 2007. p 128.


