Impact of Agrobiodiversity on Nutritional Status: Case of Hadiya Zone Selected Districts, Southern Ethiopia
- 1. Department of Food Science and Postharvest Technology, Wachemo University, Ethiopia
- 2. Department of Natural Resource Management, Wachemo University, Ethiopia
Abstract
This study intended to assess agrobiodiversity of Lemo and Soro districts selected localities, to evaluate demographic and socioeconomic characteristics, to analyze the house hold dietary diversity and to assess the nutritional status of children’s from 6-59 months of age. Sample size determined by using Epi Info 7.0 software, Agrobiodiversity assessed by using FAO guidelines and Anthropometric data collected by the method designed by Gibson. House hold dietary diversity and socioeconomic characteristics data were collected by using semi-structured questionnaires. Three localities of Soro district have showed low agrobiodiversity status and 66.66% of the households recorded low household dietary diversity. On these areas 39.2% of children’s are underweight, 25.5% are stunted as compared with WHO reference standards. Furthermore, 10.8% of the children’s are wasted. On contrary, other three localities have good agrobiodiversity and only 28.4 % of households scored low dietary diversity. The prevalence of underweight, stunting and wasting is 3.9%, 6.7% and 6.9%, respectively. In Lemo district three localities showed poor agrobiodiversity status and household dietary diversity score is also low in 54.9% of households. Underweight, stunting and wasting are evident in 21.6%, 12.7% and 16.9%, respectively. In another way, other three localities demonstrated good agrobiodiversity status and 25.5% of household scored low dietary diversity. Underweight in these areas is 13.7%, stunting is 5.9% and wasting is only 4.2%. In conclusion, household dietary diversity is linked with agrobiodiversity status of the area and affected the nutritional status of children’s aged 6-59 month old. Areas those have relatively poor agrobiodiversity experience low household dietary diversity and high prevalence of stunting, wasting and underweight.
Keywords
- Malnutrition
- Stunting
- Agrobiodiversity
- Wasting
- Underweight
Citation
Urugo MM, Gebreyesus KT (2019) Impact of Agrobiodiversity on Nutritional Status: Case of Hadiya Zone Selected Districts, Southern Ethiopia. J Hum Nutr Food Sci 7(1): 1129.
ABBREVIATIONS
WHZ: Weight for Height; HAZ: Height for age; WAZ: Weight for Age
INTRODUCTION
Agrobiodiversity refers to all crops and animal breeds, their wild relatives, and other species including pollinators, symbionts, pests, parasites, predators, decomposers, and competitors that co-exist and interact within crop lands and or their surrounding environments [1]. Additionally it includes populations of variable and adaptable landraces, as well as wild and weedy relatives, from which the entire ranges of domestic crops are, derived [2]. Components of agro biodiversity include genes, populations, species, communities, ecosystems, and the landscapes in which the agro ecosystems are embedded. Many people’s food and livelihood security depend on the sustained management of various biological resources that are important for food and agriculture. However, in the 21st century, the impact of environmental variability and climate change has significantly affected the livelihoods of the poor and marginal societies in developing countries [3]. The use of environmental resources in order to satisfy the increasing demands of the world’s ever-growing population is undermining the sustainability of the earth’s ecosystem which is critical to our survival and high plant diversity within agricultural plots can yield higher production levels than systems with low plant diversity [4].
There is intricate linkage between agrobiodiversity, dietary diversity and malnutrition, especially dietary quality and health. In tackling malnutrition much can be gained by linking agriculture and ecology to human nutrition [5]. According to the study by [6], agricultural biodiversity is the basis of the food chain which contributes to food and livelihood security, especially in the developing countries which highly depend on own food supply and food-based strategies rooted in the sustainable use of biological resources to improve local diets [6]. By its very nature, the deployment of agricultural biodiversity affects many different aspects of human livelihoods and it can be difficult to separate out the benefits and rigorously demonstrate causal relationships among these [7]. Balanced and adequate nutrition is important in improving the health of the community in general and of vulnerable groups in particular, agricultural biodiversity has provided enormous nutrition and health benefits but overexploitation of some resources and widespread habitat loss has negatively impacted the dietary diversity, nutrition and health of some groups of society [8].
Agricultural biodiversity is essential for a sustainable improvement in food and nutrient security and is absolutely essential in coping with predicted impacts of the climate change as the underpinnings of more resilient farm ecosystems [9]. Nutrition research provides essential information on how environmental degradation can lead to major nutrition-related health problems such as malnutrition, infectious disease, and contamination. When people have reduced access to and intake of crucial bio resources, they may suffer from protein-energy malnutrition and micronutrient deficiencies. Major public health problems of global importance such as tuberculosis, gastrointestinal diseases, measles, and respiratory disease all reflect the interaction of nutritional and environmental factors. In another way Practice of mono-cropping has increased from time to time resulting into decrease in nutritious crops, income diversification, and increase in environmental problems and unsustainable natural resource use. Assessment of the nutritional status of a community is important for development of implementation strategies and suitable policies [10].
Studies previously conducted in some districts of Hadiya zone indicate that the presence of malnutrition in the area. A study by [11], Assessment on household food insecurity and its association with the nutritional status of children 6–59 months of age in East Badawacho, revealed that 75.8 % household food insecurity, prevalence rates of stunting, underweight, and wasting among children were 45.6%, 26.3%, and 14.6%, respectively [11]. Another study done by [12] on determinants of nutritional status of under-five children in Anelmo district identified prevalence of stunting of children is 42.4%, underweight 16.1% and wasting 9.7% respectively. They concluded that age of household head, water source, land size, complementary feeding, antenatal care, toilet, time elapse to fetch water and livestock ownership were significantly associated with the aforementioned problems [12]. These findings indicate the presence of nutritional problems in the area but still there is no study in the region that correlates the impact of agrobiodiversity on the nutritional status of the community. So, this study concerned on evaluating the impact of agrobiodiversity on the nutritional status in case of Hadiya zone Lemo and Soro districts.
MATERIALS AND METHODS
Study area description
The study was conducted in Hadiya zone, which is located in 230 Km South from the capital Addis Ababa. Specifically, in Lemo and Soro districts.
Sample size determination and sampling
Purposive sampling was followed by stratified random sampling. According to the information from Hadiya zonal agriculture and natural resource development department, both Lemo and Soro districts were selected for this study, as per as their agrobiodiversity potential. After that, three agrobiodiversity rich and three agrobiodiversity poor localities were selected from the respective districts. From Soro district Wosheba, Abuna and 1st Beinale are agrobiodiversity rich and Shera, Ille and Gidachemo are selected as agrobiodiversity poor localities. Similarly, three localities from Lemo district Hayise, Secha and Lereba were selected as agrobiodiversity rich and Masibira, 1st Omoshora and 2nd Omoshora are selected as agrobiodiversity poor ones. Study populations chosen from the aforementioned 12 localities. Sample size determined by using Epi Info 7.0 software based on the following assumptions.
Confidence interval (CI) at 95%, α set at 0.05 and Zα/2 = 1.96, (critical value for normal distribution at 95% CI) and power is 80%, expected prevalence of 50%. Margin of error is 5%. Main aim of the study is to compare the nutritional statuses of children between agrobiodiversity rich and agrobiodiversity poor areas, a two-population-proportions formula was used to determine the sample size. 192*2= 384 children’s were included and 5% of the sample for non-response rate is added and a total of 403 children’s/mother or caregiver pair. But, to allocate equal number of samples for all localities a total 408 children’s/mothers or caregivers were selected.
Sampling technique
Calculated sample size (403) allocated for 12 localities selected from two districts to generate a sampling frame for each localities. To distribute equal sample size for total localities 408 samples allocated. Sample households with eligible children were selected from the sampling frame of each kebele using simple random sampling technique. When there was more than one child present in the selected household, only the youngest child was selected.
Data collection
The required data for this study were collected both from primary and secondary sources. Primary data collected through socio-economic survey, dietary diversity and agrobiodiversity index questioners and from anthropometric measurements. Secondary data were collected from Hadiya zone agricultural and natural resource development department, from Soro and Lemo district health offices.
Study design for Agrobiodiversity assessment
Agrobiodiversity status study of Soro and Lemo districts selected localities done by using questionnaires constructed by using FAO guideline [13]. Agricultural biodiversity of the study areas measured by determining the variety of food plants grown, animals reared for food and food items obtained from natural habitats. A list of all food items grown, all animals reared, hunted, and other food items obtained from natural habitats through gathering or trapping was established for each household [13].
Study design for Demographic and Socioeconomic characteristics
The study population demographic and socioeconomic status assessed by using semi structured questioners constructed for this purpose.
Study design for House hold dietary diversity
The household dietary diversity score (HDDS) is meant to reflect, in a snapshot form, the economic ability of a household to access a variety of foods. House hold dietary diversity data were collected by using semi-structured questionnaires and micro- level data drawn from repeated 24 hours diet recall survey for daily dietary intake of the house hold members. An individual who is responsible to prepare food or serve food for family members is used as source of household dietary diversity data.
Study design for Anthropometric data
Anthropometric data were collected according to the method designed by Gibson, 2005, the child health card or birth certificate is used to ascertain and record the age of the index child. In situations where the mother/care giver did not have the documents to ascertain the age of the child, they are asked to identify a child from the neighborhood who was born almost the same time. Children younger than 6 month and older than 59 months were excluded from the study. Height of the children’s was measured in a standing position, by using free standing height/ length standiometer by checking that the children’s were bare foot and the heels, buttocks, shoulders, and the back of the head touched the standiometer. Each measurement taken twice and an average were taken to ensure accuracy. Weight of children’s measured by using electronic scale with minimum clothing, by emptying bladder and without shoes and each measurement was taken twice [14]. The children’s anthropometric status was determined by using WHO growth standards Z-scores.
Statistical data analysis
The data collected from agrobiodiversity assessment, demographic and socioeconomic characteristics and dietary diversity were entered in IBM SPSS version 20.0 and the required statistical analyses were calculated. For sample size determination Epi Info 7 is used. For anthropometric data analysis WHO anthrop v.3.2.2 software was used to convert raw nutritional status data into Z-scores.
Ethical clearance
The proposal submitted to the institutional review board of Wachemo University. Ethical clearance obtained from the board.
RESULTS AND DISCUSSION
Agrobiodiversity assessment
Agricultural biodiversity of the study areas were measured by assessing land use diversity and practices, determining the species and variety of food plants grown, animals reared for food and food items obtained from natural habitats. A list of all food items grown, all animals reared, hunted, and other food items obtained from natural habitats through gathering or trapping was established for each household.
Land use diversity and practices and various variables used to assess the agrobiodiversity of study areas. For agrobiodiversity study of Shera, Ille and Gidachemo localities of Soro district a total of 102 households were participated in the survey. Majority of study subjects (84.3%) cultivate only maize and wheat as source of food and they doesn’t any fish pond and fruit orchard and only 11.76% have home garden. Additionally 86.27% of households may cultivate crops of local variety. Almost all of the community (88.23%) of study area may keep livestock like cow, sheep and hen and 88.33% of them keep local varieties. The other three localities namely Wosheba, Abuna and 1st Beinale show relatively good agrobiodiversity status as compared to their counterparts. Even though, almost all localities of Soro district included in this study don’t have fish ponds, 28.43% of Wosheba, Abuna and 1st Beinale have fruit orchard. Also 58.7% of the community cultivates 4-5 different species of crops in addition to maize and wheat; furthermore, 41.17% of the community has home gardens. Regarding livestock diversity 95.05% of the subjects may keep livestock and 27.46% keep commercial variety.
From three localities of Lemo district Masibira, 1st Omoshora and 2nd Omoshora similarly 102 households assessed to evaluate agrobiodiversity of the area. Only 4.9 % have home garden and none of them have fruit orchard. Concerning crop diversity and production, majority of the study population (75.4%) cultivate only maize and wheat. Additionally, most of them focus on cultivation of local varieties. As of the total household 32.35% of the study population keep livestock 79.41% of the livestock are local varieties. In opposite, the other three localities, Hayise, Lereba and Secha are also assessed for their agrobiodiversity status and they have relatively good agrobiodiversity status as compared with Masibira, 1st Omoshora and 2nd Omoshora. The result depicts that, 54.9% of the population have home gardens and 48.03% have fruit orchard. Out of 102 households 71.55% cultivate more than 4 different species of crops, in addition to maize and wheat. About variety of the crops, 39.22% of the study population cultivates the commercial variety of crops. 97.05 of the samples keep different species of animals.
Demographic and Socioeconomic characteristics
Demographic and socioeconomic characteristics of certain area have the power to determine the nutritional status of a given community. As indicated under Table 1, demographic and socioeconomic characteristics assessment of three agrobiodiversity poor areas of Soro district indicates that majority of the households in Shera, Ille and Gidachemo localities were headed by male (89.2%) and 62.76% of the households are farmer. Most of the households (47.08%) have family size of 7-10. Regarding their monthly income and deposit, 98.04% of households have monthly income ≤ 500 ETB and all of the households (100%) deposit ≤500 ETB per month.
|
Table 1: Demographic and Socioeconomic characteristics of Soro district selected localities. |
||||||
|
No. |
Variables |
Soro district localities |
||||
|
|
Shera, Ille and Gidachemo (Agrobiodiversity poor) |
Percent
|
Wosheba, Abuna and 1st Beinale (Agrobiodiversity rich) |
Percent |
||
|
1. |
Head of Household |
Male |
91 |
89.2 |
88 |
86.27 |
|
Female |
11 |
10.8 |
14 |
13.73 |
||
|
Total |
102 |
100 |
102 |
100 |
||
|
2. |
Age of household head |
< 24 |
32 |
31.45 |
37 |
36.3 |
|
25-34 |
47 |
46 |
40 |
39.2 |
||
|
> 35 |
23 |
22.55 |
25 |
24.5 |
||
|
Total |
102 |
100 |
102 |
100 |
||
|
3. |
Occupation of household head |
Farmer |
64 |
62.76 |
56 |
54.92 |
|
Livestock breeder |
6 |
5.88 |
12 |
11.76 |
||
|
Retired |
5 |
4.9 |
0 |
0 |
||
|
Merchant |
11 |
10.78 |
20 |
19.6 |
||
|
Civil servant |
6 |
5.88 |
6 |
5.88 |
||
|
Teacher |
6 |
5.88 |
5 |
4.9 |
||
|
Other |
4 |
3.92 |
3 |
2.94 |
||
|
Total |
102 |
100 |
102 |
100 |
||
|
4. |
Marital status |
Married |
55 |
53.92 |
62 |
60.8 |
|
Divorced |
17 |
16.64 |
11 |
10.78 |
||
|
Widowed |
3 |
2.96 |
9 |
8.82 |
||
|
Separated |
27 |
26.48 |
20 |
19.6 |
||
|
Total |
102 |
100 |
102 |
100 |
||
|
5. |
Family size |
< 3 |
19 |
18.6 |
20 |
19.6 |
|
4-6 |
31 |
30.4 |
24 |
23.5 |
||
|
7-10 |
48 |
47.08 |
45 |
44.1 |
||
|
>11 |
4 |
3.92 |
13 |
12.8 |
||
|
Total |
102 |
100 |
102 |
100 |
||
|
6. |
Land ownership status |
Own land |
69 |
67.66 |
88 |
86.28 |
|
Rented |
11 |
10.78 |
7 |
6.86 |
||
|
Share |
22 |
21.56 |
7 |
6.86 |
||
|
Total |
102 |
100 |
102 |
100 |
||
|
7. |
Land size in hectare |
≤ 0.5ha |
92 |
90.2 |
34 |
33.33 |
|
0.51-0.75 |
6 |
5.88 |
41 |
40.19 |
||
|
0.76-1ha |
2 |
1.96 |
8 |
7.84 |
||
|
>1ha |
2 |
1.96 |
19 |
18.64 |
||
|
Total |
102 |
100 |
102 |
100 |
||
|
8. |
Source of food for household |
Own production |
67 |
65.7 |
86 |
84.32 |
|
Purchase |
17 |
16.66 |
6 |
5.88 |
||
|
Aid |
15 |
14.7 |
2 |
1.96 |
||
|
Shared production |
3 |
2.94 |
8 |
7.84 |
||
|
Total |
102 |
100 |
102 |
100 |
||
|
9. |
Monthly income in ETB |
≤500 |
100 |
98.04 |
55 |
53.93 |
|
501-1000 |
2 |
1.96 |
32 |
31.37 |
||
|
1001-2000 |
0 |
0 |
11 |
10.78 |
||
|
>2001 |
0 |
0 |
4 |
3.92 |
||
|
Total |
102 |
100 |
102 |
100 |
||
|
10. |
Monthly deposit in ETB |
≤500 |
102 |
100 |
60 |
58.81 |
|
501-1000 |
0 |
0 |
26 |
25.5 |
||
|
1001-2000 |
0 |
0 |
10 |
9.81 |
||
|
>2001 |
0 |
0 |
6 |
5.88 |
||
|
Total |
102 |
100 |
102 |
100 |
||
|
11. |
Ownership status of house |
Own |
89 |
87.26 |
91 |
89.22 |
|
Rental |
2 |
1.96 |
9 |
8.82 |
||
|
User not paying rent |
11 |
10.78 |
2 |
1.96 |
||
|
Total |
102 |
100 |
102 |
100 |
||
|
12. |
Domestic water source |
Water pump |
19 |
18.64 |
29 |
28.43 |
|
Village fountain |
73 |
71.56 |
15 |
14.7 |
||
|
Well water |
8 |
7.84 |
22 |
21.56 |
||
|
Water tank |
2 |
1.96 |
10 |
9.81 |
||
|
Interior water supply system |
0 |
0 |
26 |
25.5 |
||
|
Total |
102 |
100 |
102 |
100 |
||
|
13. |
Availability of health facility in the area |
Hospital |
0 |
0 |
21 |
20.6 |
|
Clinic |
15 |
14.7 |
34 |
33.33 |
||
|
Health extensions |
87 |
85.3 |
47 |
46.07 |
||
|
Total |
102 |
100 |
102 |
100 |
||
|
ETB: Ethiopian Birr |
||||||
As far as source of food source concerned, 65.7% households depend on their own production for food source. In contrary, agrobiodiversity rich localities of Soro district, namely Wosheba, Abuna and 1st Beinale demographic and socioeconomic status analyzed in Table 1 and it indicates that, 86.27% of households are headed by male and 59.42% of household heads are farmers. Greater portion of households (84.32%) produces their own food through farming activity. Monthly income and deposit, 53.93% have monthly income below 500 ETB and 58.81% have monthly deposit below 500 ETB.
Similarly, Lemo district agrobiodiversity poor and agrobiodiversity rich localities demographic and socioeconomic characteristics were assessed and the result indicated under Table 2, 84.3% of households headed by male in agrobiodiversity poor localities of Lemo district, Masibira, 1st Omoshora, and 2nd Omoshora. Likewise 85.3% of these households produce their own food on their farm through farming, 93.14% of the households have monthly income ≤ 500 birr, and 95.07% have monthly deposit ≤ 500 ETB. Hayise, Secha and Lereba localities are areas recognized as agrobiodiversity rich, in comparison with their counter parts. Demographic and socioeconomic characteristics assessment of these localities illustrated under Table 2 and it point out that, 72.54% of the households headed by male and 75.5% of the households get food from their farm land by faming activity. 49% of the household heads in these areas are farmers, 85.3% have monthly income ≤ 500 ETB and 96.07% have monthly deposit ≤ 500.
|
Table 2: Demographic and Socioeconomic characteristics of Lemo district selected localities. |
||||||
|
No. |
Variables |
Lemo district localities |
||||
|
|
Masibira, 1st Omoshora and 2nd Omoshora (Agrobiodiversity poor) |
Percent
|
Hayise, Secha and Lereba (Agrobiodiversity rich) |
Percent |
||
|
1. |
Head of Household |
Male |
86 |
84.3 |
74 |
72.54 |
|
Female |
14 |
13.7 |
28 |
27.46 |
||
|
Total |
102 |
100 |
102 |
100 |
||
|
2. |
Age of household head |
< 24 |
22 |
21.56 |
33 |
32.35 |
|
25-34 |
51 |
50 |
19 |
18.62 |
||
|
> 35 |
29 |
28.44 |
50 |
49.03 |
||
|
Total |
102 |
100 |
102 |
100 |
||
|
3. |
Occupation of household head |
Farmer |
53 |
51.96 |
50 |
49 |
|
Livestock breeder |
16 |
15.68 |
10 |
9.8 |
||
|
Retired |
6 |
5.88 |
3 |
2.98 |
||
|
Merchant |
8 |
7.84 |
14 |
13.72 |
||
|
Civil servant |
12 |
11.76 |
11 |
10.77 |
||
|
Teacher |
5 |
4.9 |
9 |
8.83 |
||
|
Other |
2 |
1.98 |
5 |
4.9 |
||
|
Total |
102 |
100 |
102 |
100 |
||
|
4. |
Marital status |
Married |
72 |
70.58 |
Married |
69 |
|
Divorced |
10 |
9.8 |
Divorced |
12 |
||
|
Widowed |
5 |
4.9 |
Widowed |
7 |
||
|
Separated |
15 |
14.72 |
Separated |
14 |
||
|
Total |
102 |
100 |
Total |
102 |
||
|
5. |
Family size |
< 3 |
14 |
13.72 |
< 3 |
9 |
|
4-6 |
51 |
50 |
4-6 |
28 |
||
|
7-10 |
28 |
27.45 |
7-10 |
59 |
||
|
>11 |
9 |
8.83 |
>11 |
6 |
||
|
Total |
102 |
100 |
Total |
102 |
||
|
6. |
Land ownership status |
Own land |
86 |
84.3 |
94 |
92.16 |
|
Rented |
0 |
0 |
2 |
1.96 |
||
|
Share |
16 |
15.7 |
6 |
5.88 |
||
|
Total |
102 |
100 |
102 |
100 |
||
|
7. |
Land size in hectare |
≤ 0.5ha |
48 |
47.1 |
62 |
60.78 |
|
0.51-0.75 |
33 |
32.3 |
13 |
12.74 |
||
|
0.76-1ha |
17 |
16.7 |
17 |
16.68 |
||
|
>1ha |
4 |
3.9 |
10 |
9.8 |
||
|
Total |
102 |
100 |
102 |
100 |
||
|
8. |
Source of food for household |
Own production |
87 |
85.3 |
77 |
75.5 |
|
Purchase |
9 |
8.84 |
9 |
8.82 |
||
|
Aid |
2 |
1.96 |
2 |
1.96 |
||
|
Shared production |
4 |
3.92 |
14 |
13.72 |
||
|
Total |
102 |
100 |
102 |
100 |
||
|
9. |
Monthly income in ETB |
≤500 |
95 |
93.14 |
87 |
85.3 |
|
501-1000 |
6 |
5.88 |
12 |
11.76 |
||
|
1001-2000 |
1 |
0.98 |
2 |
1.96 |
||
|
>2001 |
0 |
0 |
1 |
0.98 |
||
|
Total |
102 |
100 |
102 |
100 |
||
|
10. |
Monthly deposit in ETB |
≤500 |
97 |
95.07 |
98 |
96.07 |
|
501-1000 |
5 |
4.93 |
4 |
3.93 |
||
|
1001-2000 |
0 |
0 |
0 |
0 |
||
|
>2001 |
0 |
0 |
0 |
0 |
||
|
Total |
102 |
100 |
102 |
100 |
||
|
11. |
Ownership status of house |
Own |
96 |
94.12 |
90 |
88.24 |
|
Rental |
4 |
3.92 |
4 |
3.92 |
||
|
User not paying rent |
2 |
1.96 |
8 |
7.84 |
||
|
Total |
102 |
100 |
102 |
100 |
||
|
12. |
Domestic water source |
Water pump |
24 |
23.5 |
32 |
31.39 |
|
Village fountain |
10 |
9.8 |
18 |
17.64 |
||
|
Well water |
55 |
53.93 |
6 |
5.88 |
||
|
Water tank |
8 |
7.85 |
12 |
11.76 |
||
|
Interior water supply system |
5 |
4.92 |
34 |
33.33 |
||
|
Total |
102 |
100 |
102 |
100 |
||
|
13. |
Availability of health facility in the area |
Hospital |
0 |
0 |
0 |
0 |
|
Clinic |
22 |
21.56 |
57 |
55.88 |
||
|
Health extensions |
80 |
78.44 |
45 |
44.12 |
||
|
Total |
102 |
100 |
102 |
100 |
||
|
ETB: Ethiopian Birr |
||||||
Household dietary diversity score
The household dietary diversity score (HDDS) is meant to reflect, in a snapshot form, the economic ability of a household to access a variety of foods. Studies have shown that an increase in dietary diversity is associated with socio-economic status and household food security (household energy availability) [15,16]. Household dietary diversity score of both Lemo and Soro districts study population were assessed and the results described on Figure 1.
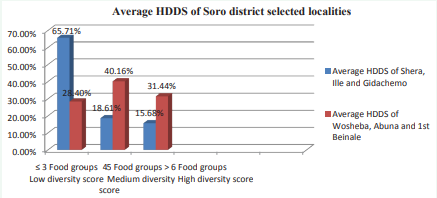
Figure 1: Average household dietary diversity score of Soro district selected localities.
As depicted on the graph on Figure 1, 65.71% of the households from Shera, Ille and Gidachemo show low household dietary diversity score and they depend on only ≤3 food groups. Comparatively, small number of households (15.68%) shows high dietary diversity score. Wosheba, Abuna and 1st Beinale localities of Soro district shows relatively good household dietary diversity score as compared with their counterparts. As analyzed on the graph on Figure 1, 31.44% of 102 households have high household dietary diversity score and only 28.40% of the households have low household dietary diversity score.
Additionally 204 households from 6 localities of Lemo district are also assessed for their household dietary diversity score and the result described on Figure 2.
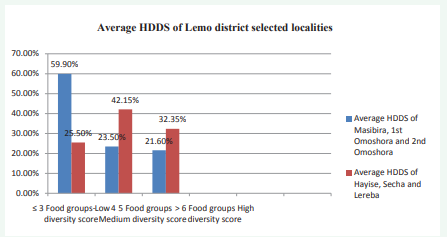
Figure 2: Average household dietary diversity score of Lemo district selected localities.
More than half (54.90%) of 102 households from Masibira, 1st Omoshora and 2nd Omoshora localities households scored low dietary diversity and only 21.50% of the households have highest household dietary diversity score. As indicated on the graph of Figure 2, Hayise, Lereba and Secha localities of Lemo woreda 102 households assessed for their dietary diversity score, 32.35 % of the households have the highest household dietary diversity score and 25.50% of the households have low dietary diversity score.
Anthropometric data
A total of 408 children’s aged 6-59 months were assessed for their nutritional status from 12 small administrative areas of both Lemo and Soro districts. Anthropometric indices of the study population were calculated using reference medians recommended by the [17] and classified according to standard deviation units (z-scores), based on the WHO criteria. Wasting (weight-for-height z-score–WHZ) indicates thinness. It is usually the result of recent nutritional deficiency and is affected by seasonal shifts associated with availability of foods and/ or prevalence of disease. A WHZ of <-2 defines the presence of acute malnutrition (wasting). Stunting, represented by low height-for-age z-score (HAZ), results from extended periods of inadequate food intake, poor dietary quality, increased morbidity, or a combination of these factors. A HAZ of <-2 defines chronic malnutrition (stunting). Weight for-age z-score (WAZ) is essentially a composite of weight-for-height and height-for-age, thus a measure of both acute and chronic malnutrition. A WAZ of <-2 is used for defining a child as underweight. A z-score of <-3 defines severe levels of each of the indices [17].
The Z-score was computed for each measure to see how far a children’s are from the median height/weight of the reference distribution for children of the same height/weight, taking in to consideration the standard deviation of the reference distribution. The analysis of the three anthropometric indices height-for-age, weight-for-age and weight-for-height in the study area: showing Z-scores and their corresponding means and standard deviations for HAZ, WAZ and WHZ.
Weight for age (WAZ) underweight
From Soro district three localities those identified as agrobiodiversity poor namely Shera, Ille and Gidachemo a total of 102 children’s were assessed for their nutritional status. Out of these 39.2% of the children’s have Z-score of weight for age <-2 and 7.8% have Z-score of <-3 weight for age. This indicates standard deviation below -2 that means less than the reference population and deviated to negative Z-score. The graph on Figure 3 depicts study populations weight for age in comparison with WHO standard.
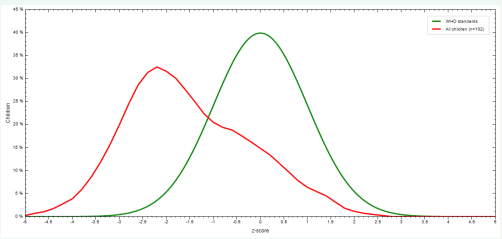
Figure 3: Z-score of weight for age (WAZ) nutritional status of Shera, Ille and Gidachemo localities study population in comparison with reference population for both sexes.
As well, 102 children’s were also sampled from three agrobiodiversity rich localities of Soro district are assessed and as shown on graph of Figure 4, 3.9 % of the samples have Z-score below <-2SD as compared with the reference population.
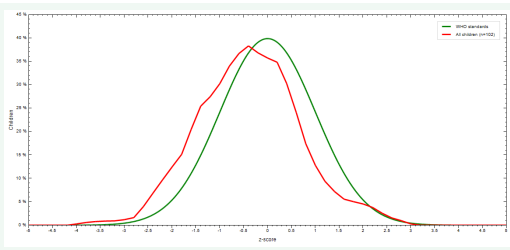
Figure 4: Z-score of Weight to age (WAZ) of sample population of Wosheba, Abuna and 1st Beinale localities in comparison with WHO standards for both sexes.
Based on the finding described above, the study populations those assessed for their nutritional status from agrobiodiversity rich areas shows relatively less prevalence of underweight (3.9%) as compared with the study population analyzed for their nutritional status from agrobiodiversity poor areas (39.2%).
In another way Z-score for weight to age is also calculated for the samples from Lemo district selected localities both as agrobiodiversity rich and agrobiodiversity poor. Agrobiodiversity poor areas are Masibira, 1st Omoshora and 2nd Omoshora Z-score of weight to age illustrated on Figure 5 on Z-score graph. As indicated on the graph 21.6% of 102 children’s scored Z-value below <-2SD and 3.9% score <-3SD.
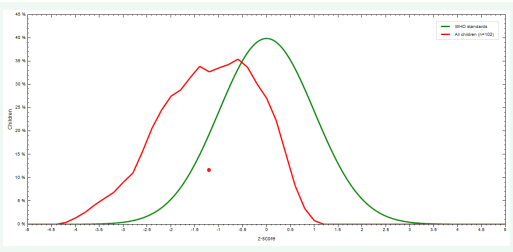
Figure 5: Z-score of Weight to age (WAZ) of sample population of Masibira, 1st Omoshora and 2nd Omoshora localities in comparison with WHO standards for both sexes.
From agrobiodiversity rich districts of Lemo district Hayise, Lereba and Secha 13.7% of the children’s from 6-59 months are underweight and they have Z-score below <-2SD of their weight for age as compared with reference population of WHO standards and 1 % have Z-score <-3SD. Z-score is illustrated on Figure 6.
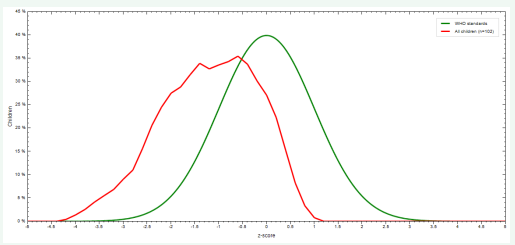
Figure 6: Z-score of Weight to age (WAZ) of sample population of Hayise, Lereba and Secha localities in comparison with WHO standards for both sexes.
Stunting (Low height for Age)
Height for age (HAZ) of study population assessed from both Soro and Lemo districts agrobiodiversity poor and rich areas. The result for samples analyzed from Soro woreda agrobiodiversity poor areas indicates that 25.5% of children’s have Z-score value below <-2SD for their height to age and they have chronic malnutrition and stunting. Figure 7 indicates Z-score for height to age of children’s age from 6-59 from Shera, Ille and Gidachemo localities of Soro district.
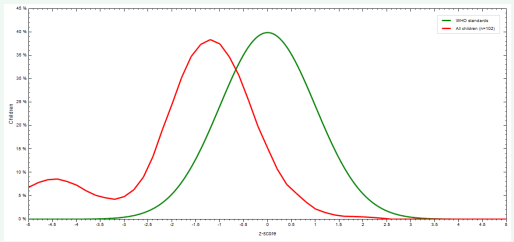
Figure 7: Z-score of height for age (HAZ) of sample population of Shera, Ille and Gidachemo localities in comparison with WHO standards for both sexes
Whereas, children’s from agrobiodiversity rich areas of Soro district shows relatively less prevalence of stunting as compared with their counterparts. From 102 children’s assessed for height to age (HAZ), 6.7% of them have Z-score below <-2 SD in relation to the reference population of WHO standards. Figure 8, describes Z-score of children’s from Wosheba, Abuna and 1st Beinale localities.
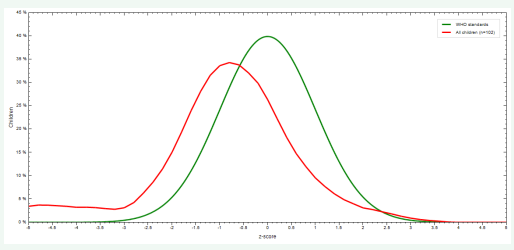
Figure 8: Z-score of height for age (HAZ) of sample population of Wosheba, Abuna and 1st Beinale localities in comparison with WHO standards for both sexes.
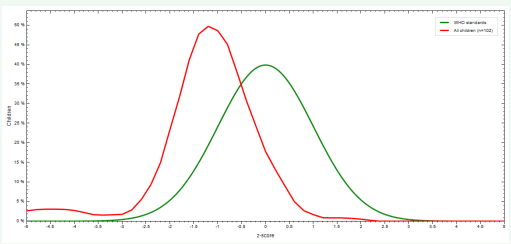
Figure 9: Z-score of height for age (HAZ) of sample population of Masibira, 1st Omoshora and 2nd Omoshora localities in comparison with WHO standards for both sexes.
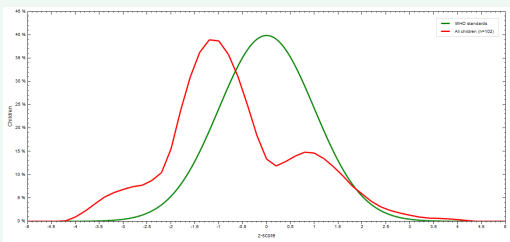
Figure 10: Z-score of height for age (HAZ) of sample population of Hayise, Lereba and Secha localities in comparison with WHO standards for both sexes.
Besides, 204 children’s from agrobiodiversity rich and poor localities of Lemo district assessed for their height to age. Out of these 204 children’s 12.7% and 5.9% have Z-score below <-2 SD from Agrobiodiversity poor and rich kebeles, respectively.
Wasting (Acute malnutrition) (WHZ)
Wasting is another form of common malnutritional problem in developing countries. Weight for height (WHZ) status of study population is assessed during the survey to check the presence of acute malnutrition.
Three agrobiodiversity poor localities of Soro district were sampled to assess the nutrition status of 102 children’s aged 6-59 months old. As described on Figure 11 by the graph 10.8% of the children’s assessed have Z-score value below <-2SD and 4.9% have Z-score of <-3SD.

Figure 11: Z-score of weight for height (WHZ) of sample population of Shera, Ille and Gidachemo localities in comparison with WHO standards for both sexes.
Z-score of weight for height of 102 children’s from agrobiodiversity rich localities of Soro district is shown on Figure 12.
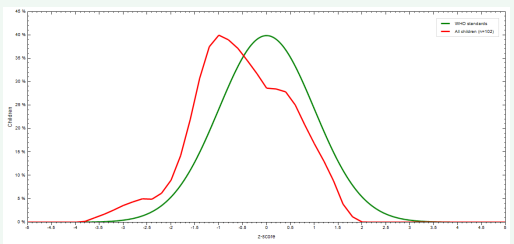
Figure 12: Z-score of weight for height (WHZ) of sample population of Wosheba, Abuna and 1st Beinale localities in comparison with WHO standards for both sexes.
It is lucid that 6.9% of the study population have Z-score value below <-2SD and 2% have <-3SD in comparison with reference population of WHO standards.
Prevalence of wasting is also assessed in three agrobiodiversity poor and three agrobiodiversity rich localities of Lemo woreda. From agrobiodiversity poor areas namely Masibira, 1st Omoshora and 2nd Omoshora a total of 102 children are aged from 6-59 months old were assessed. As represented on Figure 13, 16.9% of children’s have Z-score of <-2SD and 2.9% scored Z-value of <-3SD.
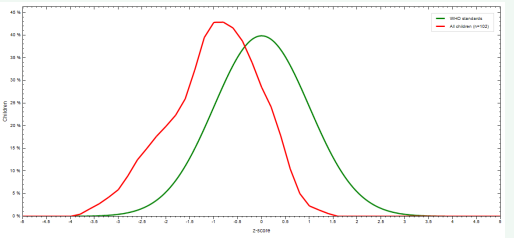
Figure 13: Z-score of weight for height (WHZ) of sample population of Masibira, 1st Omoshora and 2nd Omoshora localities in comparison with WHO standards for both sexes.
Relatively, children’s those assessed for their weight for height from agrobiodiversity areas of Lemo district shows low prevalence of wasting in comparison with their counterparts. Figure 14, indicate Z-score of weight for height of 102 children’s from Hayise, Lereba and Secha localities, 4.2 % have Z-score below <-2SD and 1% have <-3SD.
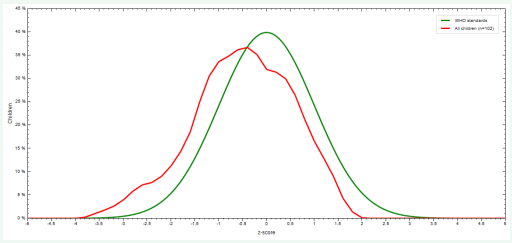
Figure 14: Z-score of weight for height (WHZ) of sample population of Hayise, Lereba and Secha localities in comparison with WHO standards for both sexes.
CONCLUSION
In accordance with the objective of this study, two districts from Hadiya zone selected to assess their agrobiodiversity status and its impact on the nutritional status. A total of 408 children’s and mothers/caregivers and households selected as a study population from 12 kebeles of Lemo and Soro districts. Three localities from Soro districts Shera, Ille and Gidachemo showed poor agrobiodiversity and socioeconomic characteristics, low household dietary diversity score and high level of underweight, stunting and wasting. Correspondingly, three localities from Lemo district also demonstrated the same pattern. Poor agrobiodiversity status, poor socioeconomic characteristics, low dietary diversity score and high prevalence of underweight, stunting and wasting is recorded.
Additionally, three other localities from Soro district Wosheba, Abuna and 1st Beinale have good agrobiodiversity status, socioeconomic characteristics, high dietary diversity score and relatively low prevalence of underweight, stunting and wasting recorded. The same holds true for the other three localities of Lemo district, namely Hayise, Secha and Lereba.
In conclusion, household dietary diversity is linked with agrobiodiversity status of the study area and household dietary diversity affects the nutritional status of children’s aged 6-59 month old. Area those have relatively poor agrobiodiversity experienced low household dietary diversity and high prevalence of stunting, wasting and underweight.
ACKNOWLEDGEMENT
We would like to forward our heartfelt gratitude to Wachemo University, for funding this research. Furthermore, our appreciation goes to study area health extension workers and data collectors.
REFERENCES
2. Harlan JR. ‘Our vanishing genetic resources’. Science. 1975; 188: 618- 622.
11. FAO/WHO (Food and Agriculture Organization of the United Nations/ World Health Organization). International Conference on Nutrition: Plan of Action for Nutrition. Ecology of Food and Nutrition. 1994; 32: 5-31.
15. Gibson RS. Principles of nutritional assessment, 2nd ed. Oxford University Press, New York. 2005.
18. World Health Organization (WHO). New child growth standards. Geneva, WHO; 2006.


