Mineral and Vitamin Contents of Danwake from Sorghum, Wheat and Cassava Bases
- 1. Department of Food Science and Technology, Rural Economic Institute (IER) Food Technology Laboratory Sotuba, France
- 2. Department of Food Science and Technology, University of Maiduguri, Nigeria
- 3. Department of Food Science, Purdue University, USA
- 4. Department of Agricultural Extension Services, University of Maidugur, Nigeria
Abstract
The mineral and vitamin contents of danwake from sorghum, wheat and cassava were investigated. Seven (7) danwake flour blends, sorghum containing 5. 7, 11, 16 and 30 % cowpea, wheat with 0 % cowpea and cassava with 11 % cowpea, were formulated.). While the danwake samples containing 30% cowpea were formulated at the Food Processing Laboratory of the Department of Food Science and Technology of the University of Maiduguri, those samples with 5, 7, 11 and 16 % cowpea, were formulated by danwake processors on the University Campus. The danwake samples were processed following the traditional method [1,2]. Results from the data analyses showed that the cadmium content in the samples ranged from 0 to 4 mg/100 g and that of chromium from 0.6 to 14.4 mg/100 g sample. The iron content of the samples varied from 1 mg /100 g in wheat danwake with 0 % cowpea to 12.5 mg /100 g in sorghum danwake with 30 % cowpea. Lead was not found in danwake samples. The highest and the lowest manganese contents were found in sorghum danwake with 5 % and 30 % cowpea, respectively. Potassium content ranged from 226 mg / 100 g to 0 while that of zinc varied from 8.6 mg /100 g to 0. Thiamin, riboflavin and pyridoxine contents were 0.60 to 10.99 mg/100 g, 1.12 to 1.43 mg/100 g and 0.86 to 7.87 mg/100 g, respectively. Based on the mineral and vitamin contents of the danwake samples as well as the cost of cowpea, the best formulation among the 7 investigated was that of sorghum danwake with 16 % cowpea.
Keywords
• Mineral
• Vitamin
• Danwake
• Sorghum
• Wheat
Citation
Diarra M, Nkama I, Hamaker BR, Idrisa YL (2015) Mineral and Vitamin Contents of Danwake from Sorghum, Wheat and Cassava Bases. J Hum Nutr Food Sci 3(1): 1054.
INTRODUCTION
Danwake, an indigenous, stiff dumpling food of the people in the northern part of Nigeria is traced to be of the Nupe origin in Niger and Kogi States. The product is originally prepared from sorghum flour / cowpeas flour, cassava flour /cowpeas flour, maize flour / cowpeas flour. However, nowadays, the use of various danwake flour blends, without the incorporation of the traditional ingredients such as cowpea and sorghum, which ultimately affects the physico- chemical and sensory properties of the product, is becoming a great concern with regard to preserving danwake quality and originality. Therefore, the present study sought in two traditional danwake bases, sorghum and cassava with cowpea as well as in a recent base, wheat without cowpea to:
i. Determine the mineral content and
ii. Determine the vitamin content.
MATERIALS AND METHODS
Materials
The materials which composed of sorghum Chakalari white variety and cowpea flours were produced at the Food Processing Laboratory (FPL) of the Department of Food Science and Technology of the University of Maiduguri. Wheat flour, Cassava flour, Baobab leaves powder (Kuka) and potash (Kanwa), were purchased at Maiduguri Monday Market. The aforementioned materials were used to process: at the FPL, samples of sorghum based danwake containing 30 % cowpea and also at processors’ level, sorghum danwake with 5, 7, 11 and 16 % cowpea as well as wheat and cassava danwake with 0 % and 11 % cowpea, respectively. Other materials used in danwake samples preparation included a locally made solar dryer and a kitchen grinder.
Mineral content of the danwake samples was determined using a SMART SPECTROPHOMETER 2000, 15 VERSION 1.0, LaMotte Co, CHESTERTOWN, MD. and that of vitamin, an ultrasonic bath (VWR UTRASONIC CHEANER MODEL USC 2600 TIT, 2004, MALAYSIA, a centrifuge EPPENDORF AG 22331 HAMBURG, MODEL EPPENDORF CENTRIFUGE 5804, 2007 GERMANY, as well as an HPLC (HITACHI – HIGH TECHNOLOGIES CO., 2003, TOKYO, JAPAN).
Methods
Formulation of Danwake Flour Blends: While sorghum danwake samples containing 30 % cowpea were formulated at FPL level, those of cassava danwake with 11 % cowpea as well as sorghum danwake samples containing 5, 7, 11 and 16 % cowpea were formulated by processors. The high cost of cowpea generally determines the quantity incorporated in processors’ formulations. This explains the aforementioned low percentages of cowpea in processors’ danwake flour bends.
Preparation of Danwake Samples: Danwake samples were produced by three different processors and also in the Food Science and Technology Laboratory, following the procedure described by [1,2]. According to the procedure, 500 g of danwake flour blend was mixed in 600 ml of water to produce dough. The dough was molded into small balls which were cooked in boiling water for 15 to 30 min. During cooking, the balls were stirred using a metal perforated spatula, to avoid over boiling and their coalescence to form agglomerates. The cooked balls were thereafter cooled in cold water, and drained using a colander. They were dried for 72 hr in a solar dryer at a temperature of 38º C to 56º C. The dried samples were ground into powder using a manual kitchen grinder and thereafter used for vitamins and minerals analyses.
Mineral Content Determination: Five (5) g of danwake sample was ground into powder using a laboratory mortar and pestle. The powder was transferred into a 250 ml volumetric flask and made to 200 ml line with distilled water. It was thereafter soaked for 24 hr and filtered into another 250 ml volumetric flask through a Whatman paper # 1 in a plastic funnel. Ten (10) ml of the filtrate was taken into an l sample vial and analyzed using the SMART SPECTROPHOMETER 2000, 15 VERSION 1.0, LaMotte Co, CHESTERTOWN, MD. The procedures for determining the investigated minerals, Cadmium, Chromium, Iron, Lead, Manganese, Potassium and Zinc have been described in Method in Appendices, 1, 2, 3, 4, 5, 6 and 7, respectively.
Vitamin Content Determination
Sample Preparation: Danwake vitamin content was determined following the method described by CRAWFORD SCIENTIFIC LC [3] according to which samples were powdered and homogenized using a laboratory pestle and a mortar. Then 1.5 g was weighed into a 10 ml dispensable centrifuge tube and extracted with 0.1 % Trifluoro acetic acid (TFA). The samples in the centrifuge tube were sonicated using an ultrasonic bath (VWR UTRASONIC CHEANER MODEL USC 2600 TIT, 2004, MALAYSIA) for 10 min. They were thereafter centrifuged using an EPPENDORF AG 22331 HAMBURG, MODEL EPPENDORF CENTRIFUGE 5804, 2007 GERMANY, at 4500 rpm for 10 min. The supernatant from the centrifuged samples was then filtered through 0.20 µm NYLON ACRODISC BPAL filter and 1 ml of the filtrate made up to 1.5 ml with the mixture of standard vitamins containing (vitamin B1 = 0.032 mg/ml), (vitamin B2 = 0.021 mg/ ml), and (B6 = 0.032 mg/ml). The test samples in 1.5 ml, glass sample vial, were transferred into the HPLC (HITACHI – HIGH TECHNOLOGIES CO., 2003, TOKYO, JAPAN) auto sampler for analysis.
Standard Vitamin Preparation: Appropriate amount of the vitamin standards were weighed into calibrated volumetric flask and diluted accordingly to give the working concentrations. Twenty milligram (20 mg) of each of the three vitamins B1, B2 and B6 was dissolved separately in 25 ml of 0.1 % TFA to obtain three different dilution solutions (first dilution). Six (6 ml) of each of vitamin B1 andB6 first dilution solutions and 4 ml of that of vitamin B2, were dissolved separately again in 50 ml of 0.1% TFA to obtain the second dilution solutions of the respective vitamins. Finally, 0.5 ml of each of the three second dilution solutions of the three vitamins was dissolved separately in 1.5 ml of 0.1% TFA to get the final concentrations of 0.032 mg of vitamin/ml of solution (for vitamin B1 and B6 ) and 0.021 mg of vitamin/ ml of solution (for vitamin B2 )
Chromatographic conditions: A binary gradient with mobile phase containing: (solvent A) TFA 0.1% and (solvent B) acetonotrile: The flow-rate was maintained constant at 1.4 ml/ min and the solvent gradient elution program was as follows:
0–4 min, 100 % A, 0% B; 4–6 min, 97 % A, 3 % B; 6–15 min, 85 % A, 15 % B; 15 min,80 % A, 20% B;
Calculation of Results: The vitamin contents of the different danwake samples were calculated using the
Beer- Lambert law as follows;
A = a b C
Where,
A = absorbance,
a = extension coefficient
b = length through which the light travels
C = concentration of the solution
C sample = (C standard x A sample ) / A standard
Statistical Analysis
The statistical analysis was carried out using the Statistics Package for Social Sciences (SPSS) version 16. All the values expressed in percentage were obtained using the frequencies under the descriptive statistics. The means, their standard deviations, and differences significance, were computed through the independent samples T-test. The significance of the assessment was set at 5 %.
RESULTS AND DISCUSSIONS
Minerals and Vitamins Composition of Danwake
Minerals Composition of Danwake: The minerals composition of danwake samples is presented in (Table 1).
Table 1: Mineral Content of Danwake Samples (mg/100 g) (Dry Weight).
| Sample | Cadmium (50* ) | Chromium | Iron (10**) | Lead (2.5**) | Manganese | Potassium | Zinc (50*) |
| Wheat danwake (0 % cowpea) |
0 ± 0b (0.0032) |
1.2 ± 0cd (0.1021) |
1 ± 0.1 (0.2422) |
0 ± 0 (0.3778) |
10.2 ± 0.1c (0.7276) |
51.6 ± 0.85b (0.9544) |
0 ± 0d (0.0708) |
| Sorghum danwake (5 % cowpea) |
4 ± 0.07a (0.1289) |
1.6 ± 0.07c (0.1297) |
7.8 ± 0.28b (0.2498) |
0 ± 0 (1.2624) |
12.8 ± 0.45a (0.9351) |
NDc (2.9841) |
4.6 ± 0.02b (0.0557) |
| Sorghum danwake (7 % cowpea) |
0 ± 0b (0.0156) |
0.8 ± 0.14de (0.0518) |
4.4 ± 0.1d (0.1260) |
0 ± 0 (1.1397) |
11.2 ± 0b (0.7065) |
226 ± 0.14a (1.9116) |
4.2 ± 0.27bc (0.3857) |
| Sorghum danwake (11 % cowpea) |
0.2 ± 0b (0.1381) |
2.2 ± 0b (0.2337) |
4.6 ± 0.13d (0.1381) |
0 ± 0 (0.8586) |
4.6 ± 0.01e (0.3279) |
0 ± 0c (3.0106) |
8.6 ± 0.06a (0.3731) |
| Sorghum danwake (16 % cowpea) |
0 ± 0b (0.0770) |
14.4 ± 0.01a (1.2656) |
6 ± 0.11C (0.1666 |
0 ± 0 (1.3791) |
10.4 ± 0c (0.6617) |
0 ± 0c (2.8531) |
4.2 ± 0.06bc (0.2653) |
| Sorghum danwake (30 % cowpea) |
0 ± 0b (0.0650) |
0.6 ± 0.02e (0.0674) |
12.5 ± 0.22a (0.3314) |
0 ± 0 (1.6695) |
0 ± 0f (0.9870) |
0 ± 0c (3.0105) |
0 ± 0c (0.0617) |
| Cassava danwake (11 cowpea) |
0 ± 0b (0.0855) |
1.2 ± 0.01cd (0.1278) |
5.6 ±0.07C (0.1444) |
0 ± 0 (1.3671) |
5.2 ± 0d (0.3724) |
0 ± 0c (3.0105) |
4 ± 0.01c (0.2676) |
1 Values are means of four determinations and those within the same column not followed by the same superscripts are significantly (p < 0.05) different.
2 Figures within parentheses without asterisk are absorbance values of respective minerals
3 * Figures with asterisk indicate the maximum values of the mineral recommended by the Indian Standards Institution (ISI)(1969)
4 * * Figures with double asterisks designate the maximum values for the Prevention of Food Adulteration Act (PFA) (1988) in India.
54 ND = Not detected
The minerals investigated were cadmium, chromium, iron, lead, manganese, potassium and zinc. Magnesium and phosphorus contents of the samples were not determined because the kits necessary for their analysis were not available. The quality or source of troma rather than the amount utilized, besides the contribution of the other ingredients used in danwake flour blends formulation, might have determined the mineral content of the final product.
Cadmium
The cadmium content of the samples ranged from 0 to 4 mg /100 g. The highest amount being found in sorghum danwake containing 5 % cowpea. Generally, cadmium content is very low when compared with the ISI standard [4], The presence of cadmium in danwake with 5 and 11 % cowpea may be due to the leakage of the mineral from the cooking vessels.
Chromium
Chromium content (Table 1) ranged from 0.6 to 14.4 mg/100 g sample. The highest was obtained in danwake containing 16 % cowpea. The chromium content of the other samples was low. There is little evidence on which to base estimates of the mineral requirements [5]. Reported that deficiency has been observed at intakes below 6 mg (0.12 mmol)/day and the safe and adequate intake level is estimated at about 25 mg (0.5 mmol)/day. High intakes of inorganic chromium salts (in excess of 1 to 2 g/day) are associated with kidney and liver damage.
Iron
Danwake could be regarded as a good source of iron. The iron content of the danwake samples varied from 1 mg /100 g in wheat danwake (0 % cowpea) to 12.5 mg /100 g in sorghum danwake (30 % cowpea), which corresponded to the lowest and the highest contents, respectively. The iron contents of most of the danwake samples were below the maximum tolerance level of 10. mg /100 g [5,6]. Reported that the haem iron of meat and fish is considerably better absorbed than the inorganic iron of vegetable foods. Absorption of iron is enhanced by vitamin C taken at the same time as iron containing foods and reduced by phosphate, calcium and phytic acid. The addition of trona may have led to the increase in iron content of danwake. Iron is an essential mineral, and an average adult has daily 4 to 5 mg, of which 60 to 70 % is present in the blood as haem in the circulating haemoglobin and the remainder present in myoglobin in muscles, a variety of enzymes and tissue stores. Iron is stored in the liver as ferritin, in other tissues as haemosiderin and as the blood transport protein transferrin [5].
Lead
Lead was not found in danwake samples. Its maximum tolerance limit is 2.5 mg /100 g [6]. Lead as cadmium is a nondietary essential mineral. This mineral may be present in food from traces naturally present in the soil, as contamination of vegetables grown near main roads, which absorb volatile lead compounds from car exhausts, from shellfish that have absorbed it from seawater, from lead glazes on cooking vessels and in drinking water where lead pipes are used. Lead is toxic and its effects are cumulative. It is accumulated predominantly in bones and teeth. In excess, lead causes a range of toxicity problems including anaemia, encephalopathy, neuropathy and renal dysfunction. Traces are excreted in the urine [7].
Manganese
The manganese content of the danwake samples varied from not detected to 12.8 mg/100 g. The highest and the lowest manganese contents were found in sorghum danwake with 5 % and 30 % cowpea, respectively. Four of the danwake samples investigated had manganese content greater or equal to 10 mg/100 g, which is above the previously stated level of safety for this metal [5]. The manganese may be coming from the trona that was added during the preparation of danwake samples. Manganese is an essential trace mineral and functions as the prosthetic group in a number of enzymes. Dietary deficiency has not been reported in man. In experimental animals manganese deficiency leads to impaired synthesis of mucopolysaccharides. Requirements are not known; intakes greater than 1.4 mg/day are considered safe and adequate.
Potassium
Sorghum danwake (7 % cowpea) had the highest potassium content of 226 mg / 100 g, followed by that of wheat danwake (0 % cowpea) (51.6 mg/100 g). The high potassium content of sorghum danwake containing 7 % cowpea might have been due to the source or quality of the potash used. In fact, although all the potash used in danwake samples were purchased at Maiduguri Monday Market, they came from different processors who might have bought them from different suppliers or sellers. Potassium is an essential mineral, widespread in nature. The human body contains about 125 g. mostly present inside the cells. The reference nutrient intake of potassium for adults is 3.5 g/day. It is abundant in fruit and vegetables and important in plant fertilizers [5].
Zinc
The highest (8.6 mg /100 g) and the lowest (not detected) zinc contents of the danwake samples were found in sorghum danwake with 11 % and 30 % cowpea, respectively. Four of the studied danwake samples had zinc content superior or equal to 4 mg / 100 g. Zinc forms the prosthetic group of a large number of enzymes and the receptor proteins for steroid and thyroid hormones and vitamins A and D. It is an essential mineral as iron, and manganese. Deficiency results in hypogonadism and delayed puberty, small stature and mild anaemia. It occurs mainly in subtropical regions where, a great deal of zinc is lost in sweat, and the diet is largely based on unleavened wholemeal bread, in which much of the zinc is unavailable because of the high content of phytate. Intestinal absorption of zinc requires an (as yet unidentified) organic zinc binding ligand secreted in pancreatic juice. Deficiency may also lead to functional vitamin A deficiency because of impaired synthesis of retinol binding protein.
Vitamin Content of Danwake
The vitamin contents of danwake samples are presented in (Table 2) and their respective chromatograms as well as that of the mixture of their standards in Figures 1-8.
Table 2: Vitamins Content of Danwake Samples (mg /100 g) (Dry Weight).
| Sample | Thiamin | Riboflavin | Pyridoxine |
| Wheat danwake (0 % cowpea) | 2.33b | 1.23a | 1.23c |
| Sorghum danwake 5 % cowpea) | 0.69d | 1.31a | 0.86c |
| Sorghum danwake (7 % cowpea) | 2.07b | 1.37a | 1.93b |
| Sorghum danwake (11 % cowpea) | 1.79c | 1.19a | 1.71bc |
| Sorghum danwake (16 % cowpea) | 2.09b | 1.37a | 1.98b |
| Sorghum danwake (30 % cowpea) | 2.31b | 1.43a | 1.57bc |
| Cassava danwake (11 % cowpea) | 10.99a | 1.12a | 7.87a |
Values are means of three determinations and those within the same column not followed by the
Same superscripts are significantly (p < 0.05) different.
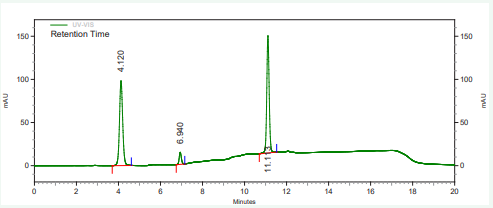
Figure 1: HPLC chromatogram of the mixture of standard vitamins B1, B2 and B6 .
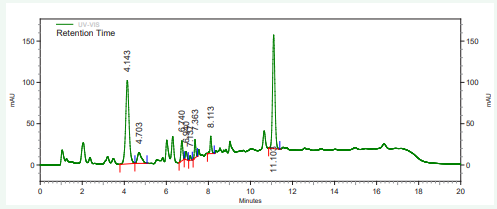
Figure 2: HPLC chromatogram of wheat danwake containing 0 % cowpea.
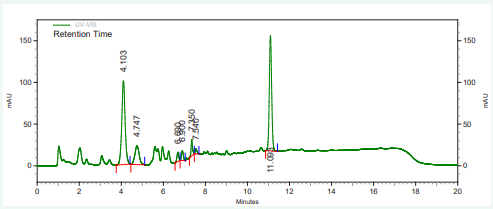
Figure 3: HPLC chromatogram of sorghum danwake containing 5% cowpea.
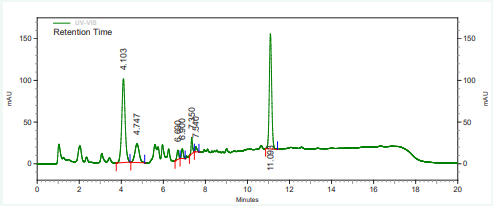
Figure 4: HPLC chromatogram of sorghum danwake containing 7 % cowpea.
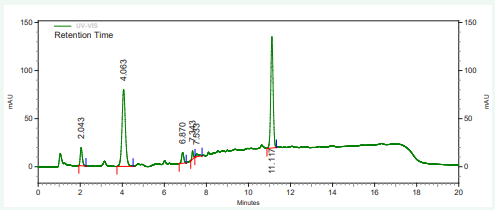
Figure 5: HPLC chromatogram of sorghum danwake containing 11 % cowpea.
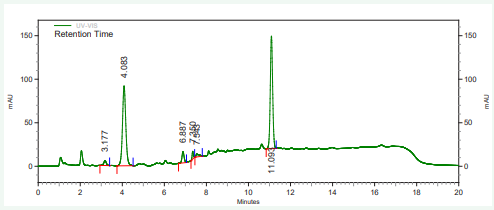
Figure 6: HPLC chromatogram of sorghum danwake containing 16 % cowpea.
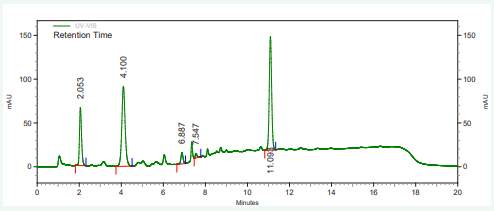
Figure 7: HPLC chromatogram of sorghum danwake containing 30 % cowpea.
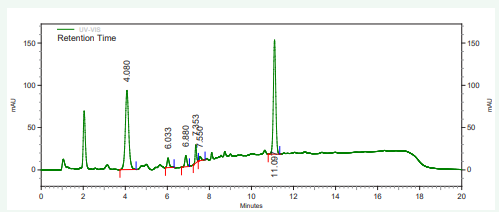
Figure 8: HPLC chromatogram of cassava danwake containing 11 % cowpea.
Vitamins investigated were, thiamin, riboflavin and pyridoxine. They were present at (0.6 to 10.99 mg/100 g), (1.12 to 1.43 mg/100 g) and (0.86 to 7.87 mg/100 g), respectively. Because of the unavailability of the standards of vitamins A, C and E their presence in danwake samples was not investigated.
Thiamin
The highest (10.99 mg/100 g) and the lowest (0.69 mg /100 g) thiamin contents were found in cassava danwake with 11 % cowpea and sorghum danwake containing 5 % cowpea, respectively. The vitamin was present in all of the investigated danwake samples. There was no significant difference (p > 0.05) among the thiamin content of wheat and sorghum with 7, 16 and 30 % cowpea danwake. Thiamin diphosphate is a coenzyme in metabolism of glucose and in the citric acid cycle. Thiamin tri phosphate has a role in nerve conduction. It helps to maintain normal nervous system activity and regulates muscle tone of the gastrointestinal tract. Deficiency, especially when associated with a carbohydrate-rich diet, results in the disease beriberi, degeneration of the sensory nerves in the hands and feet fast spreading through the limbs, with fluid retention and heart failure [5]. Relatively acute deficiency, especially associated with alcohol abuse, results in central nervous system damage, the Wernicke – Korsakoff syndrome. [7] reported that thiamin was found in unrefined cereals, cowpeas, meat (especially livers, kidneys, hearts and pork), yeasts, potatoes, peas and nuts. Cooking losses can be as much as 50 %.
Riboflavin
The riboflavin content of the danwake samples ranged from 1.43 mg /100 g to 1.23 mg /100 g. The highest and the lowest riboflavin contents were encountered in sorghum danwake (30 % cowpea) and cassava danwake (11 % cowpea), respectively. No significant difference (p > 0.05) was found among the riboflavin content of the different danwake samples. Coenzymes like, riboflavin phosphate (flavin mononucleotide), flavin adenine dinucleotide or covalently bound riboflavin at the active site of the enzyme, are used in a wide range of oxidation reactions of fats, carbohydrates and amino acids. Riboflavin-dependent enzymes are collectively known as flavor-protein Deficiency impairs energy-yielding metabolism and results in a group of symptoms known as ariboflavinosis, including cracking of the skin at the corners of the mouth (angular stomatitis), fissuring of the lips (cheilosis) and tongue changes (glossitis) as well as seborrhoeic accumulations appear around the nose and eyes [5]. These deficiency diseases are not fatal, because there is very efficient recycling of riboflavin in deficiency.
Pyridoxine
Cassava danwake with 11 % cowpea had the highest (7.87 mg / 100 g) pyridoxine content whereas, the lowest (0.86 mg /100 g) was found in sorghum danwake with 5 % cowpea. No significant differences were found among the pyridoxine content of all of the sorghum danwake except 5 % cowpea formulation. Pyridoxine is one of the three forms of vitamin B6 , the alcohol form, the others being pyridoxal (the aldehyde form) and pyridoxamine (the amine form). The relative proportion of each of the three forms in foods varies considerably. All are equally biologically active [7]. The active metabolite is pyridoxal 5¢-phosphate, which acts as a coenzyme in decarboxylation and transamination of amino acids, and in glycogen phos- phorylase, also a role in terminating the actions of steroid hormones [5]. Reported that dietary deficiency leading to clinical signs is not known in human beings. The pyridoxine content of the different danwake formulations except the wheat danwake with 0 % cowpea and sorghum danwake with 5 % cowpea are approximately equal or greater than the recommended daily allowance of 2 mg of the mineral.
CONCLUSIONS
The cadmium content in samples ranged from 0 to 4 mg/100 g. The highest amount of cadmium (4 mg/100 g) was obtained from sorghum danwake containing 5 % cowpea. Chromium content varied from 0.6 to 14.4 mg/100 g sample. The iron content of the samples of danwake ranged from 1 mg /100 g in wheat danwake with 0 % cowpea to 12.5 mg /100. g in sorghum danwake with 30 % cowpea, respectively. Lead was not found in samples. The manganese content of the samples of danwake varied from 0 to 12.8 mg/100 g. Sorghum danwake containing 7 % cowpea, had the highest potassium content of 226 mg / 100 g. Zinc content ranged from 0 to 8.6 mg /100 . Vitamins investigated were thiamin, riboflavin and pyridoxine. They were present at (0.6 to 10.99 mg/100 g), (1.12 to 1.43 mg/100 g) and (0.86 to 7.87 mg/100 g), respectively. Considering the mineral, vitamin contents and the cost of cowpea, the best formulation among the 7 developed was that of sorghum danwake with 16 % cowpea.
APPENDICES
Appendix 1: Cadmium (PAN Method Code 4017)
- The button of the spectrophotometer was pressed and held ON until it turned on;
- The PROGRAMED TESTS in the menu was selected after scrolling to it;
- Then ALL TESTS was selected;
- The figure 12 in the menu was selected for Cadmium determination;
- A cleaned tube (0290) was rinsed with distilled water and filled to the 10 ml line with distilled water;
- The tube was inserted into the chamber of the spectrophotometer and the lid closed. Then the SCAN BLANK in the menu selected;
- The tube was thereafter removed from the spectrophotometer, emptied and refilled with the sample to the 10 ml line.
- A 1.0 ml pipet (0354) was used to add 1.0 ml of Buffer Ammonia Reagent (4020) to the sample and the tube was swirled to mix;
- Two drops of Sodium Citrate, 10 % (6253) was added and the tube swirled to mix;
- A 0.5 ml pipet (0353) was used to add 0.5 ml of the PAN Indicator (4022) and the tube swirled to mix;
- A 0.5 ml pipet (0353) was used to add 0.5 ml of the Stabilizing Reagent (4022) and the tube capped and swirled to mix;
- The tube was immediately inserted into the chamber and the lid closed. The SCAN SAMPLE was selected and the result thereafter recorded;
- The OFF button was pressed to turn the spectrophotometer off and the EXIT button pressed to exit to a previous menu or make another menu selection.
Appendix 2: Chromium (Hexavalent; Diphenyl Carbohydrazide Method) Code 36 44 SC
From step 1 to 7 refers to cadmium determination. However, in step 4 scrolls to and select 22 for chromium instead of 12 for cadmium.
8. One level measure of Chromium Reagent Powder (V 6276) was added to the sample in tube using a 0.1 g spoon (0699). The tube was capped and shook for one min and allowed to stand for 3 min;
9. During the waiting period, a piece of filter paper was folded in half, then in half again to form a cone. The corners of the filter paper were pushed together to open end and inserted into funnel (0459);
10. The sample was filtered into a clean tube (0290) at the end of the 3 min waiting period. Then the tube was capped and shook to mix the sample. It was thereafter inserted into the chamber of the spectrophotometer and the lid closed. The SCAN SAMPLE was selected and the result obtained recorded;
11. The OFF button was pressed to turn the spectrophotometer off and the EXIT button pressed to exit to a previous menu or make another menu selection
Appendix 3: Iron (BIPYRIDYL Method- Code 3648-SC)
From step 1 to 7 refers to cadmium determination. However, in step 4 scrolls to and select 51 for Iron BIPYRIDYL instead of 12 for cadmium.
8. The 0.1 g spoon (0699) was used to add one measure of Iron Reducing Reagent (2777). The tube was capped and inverted 15 to 20 times to mix;
9. The cap was removed and 6 drops of Acid Phenanthroline Indicator (2776) added. The tube was capped, inverted 4 times to mix reagents and allowed to stand for 5 min for maximum color development;
10.After five min waiting period, the sample was mixed and the tube, inserted into the chamber of the spectrophotometer. The lid was closed, the SCAN SAMPLE selected and the obtained result recorded;
11.The OFF button was pressed to turn the spectrophotometer off and the EXIT button pressed to exit to a previous menu or make another menu selection.
Appendix 4: Lead (PAR Method – Code 4031)
From step 1 to 7 refers to cadmium determination. However, in step 4 scrolls to and select 54 for lead instead of 12 for cadmium.
1. The syringe (0807) was used to remove 5 ml of sample from the tube and the remaining of sample .discarded;
2. The 5 ml of sample in the syringe was added to the tube as well as 5 ml of Ammonium Chloride Buffer (4032) to fill the tube to the 10 ml line. The tube was swirled to mix the sample;
10. Three (3) drops of Sodium Cyanide, 10 % (6565) was added and the tube swirled to mix.
11. The 0.5 ml pipet (0353) was used to add 0.5 ml of PAR Indicator (4033) and the tube swirled to mix;
12.The 0.5 ml pipet (o353) was used to add 0.5 ml of the Stabilizing Reagent (4022). The tube was capped and the sample mixed;
13. The tube was inserted into the chamber, the lid closed, the SCAN SAMPLE selected and the result in ppm recorded as Reading A.
14. The tube was removed from spectrophotometer and 3 drops DDC Reagent (4034) added. The tube was capped and the sample mixed;
15. The tube was inserted into the chamber, the lid closed, the SCAN SAMPLE selected and the result in ppm recorded as Reading B; ppm lead = Reading A – Reading B
16. The OFF button was pressed to turn the spectrophotometer off and the EXIT button pressed to exit to a previous menu or make another menu selection.
Appendix 5: Manganese (Low Range, PAN MethodCode 3658-01-SC)
From step 1 to 7 refers to cadmium determination. However, in step 4 scrolls to and select 55 for manganese low range instead of 12 for cadmium.
8. The 1.0 ml pipet (0354) was used to add 2.0 ml (two measures) of Hardness Buffer Reagent (4255) to the tube which was swirled to mix.
9. Two (2) drops of Sodium Cyanide, 10% (6565) was added to the tube which was capped and swirled to mix the sample;
10. The 0.5 ml pipet (0369) was used to add 0.5 ml of Manganese Indicator Reagent (3956) and the tube capped and mixed;
11. The tube was immediately inserted into the chamber of the spectrophotometer, the lid closed, the SCAN SAMPLE selected and the obtained result recorded;.
12. The OFF button was pressed to turn the spectrophotometer off and the EXIT button pressed to exit to a previous menu or make another menu selection.
Appendix 6: Potassium (Tetraphenylboron MethodCode 3639-SC)
From step 1 to 7 refers to cadmium determination. However, in step 4 scrolls to and select 81 for potassium instead of 12 for cadmium;
8. Four (4) drops of Sodium Hydroxide, 1.0 N (4004 WT) was added to the tube which was capped and mixed;
9. The 0.05 g spoon (0696) was used to add one measure of tetraphenylboron Powder (6364). The tube was capped, shook vigorously until all the powder has dissolved and allowed to stand for 5 min;
10. The tube was mixed again after the 5 min waiting period to suspend any settled precipitate and immediately inserted into the chamber. The lid was closed, thet SCAN SAMPLE selected and the result recorded;
11. The OFF button was pressed to turn the spectrophotometer off and the EXIT button pressed to exit to a previous menu or make another menu selection.
Appendix 7: Zinc (ZINCON Method – Code 3667 –SC)
- Preparation of Dilute Zinc Indicator Solution:
1.1. A (0352) pipet was used to measure exactly 5.0 ml of Zinc Indicator Solution (6314) into 10 ml graduated cylinder (0416). The bottom of the curved surface (the meniscus) of the liquid was at 5.0 ml mark. This liquid was poured into the bottle labeled ‘Diluted Zinc Indicator Solution;
1.2. An unrinsed graduated cylinder was used to add 10.0 ml and then 7.8 ml (total of 17.8 ml) of Methyl alcohol (6319) to bottle labeled ‘Dilute Zinc Indicator Solution. The bottle was capped and the ingredients mixed.
DETERMINATION OF ZINC
From step 1 to 7 refers to cadmium determination. However, in step 4 scrolls to and select for zinc instead of 12 for cadmium. 8, A 0.1 g spoon (0699) was used to add one measure of Sodium Ascorbate Powder (6316). Then the 0.5 g spoon (0698) was used to add one measure of Zinc Buffer Powder (6315). T h e tube was capped and shook vigorously for 1 min;
9. Three (3) drops of Sodium Cyanide, 10% (6565) was added, the tube capped and mixed;
10. The 1 ml pipet assembly was used to add 1 ml of ‘Dilute Zinc Indicator Solution the tube capped and mixed;
11. A second plain pipet 0352) was used to add 4 drops of Formaldehyde Solution, 37 % (5128), the tube capped and mixed by inverting 15 times;
12. The tube was inserted into the chamber of the spectrophotometer, the lid close, the SCAN SAMPLE selected and the obtained result recorded;
13. The OFF button was pressed to turn the spectrophotometer off and the EXIT button pressed to exit to a previous menu or make another menu selection.
ACKNOWLEDGMENT
The research team is grateful to the International Sorghum and Millet Collaborative Research Program (INTSORMIL- CRP) for funding the Ph.D. program under which the activities leading to this publication have been conducted. We will also wish to thank the Distinguished Professor Hamaker B. R., Director of Whistler Center for Carbohydrate Research, Department of Food Science, Purdue University, West Lafayette Indiana Polis, USA and Professor Nkama, I., at the Department of Food Science and Technology of the University of Maiduguri, Nigeria, for their supervision, guidance and advice.
REFERENCES
2. Alkali, B. (2004). Studies on the production and acceptability of ‘danwake’ from cowpea, bambaranut, groundnut, sorghum and cassava. M.Sc. Thesis, Univ. of Maiduguri, Nigeria.
3. CRAWFORD SCIENTIFIC LC. Method Development Manual courtesy of Waters Corporation, pp. 164 (2007).
4. ISI (Indian Standards Institution) (1974). In: Study on Massa. Unpublished work. Nkama, I. Dept., Food Sci. and Technol. Univ. of Maiduguri, Nigeria. 1989.
6. PFA (Prevention of Food Adulteration Act) (1988). In: Study on Massa. Unpublished work. Nkama, I. Dept., Food Sci. and Technol. Univ. of Maiduguri, Nigeria. 1989.


