Multivariate Nutritional Assessment of Patients Awaiting Liver Transplant and Impact on Clinical Outcomes
- 1. Department of Dietetics, Apollo Hospitals, India
- 2. Department of Home Science, Women’s Christian College, India
- 3. Emeritus Professor, Massey University, Auckland, New Zealand
- 4. Department of Liver Transplantation, Apollo Hospitals, India
Abstract
Introduction: Disease-related malnutrition (DRM) is a frequently underestimated complication in end-stage liver disease (ESLD) patients awaiting liver transplantation (LT). This study aimed to assess the prevalence of malnutrition using multivariate tools and evaluate the impact of nutritional intervention on clinical outcomes.
Methods: A prospective, single-center study was conducted from October 2014 to April 2018 involving adult patients listed for LT who met the inclusion criteria and provided informed consent. Data collected included demographic details, clinical parameters, anthropometry, handgrip strength (HGS), dietary intake, and nutritional assessments. Statistical analysis was performed using SPSS version 25.0.
Results: Of 401 patients screened, 291 met the inclusion criteria and had complete data available, were included. The mean age was 49.9±8.5 years, with 84.5% men and 68.4% in Child-Turcotte-Pugh class C. The mean MELD score was 20.5±5.7, with 20.6% scoring >25. Based on mSGA, 85% were moderately malnourished and 4% severely malnourished (mean score 19.9±4.0). GLIM classified 66% as severely malnourished, while RFHGA identified 84.5% as moderately and 9.3% as severely malnourished. Mean HGS was 23.1±8.1 kg; BMI was 26.4±5.3 kg/m². Nutritional support significantly improved achievement of ≥80% energy (p<0.0001) and protein (p=0.0004) targets. Among 98 patients on the LT waiting list, 55.1% died during waiting period. Higher MELD scores, severe malnutrition by mSGA/RFHGA, and HGS <19.5 kg were significantly associated with pre-LT mortality (p<0.05). Step-wise logistic regression analysis indicated that baseline MELD >25 and low HGS were independent predictors of mortality.
Conclusion: Early identification and intervention for malnutrition significantly improve nutritional status and reduce pre-transplant mortality in ESLD
patients.
Keywords
• Disease related malnutrition
• Liver transplant
• Modified Subjective Global Assessment (mSGA)
• Global Leadership Initiative on Malnutrition (GLIM)
Citation
Lovesley D, John S, Hardy G, Ramamurthy A (2025) Multivariate Nutritional Assessment of Patients Awaiting Liver Transplant and Impact on Clinical Outcomes. J Hum Nutr Food Sci 13(2): 1201.
ABBREVIATION
DRM: Disease Related Malnutrition; ESLD: End-Stage Liver Disease; LT: Liver Transplant; CTP Child-Turcotte Pugh; MELD: Model for End-Stage Liver Disease; Msga: Modified Subjective Global Assessment; GLIM: Global Leadership Initiative on Malnutrition; RFHGA: Royal Free Hospital-Global Assessment; BMI: Body Mass Index; HGS: Handgrip Strength; SBP: Spontaneous Bacterial Peritonitis; HE: Hepatic Encephalopathy; CLD: Chronic Liver Disease; ONS: Oral Nutritional Supplement; MAC: Mid-Arm Circumference; TSF: Triceps Skinfold Measurement; MAMC: Mid-Arm Muscle Circumference; MAMA: Mid-Arm Muscle Area; EN: Enteral Nutrition; PN: Parenteral Nutrition; SPSS: Statistical Package for Social Science; DCLD: Decompensated Chronic Liver Disease; NASH: Non-Alcoholic Steatohepatitis; HCC: Hepatocellular Carcinoma; ETF: Enteral Tube Feeding; LVP: Large Volume Paracentesis; HRS: Hepatorenal Syndrome; GI: Gastrointestinal; VHPHC: Very High-Protein High-Calorie Supplementation
INTRODUCTION
Liver cirrhosis is a culmination of several chronic liver disorders and usually goes unnoticed until the onset of decompensation marked by ascites, bleeding, spontaneous bacterial peritonitis (SBP), hepatic encephalopathy (HE). The disease course usually progresses more rapidly towards death without liver transplantation (LT) [1]. In India, almost all of the cirrhotics (99.4%) had decompensation at the time of diagnosis [2]. Chronic liver disease (CLD) is a major contributor to global mortality, morbidity, and healthcare resource utilization [3]. In liver cirrhosis, the severity of protein-energy malnutrition is associated with increasing disease severity scores. About 20% of well-compensated disease patients are malnourished compared to >60% in advanced cirrhosis patients; >80% in decompensated liver disease reaching almost 100% in patients awaiting LT [4-7].
Disease related malnutrition (DRM) is one of the most under recognised problems of patients with ESLD awaiting a LT and is associated with a worse prognosis. It is recommended that patients awaiting LT undergo rapid nutritional screening and detailed nutritional assessment by a Clinical Dietitian using global assessment tools, a detailed dietary intake, and assessment of muscle mass [8]. Since the majority of liver transplants performed in India are from living donors where expediency is key, data regarding prevalence of nutritional deficits in patients with ESLD using multivariate assessment tools before LT and the influence of nutritional support on clinical outcomes are lacking.
The objectives of this study were;
- To assess the nutritional status and identify nutritional deficits in patients with end-stage liver disease (ESLD) undergoing evaluation for LT, using standard anthropometric measurements, the Modified Subjective Global Assessment (mSGA), biochemical and clinical indicators such as the Model for End-Stage Liver Disease (MELD) score and Child-Turcotte-Pugh (CTP) score, dietary intake (energy and protein), and functional assessment through handgrip strength (HGS).
- To plan and evaluate the efficacy of individualised nutrition support using either oral nutritional supplements (ONS) or enteral tube feed (nocturnal/continuous) according to the severity of deficit in spontaneous oral food intake of the patient.
MATERIALS AND METHODS
Consecutive patients evaluated for LT who met the inclusion criteria and provided informed consent were enrolled in the study between October 2014 and April 2018.
Inclusion Criteria: Patients who fulfilled the following criteria were included in the study. Each patient was enrolled only once.
i. Adults of both sex, aged between 18 and 60 years
ii. Patients enrolled for their first LT were considered eligible for the study.
Exclusion Criteria: Patients were excluded from the study if they met any of the following conditions:
i. Age below 18 years or above 60 years
ii. Pregnant or breastfeeding women
iii. Diagnosis of fulminant or subacute hepatic failure
iv. Presence of a mental condition that impaired comprehension of the study procedures.
The study protocol received approval from the hospital’s Institutional Ethics Committee.
SAMPLING TECHNIQUE
Purposive sampling technique was used, and those listed for LT were enrolled in this study according to the criteria for sample selection and consecutive patients who met the inclusion criteria were included.
Implementation of Nutrition Protocol – Pre Transplant Phase
During the pre-transplant phase, nutritional requirements were calculated with a goal of providing at least 35 kcal/kg of body weight per day and 1.2–1.5 g/kg/ day of protein8. Oral Nutrition Supplement (ONS) therapy was prescribed based on the patient’s nutritional status, individual needs, dietary intake, and eating habits. Once patients were enrolled for LT, the nutrition intervention was reinforced and continued up to the day prior to the transplant.
Customized nutritional intervention and individualized counseling
A personalized diet regimen was formulated for each patient in the Pre-LT phase according to the dietary restrictions and nutritional requirements considering their cultural and religious beliefs. The summary of intervention is given in (Table1). This method also helped to maintain an anabolic state before LT.
Data collection tool
All patients’ demographic data (age, sex, height, and body weight), a complete dietary history, physical examination, medical history (MELD and CTP score), and co-morbidities were documented. Furthermore, anthropometric measurements and biochemical parameters were also documented.
Table 1: Summary of the nutritional support protocol
|
Spontaneous oral intake |
Nutrition Support Protocol |
Dietary Habit/ Criteria |
Customized ONS prescription |
|
75% |
Oral Nutrition Supplement |
Vegetarian |
VHPHC |
|
<50% |
Nocturnal tube feed |
Ovo-vegetarian |
VHPHC |
|
<25% |
Continuous tube feed |
Non-vegetarian |
HPHC |
|
|
|
Obese patients |
VHPHC |
|
|||
|
Nutrition Intervention and monitoring |
|||
|
|||
NUTRITIONAL ASSESSMENT
The different tools used to assess nutritional status are as follows:
i. Anthropometric measurements:
Anthropometric measurements are imperative as they contribute to the basic descriptive information on nutritional status and body composition. They are related to energy intake, energy metabolism, physical activity, and metabolic efficiency [9]. The following anthropometric measurements were recorded:
a. Body mass index (BMI kg/m2): A BMI <18.5 kg/m2 is usually considered underweight. In case of fluid retention, bodyweight was calculated by subtracting a percentage of weight based upon severity of ascites (mild, 5%; moderate, 10%; severe, 15%), with an additional 5% subtracted if bilateral pedal edema as present. [8,10,11,12].
b. Mid-arm circumference (MAC, cm): MAC was measured at the midway between the tip of the acromion and the olecranon process on the non dominant side of the body by using a flexible, inelastic measuring tape [13].
c. Triceps skin fold measurement (TSF, mm): TSF was taken on the non-dominant side of the body, with the patients standing in a relaxed position, using a Slim Guide skinfold calliper [14].
d. Mid-arm muscle circumference (MAMC, cm): MAMC was calculated using the MAC and the TSF according to standard equations. MAMC = MAC (cm) – [0.314 × TSF (cm)] [15].
e. Mid-arm muscle area (MAMA, cm2): MAMA was calculated using the equation given below [16].
MAMA cm2 = MAC (cm)2 / 4π – 10 (men)
MAMA cm2 = MAC (cm)2 / 4π – 6.5 (women)
ii. Modified Subjective Global Assessment (mSGA) mSGA is a method for assessing nutritional status depending on a practitioner’s clinical judgment compared to objective, quantitative measurements. mSGA aims to identify an individual’s initial nutrition state using historical, symptomatic, and physical parameters, and analyses the factors impacting the progressive or regressive nutrition abnormalities. mSGA has been used to assess nutritional status in surgical and general medical patients, and it shows good convergent validity and good to excellent inter-observer reproducibility [17].
iii. Global Leadership Initiative on Malnutrition (GLIM) The GLIM is a new diagnostic framework that focuses on building a global consensus around diagnostic criteria for DRM in adults [18,19].
Weight loss, reduced BMI, and reduced muscle mass were categorized as phenotypic criteria, and reduced food intake/ assimilation and disease burden/ inflammation as etiologic criteria. For the diagnosis of DRM, GLIM recommends that the combination of at least one phenotypic criterion and one etiologic criterion is required. While only the phenotypic criteria are proposed for the severity grading that follows, the inclusion of the etiologic criteria for DRM diagnosis is deemed a priority to guide appropriate intervention and anticipated outcomes [20].
iv. Royal Free Hospital-Global Assessment (RFHGA) The RFHGA utilizes BMI, MAMC, and dietary intake for nutritional assessment.10 BMI is calculated using either objective scale weight or estimated dry weight when ascites or pedal edema are present. Estimated dry weight is adjusted as follows: subtract 5% of body weight for mild ascites, 10% for moderate ascites, and 15% for severe ascites. An additional 5% is subtracted if bilateral pedal edema is present [8,10].
Dietary intake is assessed using the diet history method and categorized into three groups:
- Adequate: Intake meets estimated requirements.
- Inadequate: Intake is below estimated requirements but exceeds 500 kcal /day.
- Negligible: Intake is 500 kcal/day or less [10,21].
Based on RFH-GA criteria, patients are classified as adequately nourished, moderately malnourished, or severely malnourished.
v. Biochemical and Clinical Evaluation
Prognostic models are useful for estimating disease severity and survival and can serve as helpful medical decision-making tools for guiding patient care. In patients with cirrhosis, the CTP classification22 and MELD scores have been established as the leading tools to predict mortality.23 The CTP is used to determine the prognosis, as well as necessity of LT and the MELD score is found to be useful in determining prognosis and prioritizing for receipt of a LT [23, 24].
vi. Dietary Evaluation
As part of the nutritional evaluation, a comprehensive dietary intake assessment was conducted. This included an in-depth review of food habits, use of nutritional supplements, number and timing of meals throughout the day, and detailed analysis of food and fluid consumption. Particular attention was given to assessing both the energy intake and the quality and quantity of protein consumed. Patients were asked to maintain a detailed food diary; for those unable to comply or follow instructions, multiple 24 hour dietary recalls were utilized as an alternative method.
The clinical dietitian assessed each patient’s spontaneous daily dietary intake during hospitalization and compared it to their individual nutritional requirements using calorie count methodology. Food and beverage consumption was visually estimated by nursing staff and documented in quartiles (0%, 25%, 50%, 75%, and 100%), a validated approach for estimating food intake [25]. During daily rounds, the clinical dietitian provided nutrition counselling or guidance to patients and/or nursing staff as needed.
Daily estimates of energy (caloric) and protein intake were documented by the clinical dietitian, who also made individualized recommendations to adjust the nutrition care plan based on these assessments. The primary objective was to evaluate the adequacy of caloric and protein intake while minimizing the risk of reporting bias. Caloric and protein values of foods and beverages were calculated using locally validated reference data [26].
For patients receiving nutritional support—either Enteral Nutrition (EN) or Parenteral Nutrition (PN)—the clinical dietitian conducted daily monitoring to evaluate nutritional adequacy, identify interruptions in feeding, and assess feed tolerance, making necessary modifications to the nutritional intervention accordingly.
vii. Functional Evaluation: Handgrip strength (HGS)
HGS was assessed using the Jamar Hydraulic Hand Grip Dynamometer (Patterson Medical Ltd), recognized as a sensitive indicator of body cell mass depletion [27]. Prior to the assessment, the procedure was clearly explained to each patient. Patients were seated either on a chair or in bed, with their arm positioned alongside the body and the forearm flexed at a 90° angle, unsupported [28]. The dominant hand was used to perform the test, and the mean value of three consecutive measurements was recorded.
II. Clinical Outcomes
During the pre-transplant phase, patients are frequently readmitted due to various complications. The reasons for readmission and the number of admission episodes were recorded. The mortality during the wait-listed period was also recorded.
STATISTICAL ANALYSIS
All data were analyzed using SPSS software version 25.0. Descriptive data were presented as frequencies and percentages for categorical variables, and as mean with standard deviation for parametric and laboratory variables. The Chi-square test and Mann–Whitney U test were used for comparing two groups of nonparametric data. Logistic regression analysis was performed to predict categorical outcomes based on selected predictor variables.
RESULTS
Patient characteristics and nutritional status
Out of 401 patients evaluated for LT, 319 met the inclusion criteria. Data from 291 patients were analyzed, while 27 were excluded due to incomplete data. The mean age of the patients was 49.9 ± 8.5 years (range: 19–60 years). The majority were male (85%), with females comprising 15% of the cohort. Baseline characteristics and nutritional status are detailed in (Table 2).
Table 2: Patient characteristics and nutritional status
|
Patient Characteristics (n=291) |
n (%) |
Mean±SD |
||
|
Age |
291(100%) |
49.9±8.5 |
||
|
Sex |
Male |
246 (84.5%) |
|
|
|
Female |
45 (15.5%) |
|
||
|
i. Anthropometric measurements |
Body Mass Index (BMI) |
Underweight (<18.5 kg/m2) |
12(4.1%) |
16.8±1.7 |
|
Normal (18.5-22.9 kg/m2) |
63(21.6%) |
21.1±1.2 |
||
|
Overweight (23-24.9 kg/m2) |
50(17.2%) |
23.8±0.7 |
||
|
Obese (≥25 kg/m2) |
166 (57%) |
29.9±4.2 |
||
|
Mid arm circumference (cm) |
26.2±4.4 |
|||
|
Triceps skinfold thickness (mm) |
11.4±6.0 |
|||
|
Mid arm muscle circumference (cm) |
22.6±3.2 |
|||
|
Mid arm muscle area (cm2) |
32.0±11.9 |
|||
|
ii. Subjective Global Assessment (SGA) |
Well nourished |
31(11%) |
12.4±1.6 |
|
|
Moderately malnourished |
248(85%) |
20.5±2.7 |
||
|
Severely malnourished |
12(4%) |
28.3±0.8 |
||
The most common indication for LT was alcohol-related decompensated chronic liver disease (DCLD), accounting for 35.1% of cases. This was followed by cryptogenic liver disease (21%), non-alcoholic steatohepatitis (NASH) (11.7%), viral hepatitis (10%), hepatocellular carcinoma (HCC) (14.4%), and other causes (7.9%), including autoimmune hepatitis, Wilson’s disease, Budd-Chiari syndrome, and primary or secondary biliary cirrhosis.
NUTRITIONAL ASSESSMENT
i. Anthropometric measurements
According to WHO Western Pacific Region: Asian Classification. (2000) [29], Body Mass Index (BMI) classification, 4.1% were under-weight, 21.6% had normal weight BMI, 17.2%were overweight, and 57% were obese (Table 2). The mean BMI was 26.4±5.3 kg/m2. In this cohort of 291 patients, 9.2% had a BMI of <20kg/m2.
The mean anthropometric measurements of the patients were MAC26.2±4.4cm; TSF 11.4±6.0mm; MAMC 22.6±3.2cm; and MAMA 32.0±11.9cm2.
ii. Subjective Global Assessment (mSGA)
In the present study, mSGA indicated 85% as moderately malnourished and 4% severely malnourished (Figure 1) during the LT evaluation with a mean mSGA score of 19.9±4.0.
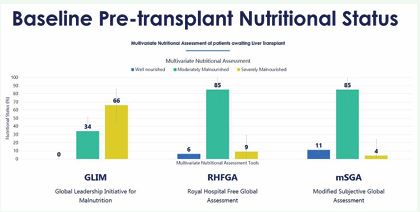
Figure 1: Baseline pre-transplant nutritional status using multivariate assessment tools
iii. Global Leadership Initiative on Malnutrition (GLIM)
The GLIM indicated 33.7% as moderately malnourished and 66.3% as severely malnourished.
iv. Royal Free Hospital-Global Assessment (RFHGA)
The RFHGA assessed 84.5% as moderately malnourished and 9.3% severely malnourished.
v. Biochemical and Clinical Evaluation
According to the CTP classification, during the initial nutritional evaluation, 68.4% belonged to CTP-C category, 28.2% in CTP-B, and 3.4% in CTP-A category. The mean MELD score was 20.4±5.7, and 20.6% had a MELD score of ≥25.
vi. Dietary Evaluation
Dietary habits of the patients indicated that 55.3% were non-vegetarian, 24.4% vegetarian, and 20.3% ova vegetarian. Regarding the route of feeding used in the nutrition support interventions: 92.8% were on ONS, 6.5% were fed using enteral tube feeding (ETF) along with oral diet, and 0.7% required exclusive ETF.
The prescribed energy and protein target and baseline intake during the evaluation were 2164.4±244.7kilocalories and 79.7±11.9g and 1295.7±320.1kilocalories and 38.5±12.2g, respectively. The average baseline energy and protein intakes were 60% and 49% of the target, respectively. The details of dietary evaluation including, food habits, route of feeding, and dietary intake, are presented in (Table 3).
Table 3: Baseline clinical and biochemical characteristics and dietary Intake
|
Clinical Parameters n=291 |
n (%) |
||
|
Child-Pugh Score α |
Child A |
10(3.4%) |
|
|
Child B |
82(28.2%) |
||
|
Child C |
199(68.4%) |
||
|
Biochemical Parameters |
Mean±SD |
||
|
MELD Score |
20.4±5.7 |
||
|
Food Habit |
Vegetarian |
71(24.4%) |
|
|
Ova-vegetarian |
59(20.3%) |
||
|
Non-vegetarian |
161(55.3%) |
||
|
Route of Feeding |
Oral |
270(92.8%) |
|
|
Enteral + Oral |
19(6.5%) |
||
|
Enteral |
2(0.7%) |
||
|
Oral Nutrition Supplement (ONS) |
HPHC ONS a |
152(52%) |
|
|
VHPHC ONS b |
139(48%) |
||
|
Dietary Intake |
Mean±SD |
||
|
Prescribed Energy (Calories) |
2164.4±244.7 |
||
|
Baseline Energy Intake (Calories) |
1295.7±320.1 |
||
|
Post Intervention Energy Intake (Calories) |
1645.3±252.3 |
||
|
Prescribed Protein (g) |
79.7±11.9 |
||
|
Baseline Protein Intake (g) |
38.5±12.2 |
||
|
Post Intervention Protein Intake (g) |
61.0±12.5 |
||
|
a HPHC, High-Protein High-Calorie Oral Nutrition Supplement b VHPHC, Very High-Protein High-Calorie Oral Nutrition Supplement |
|||
After the nutritional intervention, the mean energy and protein intake improved to 1645.3±252.3 kilocalories and 61.0±12.5g, respectively and approximately 77% of the energy and protein requirements.
a. Impact of nutrition intervention on dietary intake Managing the nutrition of patients with liver disease presents significant challenges. In patients with ESLD awaiting transplantation, oral intake—including ONS— serves as the first-line therapy to prevent and manage malnutrition. A comparison of baseline dietary intake and post-intervention data is provided in table 4 and (Figure 2).
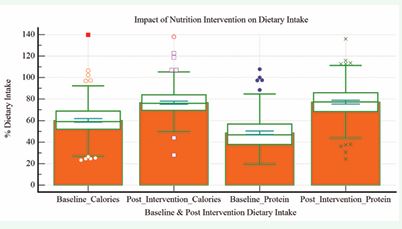
Figure: 2 Impact of nutrition intervention on dietary intake.
Following the intervention, there was a statistically significant increase in the proportion of patients achieving ≥80% of their energy (p < 0.0001) and protein targets (p = 0.0004), as shown in (Table 4).
Table 4: Comparison of baseline vs. post intervention dietary intake
|
Dietary intake |
Post intervention (n=291) |
?2 |
p-value |
|||||
|
≥80% |
<80% |
|||||||
|
n |
% |
n |
% |
|||||
|
Baseline |
Energy (%calories) |
≥80% |
19 |
95 |
1 |
5 |
30.2504 |
< 0.0001** |
|
<80% |
90 |
33.2 |
181 |
66.8 |
||||
|
Protein (%g) |
≥80% |
9 |
100 |
0 |
0.00 |
12.4648 |
0.0004** |
|
|
<80% |
115 |
40.8 |
167 |
59.2 |
||||
|
Significant at **p<0.01 level |
||||||||
vii. Functional Evaluation: Handgrip Strength (HGS) The mean baseline HGS of 291 patients who performed the functional assessment using a handgrip dynamometer was 23.1±8.1kg. Out of 291 patients who performed the test during nutritional assessment, 36.1% had values <19.5kg.
II. Clinical Outcome
i. Pre-transplant Readmission
During the wait-listed period, out of the 98 non transplanted patients, 36 (36.7%) were readmitted to hospital. The clinical and nutritional factors influencing pre-transplant readmissions were increasing baseline MELD score (p=0.035), weaker baseline HGS of <19.5kg (p=0.006), non-vegetarians (p=0.005) and very high protein high-calorie supplementation (VHPHC) (p=0.003). Out of the 115patients who required hospital readmission during the waiting period, 16 patients (44.4%) were readmitted once whereas 8 (22.2%) twice, 5 (13.9%) thrice, 5 (13.9%) four times, and 2(5.6%) five times readmission to hospital. The pre-transplant complications related to the readmission during the wait-listed period were large volume paracentesis (LVP) 14(38.9%), Hepatorenal Syndrome (HRS) 5(13.9%), Hepatic Encephalopathy (HE) 10(27.8%), Spontaneous Bacterial Peritonitis (SBP) 4(11.1%), and Gastrointestinal (GI) bleed 6(16.7%).
Post-intervention analysis indicated that patients who achieved ≥80% of their protein intake targets had significantly fewer readmissions due to LVP compared to non-achievers (p = 0.016). A weaker baseline HGS (25 with readmissions due to SBP (p<0.05) whereas patients on VHPHC supplementation had significantly lower incidence of HE and GI bleed (p<0.05).
ii. Mortality
Of the 319 patients evaluated for LT, 152 patients (47.6%) underwent LT in our transplant unit and 53 patients (16.6%) in other units and 98 patients (35.7%) were awaiting transplant Out of the 98 patients awaiting transplant, 44 patients (44.9%) were alive and 55 (55.1%) deceased during the waiting period. Univariate analysis of various preoperative clinical and nutritional parameters showed that pre transplant mortality was significantly associated with higher disease severity, including a baseline MELD score ≥25 (p < 0.001), malnutrition assessed by the mSGA (p = 0.032), RFHGA (p = 0.43), and weaker HGS <19.5 kg (p < 0.001).
Table 5: Binary Logistic Regression to predict pre-transplant mortality.
|
Predictor Variables |
B |
S.E. |
Wald |
df |
Sig. |
Exp(B) |
95% C.I.for EXP(B) |
|
|
Lower |
||||||||
|
Step 1a |
age |
-.060 |
.762 |
.006 |
1 |
.937 |
.942 |
.212 |
|
Sex |
-.210 |
1.332 |
.025 |
1 |
.875 |
.811 |
.060 |
|
|
Diagnosis |
.006 |
.229 |
.001 |
1 |
.979 |
1.006 |
.642 |
|
|
Child |
1.097 |
.852 |
1.658 |
1 |
.198 |
2.995 |
.564 |
|
|
Baseline MELD |
2.310 |
1.040 |
4.929 |
1 |
.026 |
10.074 |
1.311 |
|
|
Baseline BMI |
.501 |
.489 |
1.051 |
1 |
.305 |
1.651 |
.633 |
|
|
Baseline HGS |
3.781 |
1.026 |
13.570 |
1 |
<.001 |
43.848 |
5.866 |
|
|
Baseline mSGA |
.869 |
1.326 |
.429 |
1 |
.512 |
2.384 |
.177 |
|
|
Baseline RFHGA |
2.969 |
2.187 |
1.843 |
1 |
.175 |
19.464 |
.268 |
|
|
Baseline GLIM |
-.798 |
1.132 |
.498 |
1 |
.481 |
.450 |
.049 |
|
|
Food habits |
1.236 |
.846 |
2.136 |
1 |
.144 |
3.443 |
.656 |
|
|
ONS |
2.858 |
1.530 |
3.487 |
1 |
.062 |
17.420 |
.868 |
|
|
Baseline Calorie (%) |
-.222 |
1.936 |
.013 |
1 |
.909 |
.801 |
.018 |
|
|
Baseline Protein (%) |
18.555 |
21978.997 |
.000 |
1 |
.999 |
114351424.311 |
.000 |
|
|
Post Intervention Calorie (%) |
-.500 |
1.061 |
.222 |
1 |
.637 |
.607 |
.076 |
|
|
Post Intervention Protein (%) |
1.199 |
.872 |
1.891 |
1 |
.169 |
3.315 |
.601 |
|
|
Constant |
-80.767 |
44618.580 |
.000 |
1 |
.999 |
.000 |
|
|
Stepwise binary logistic regression analysis was conducted to determine independent predictors of pre transplant mortality (Table 5). Among all significant predictors identified in the univariate analysis—MELD score, mSGA, RFHGA, and HGS—only two remained independently associated with pre-transplant mortality in the multivariate model: a baseline MELD score >25 (odds ratio [OR] = 10.074; 95% confidence interval [CI] = 1.311 77.411) and HGS <19.5 kg (OR = 43.848; 95% CI = 5.866 327.767), both statistically significant at p < 0.01. Notably, 64.8% of non-survivors had HGS <19.5 kg, while 84.1% of survivors had HGS ≥19.5 kg.
DISCUSSION
The prevalence of malnutrition in our cohort was 89%, higher than the 79% reported in a comparable Canadian cohort awaiting LT. [30] Previous studies have demonstrated that both underweight (BMI 40 kg/m²) are associated with increased mortality and morbidity before LT [31 34]. Low BMI (<20kg/m2) has also been associated with reduced survival on the transplant waiting list [35]. The mean anthropometric measurements of our study cohort were comparable with alcoholic cirrhotics in a 1993 study conducted by Hirsch et al. [36]
The CTP-C category during listing in two other studies was 82% in the Egyptian cohort 37 and 27% in a European cohort [21], which were incomparable. The mean MELD score of this study, depicting the severity of the disease as illustrated by Gheorghe et al. [38]
The baseline dietary intake of this study population was 60% calories and 49% protein of the target. This is comparatively lower than 79.2% calories and 62.5% protein achieved by malnourished patients of the Egyptian cohort. The presence of cachexia in nearly 70% of patients with ESLD [39], likely explains the lower dietary intake in our study population
HGS measured using the Jamar Hydraulic Dynamometer indicated that HGS <19.5 kg was a strong predictor of mortality among LT candidates [40], and another study with alcoholic cirrhotics, found that <17.5kg was a predictor of mortality using Camrey’s mechanical handgrip dynamometer [41].
DRM has long been associated with adverse clinical outcomes, including a higher incidence of complications such as ascites, HE, infections [42] HRS, and diabetes mellitus. DRM remains a significant risk factor for both short- and long-term morbidity and mortality in patients before and after LT [43,44], and abdominal surgeries [45].
CONCLUSION
These data indicate that adult patients enrolling for LT are having higher disease severity scores, and nutritionally depleted with inadequate baseline energy, and protein intake and weak HGS, suggestive of declining muscle strength. This study concludes that early and timely comprehensive nutritional assessment and intervention helps to improve clinical outcomes in this vulnerable population.
ACKNOWLEDGEMENT
We express our sincere gratitude to the Principal, Women’s Christian College, Chennai, for the administrative support extended during the study period.
REFERENCES
- European Association for the Study of the Liver. EASL Clinical Practice Guidelines for the management of patients with decompensated cirrhosis. J Hepatol. 2018; 69: 406-460.
- Mukherjee PS, Vishnubhatla S, Amarapurkar DN, Das K, Sood A, Chawla YK, et al. Etiology and mode of presentation of chronic liver diseases in India: A multi centric study. PLoS One. 2017; 12: e0187033.
- Marcellin P, Kutala BK. Liver diseases: A major, neglected global public health problem requiring urgent actions and large-scale screening. Liver Int. 2018; 38: 2-6.
- Mendenhall CL, Anderson S, Weesner RE, Goldberg SJ, Crolic KA. Protein-calorie malnutrition associated with alcoholic hepatitis. Veterans Administration Cooperative Study Group on Alcoholic Hepatitis. Am J Med. 1984; 76: 211-222.
- Merli M, Romiti A, Riggio O, Capocaccia L. Optimal nutritional indexes in chronic liver disease. JPEN J Parenter Enteral Nutr. 1987; 11: 130S-134S.
- Porayko MK, DiCecco S, O’Keefe SJ. Impact of malnutrition and itstherapy on liver transplantation. Semin Liver Dis. 1991; 11: 305-314.
- Nutritional status in cirrhosis. Italian Multicentre Cooperative Projecton Nutrition in Liver Cirrhosis. J Hepatol. 1994; 21: 317-325.
- European Association for the Study of the Liver. EASL Clinical Practice Guidelines on nutrition in chronic liver disease. J Hepatol. 2019; 70: 172-193.
- Klipstein-Grobusch K, Georg T, Boeing H. Interviewer variability in anthropometric measurements and estimates of body composition. Int J Epidemiol. 1997; 26: S174-S180.
- Morgan MY, Madden AM, Soulsby CT, Morris RW. Derivation and validation of a new global method for assessing nutritional status in patients with cirrhosis. Hepatology. 2006; 44: 823-835.
- Tandon P, Ney M, Irwin I, Ma MM, Gramlich L, Bain VG, et al. Severe muscle depletion in patients on the liver transplant wait list: its prevalence and independent prognostic value. Liver Transpl. 2012; 18: 1209-1216.
- Tandon P, Low G, Mourtzakis M, Zenith L, Myers RP, Abraldes JG, et al. A Model to Identify Sarcopenia in Patients with Cirrhosis. Clin Gastroenterol Hepatol. 2016; 14: 1473-1480.e3.
- Lee RD, Nieman D. Nutritional Assessment, McGraw Hill, New York.2003.
- Durnin JV, Womersley J. Body fat assessed from total body density and its estimation from skinfold thickness: measurements on 481 men and women aged from 16 to 72 years. Br J Nutr. 1974; 32: 77-97.
- Frisancho AR. New standards of weight and body composition by frame size and height for assessment of nutritional status of adults and the elderly. Am J Clin Nutr. 1984; 40: 808-819.
- Heymsfield SB, McManus C, Smith J, Stevens V, Nixon DW. Anthropometric measurement of muscle mass: revised equations for calculating bone-free arm muscle area. Am J Clin Nutr. 1982; 36: 680- 690.
- Lovesley D, Sargunam S, Venkatesan B, Parmar K, Ravishankar L, Sai SU, et al. Modified Subjective Global Assessment Scoring System: Is it Reliable in Hospital Setting? Clinical Nutrition ESPEN. 2023; 54: 495-496.
- Contreras-Bolívar V, Sánchez-Torralvo FJ, Ruiz-Vico M, González- Almendros I, Barrios M, Padín S, et al. GLIM Criteria Using Hand Grip Strength Adequately Predict Six-Month Mortality in Cancer Inpatients. Nutrients. 2019; 11: 2043.
- Zhang Z, Wan Z, Zhu Y, Zhang L, Zhang L, Wan H. Prevalence of malnutrition comparing NRS2002, MUST, and PG-SGA with the GLIM criteria in adults with cancer: A multi-center study. Nutrition. 2021; 83: 111072.
- Cederholm T, Jensen GL, Correia MITD, Gonzalez MC, Fukushima R, Higashiguchi T, et al. GLIM criteria for the diagnosis of malnutrition - A consensus report from the global clinical nutrition community. Clin Nutr. 2019; 38: 1-9.
- Kalafateli M, Mantzoukis K, Choi Yau Y, Mohammad AO, Arora S, Rodrigues S, et al. Malnutrition and sarcopenia predict post-liver transplantation outcomes independently of the Model for End-stage Liver Disease score. J Cachexia Sarcopenia Muscle. 2017; 8: 113-121.
- Pugh RN, Murray-Lyon IM, Dawson JL, Pietroni MC, Williams R. Transection of the oesophagus for bleeding oesophageal varices. Br J Surg. 1973; 60: 646-649.
- Kamath PS, Wiesner RH, Malinchoc M, Kremers W, Therneau TM, Kosberg CL, et al. A model to predict survival in patients with end- stage liver disease. Hepatology. 2001; 33: 464-470.
- Kamath PS, Kim WR; Advanced Liver Disease Study Group. The modelfor end-stage liver disease (MELD). Hepatology. 2007; 45: 797-805.
- Olin AO, Osterberg P, Hådell K, Armyr I, Jerström S, Ljungqvist O. Energy-enriched hospital food to improve energy intake in elderly patients. JPEN J Parenter Enteral Nutr. 1996; 20: 93-97.
- Longvah, T, Ananthan, R, Bhaskarachary, K, Venkaiah, K, NationalInstitute of Nutrition, Indian Food Compostion Tables 2017.
- Figueiredo FA, Dickson ER, Pasha TM, Porayko MK, Therneau TM, Malinchoc M, et al. Utility of standard nutritional parameters in detecting body cell mass depletion in patients with end-stage liver disease. Liver Transpl. 2000; 6: 575-581.
- Vaz M, Thangam S, Prabhu A, Shetty PS. Maximal voluntary contraction as a functional indicator of adult chronic undernutrition. Br J Nutr. 1996; 76: 9-15.
- WHO Western Pacific Region, IASO International Association for the study of obesity. The Asia-Pacific perspective: Redefining obesity and its treatment. Geneva, Switzerland: World Health Organization. 2000.
- Marr KJ, Shaheen AA, Lam L, Stapleton M, Burak K, Raman M.Nutritional status and the performance of multiple bedside tools for nutrition assessment among patients waiting for liver transplantation: A Canadian experience. Clin Nutr ESPEN. 2017; 17: 68-74.
- Keeffe EB, Gettys C, Esquivel CO. Liver transplantation in patientswith severe obesity. Transplantation. 1994; 57: 309-311.
- Sawyer RG, Pelletier SJ, Pruett TL. Increased early morbidity and mortality with acceptable long-term function in severely obese patients undergoing liver transplantation. Clin Transplant. 1999; 13: 126-130.
- Nair S, Verma S, Thuluvath PJ. Obesity and its effect on survival in patients undergoing orthotopic liver transplantation in the United States. Hepatology. 2002; 35: 105-109.
- Dick AA, Spitzer AL, Seifert CF, Deckert A, Carithers RL Jr, Reyes JD, et al. Liver transplantation at the extremes of the body mass index. Liver Transpl. 2009; 15: 968-977.
- Pelletier SJ, Schaubel DE, Wei G, Englesbe MJ, Punch JD, Wolfe RA, et al. Effect of body mass index on the survival benefit of liver transplantation. Liver Transpl. 2007; 13: 1678-1683.
- Hirsch S, Bunout D, de la Maza P, Iturriaga H, Petermann M, Icazar G, et al. Controlled trial on nutrition supplementation in outpatients with symptomatic alcoholic cirrhosis. JPEN J Parenter Enteral Nutr. 1993; 17: 119-124.
- Monsef WA, Mostafa I, Zaky D, Assessment of the nutritional status of the Egyptian patient with end stage liver disease prior to liver transplantation. Open J Gastroenterol. 2014; 4: 159-169.
- Gheorghe L, Iacob S, Iacob R, Gheorghe C, Popescu I. Variation of the MELD score as a predictor of death on the waiting list for liver transplantation. J Gastrointestin Liver Dis. 2007; 16: 267-272.
- Cruz RJ Jr, Dew MA, Myaskovsky L, Goodpaster B, Fox K, Fontes P, et al. Objective radiologic assessment of body composition in patients with end-stage liver disease: going beyond the BMI. Transplantation. 2013; 95: 617-622.
- Daphnee DK, John S, Vaidya A, Khakhar A, Bhuvaneshwari S, Ramamurthy A, et al. Hand grip strength: a reliable, reproducible, cost-effective tool to assess the nutritional status and outcomes of cirrhotics awaiting liver transplant. Clinical Nutrition ESPEN. 2017; 19: 49-53.
- Gaikwad NR, Gupta SJ, Samarth AR, Sankalecha TH. Handgrip dynamometry: a surrogate marker of malnutrition to predict the prognosis in alcoholic liver disease. Ann Gastroenterol. 2016; 29: 509-514.
- DiCecco SR, Wieners EJ, Wiesner RH, Southorn PA, Plevak DJ, Krom RA. Assessment of nutritional status of patients with end-stage liver disease undergoing liver transplantation. Mayo Clin Proc. 1989; 64: 95-102.
- Gunsar F, Raimondo ML, Jones S, Terreni N, Wong C, Patch D, et al. Nutritional status and prognosis in cirrhotic patients. Aliment Pharmacol Ther. 2006; 24: 563-572.
- Sam J, Nguyen GC. Protein-calorie malnutrition as a prognostic indicator of mortality among patients hospitalized with cirrhosis and portal hypertension. Liver Int. 2009; 29: 1396-1402.
- Kondrup J. Nutrition in end stage liver disease. Best Pract Res ClinGastroenterol. 2006; 20: 547-560.


