The Association between Complementary Foods and Hemoglobin Concentrations in Indian Infants
- 1. Nestlé Research Center, Vers-chez-les-Blanc, Switzerland
- 2. Department of Neonatology, Sir Ganga Ram Hospital, India
- 3. Nestlé Nutrition Institute India, India
Abstract
Background: The prevalence of iron deficiency anemia continues to be high among Indian infants. The introduction of appropriate types of complementary foods after the age of 6 months is critical for reducing the prevalence of iron deficiency and iron deficiency anemia.
Objective: The aim of this study was to identify which complimentary food groups correlate with hemoglobin (a commonly used indicator for iron deficiency anemia) in Indian infants during the critical period of 6-23 months based on data from the Indian National Family Health Survey 2005-2006 (NFHS-3). Methods: We performed multiple regression analyses to study the association between hemoglobin concentrations and various food groups, while controlling for household, maternal and socio-demographic variables.
Findings: The categories of foods consumed by infants aged 6-23 months had a significant association with hemoglobin levels. “Fortified baby food”, “breast milk” and “infant formula” showed positive and statistically-significant associations with hemoglobin concentrations, as well as “fruits and vegetables” to a lesser extent. On the contrary, “porridge or gruel”, “dried beans, peas, lentils and nuts”, “bread, rice, noodles” and “milk and dairy products” had a significant negative association with hemoglobin levels. Infants between 12-17 months of age had the highest rates of moderate or severe anemia compared to those aged 6-11 or 18-23 months.
Conclusions: Population, health and nutrition survey data as collected in the NFHS-3 in India are consistent with systematic reviews, that fortified complementary foods can be considered as effective nutritional interventions to address anemia in infants aged 6-23 months.
Keywords
• Complementary feeding
• fortified baby food
• Infant feeding practices
• Anemia
• Hemoglobin
• Iron
• Breastfeeding
Citation
Prieto-Patron A, Hutton ZV, Garg P, Rao S, Eldridge AL, et al. (2017) The Association between Complementary Foods and Hemoglobin Concentrations in Indian Infants. J Hum Nutr Food Sci 5(1): 1105.
ABBREVIATIONS
DALYs: Disability Adjusted Life Years; DHS: Demographic and Health Survey; Hb: Hemoglobin; ICSD: Integrated Child Development Scheme; IDA: Iron Deficiency Anemia; NFHS: National Family Health Survey; OLS: Ordinary Least Square
INTRODUCTION
Worldwide, iron deficiency anemia (IDA) is one of the most common nutritional deficiencies, with well documented consequences, and children below 5 years are the most severely affected sub-group [1,2]. In 2010 the global prevalence of IDA was 32.9%, outweighing that of major depression, chronic respiratory diseases, and all injuries [3].
Although infants aged 6-23 months are not often considered a distinct population in global estimates of IDA, current evidence indicates that this group is at very high risk [4]. Importantly, IDA that occurs during this critical window of development has adverse effects on the physical, cognitive and behavioral development of children and may have long-term consequences in terms of physical productivity and reproductive outcomes in later life [4,5].
Despite the efforts of a national iron supplementation program and home fortification in India, a high IDA prevalence remains among infants. Data from the National Family Health Survey of 2005-2006 (NHFS-3) indicated that over 80 per cent of infants aged 6-23 months were anemic, the majority, 49.5% affected by IDA [6,7]. In this age-group IDA represents the third largest disease burden, with an estimated annual cost of US$23.8 billion with respect to future production losses, alongside 6.9 million Disability Adjusted Life Years (DALYs) [7].
The potentially irreversible health consequences and significant cost burden associated with IDA underscore the urgency of targeting infants and young children in order to curb the long-term effects of IDA.
In normal, full-term newborns of healthy mothers, iron requirements are met largely through endogenous iron stores and breast milk [4]. At the age of 6 months, however, the infant’s iron needs begin to exceed that which is provided by breast milk, rendering infants more vulnerable to iron deficiency [8,9]. This results in the depletion of internal iron stores, putting infants at risk of developing IDA [10]. Due to the low iron content of breast milk, additional sources of iron are needed to meet the infant’s increased iron needs during this time, and the introduction of complementary foods is necessary [11]. Since the period when infants are at greatest risk of IDA overlaps with the period of transitioning to complementary feeding from exclusive breastfeeding, the quality of complementary feeding is of utmost importance for meeting an infant’s iron needs [12,13]. In India, national figures show that up to 6 months of age, 95% of infants are breast-fed, and the diversification of the diet increases after 9 months of age [6]. This is unlike some other developing regions, such as parts of Africa, where a lower percentage of infants are breastfed and complementary feeding begins much earlier than the recommended 6 months [12,14]. In South Asia, the factors that contribute towards iron deficiency amongst infants are prolonged exclusive breastfeeding alongside the delayed introduction of complementary foods (which are often of poor quality) [15-17]. Zlotkin et al., have shown that although multi factorial, the main contributor towards iron deficiency in Indian infants is the consumption of foods low in bioavailable iron [17]. This problem is confounded by a low dietary diversity and diet quality [16]. Other maternal and household factors, such as the mother’s education and household wealth, also influence complimentary feeding practices and the types of foods infants receive [16,18]. A recent systematic review of 18 trials found that the use of iron plus multiple micronutrient-fortified milk and cereal products increased hemoglobin levels by 8.7 g/L in children aged 6 months to 5 years and reduced the risk of anemia by 57%, compared to non-fortified items [19]. These findings are similar to that reported by Das et al., in 2013 [15]. Therefore quantifying the effects of these diverse feeding practices on infant health outcomes, including hemoglobin levels, is essential for informing public health policy-makers on this important modifiable risk factor for infant growth and development.
Systematic reviews confirm the effectiveness of fortified complimentary foods, such as milk and cereals, among infants to reduce the risk of IDA. However, no previous study analyzed if the consumption of different complimentary foods are associated accordingly with hemoglobin levels (widely used as a proxy to estimate the prevalence of IDA).
Given the persistent high prevalence of IDA among infants in India the aim of this study was to evaluate the association between different types of complementary foods and hemoglobin concentrations in Indian infants aged 6-23 months.
MATERIALS AND METHODS
We compared the hemoglobin concentrations of Indian infants (aged 6-23 months) with their consumption of 12 different categories of complementary foods, in order to identify the association between each food category and this key iron parameter.
This analysis uses the NFHS-3 dataset of India, a household survey which collected data from a nationally representative sample of 109,041 households on demographic, anthropometric, health and infant feeding variables. The NFHS is another name for the international Demographic and Health Survey (DHS) [20]. Data on the types of foods given to the infants in this dataset is based on a food consumption questionnaire referring to the previous 24 hours. NFHS-3 equally contains information on hemoglobin concentrations from blood tests performed on 9,968 infants aged 6-23 months, using a HemoCue instrument [6]. The HemoCue analyzer has been used extensively in order to estimate hemoglobin concentrations from blood samples obtained in the field using finger prick (or heel prick), and yields results comparable to those obtained from other test systems [21]. All analysis in this study uses the same data set.
The main explanatory variable was hemoglobin concentration (in grams per liter) for the infants in our sample. Data on the hemoglobin concentrations were analyzed using a linear regression model according to 12 food categories, and 15 control variables including infant, maternal and household socio-economic factors. First, we ran ordinary least square (OLS) multivariate regressions on the hemoglobin levels. This analysis method was chosen because hemoglobin is a continuous variable. The OLS regression was supplemented with quantile regression. This method was used to explore whether the relation identified with OLS was consistent across the hemoglobin distribution. This analysis allows to capture, for example, if a specific food group after controlling for infant, mother and household characteristics, shows a positive association at lower hemoglobin levels, but a negative association with higher hemoglobin levels and vice versa. If such a case is revealed it indicates that the food group is likely to influence hemoglobin levels differently among less or more anemic infants. The quantile regression model splits the population distribution of hemoglobin levels into quintiles with 0.2, 0.4, 0.6 and 0.8 point estimates which correspond to 86, 95, 102 and 110 g/L hemoglobin levels, respectively.
In the analysis we also performed a logistic regression analyses to estimate the odds ratio of becoming anemic or moderately/ severely anemic in association with the food categories to confirm the validity of finding. For the purposes of running the logistic regression hemoglobin needs to be transformed into a dichotomous variable. In this analysis we used WHO (equivalent sea level) hemoglobin concentration thresholds of 110 g/l, 100 g/l and 70 g/l to categorize mild, moderate and severe anemia that apply to children 6 to 59 months of age [22]. In the Annex of this article we provide results for the logistic regression for moderate anemia, the threshold associated with cognitive impairment. Results of the logistic regression confirm results of the regressions presented in this article.
Annex Table: Odds Ratio for food groups and control variables for moderately anemic infants.
|
|
Age 6-23 months N=9,968 |
Age 6-11 months N=3,254 |
Age 12-17 months N=3,499 |
Age 18-23 months N=3,215 |
|
Variables |
Odds Ratio (95% confidence interval) |
Odds Ratio (95% confidence interval) |
Odds Ratio (95% confidence interval) |
Odds Ratio (95% confidence interval) |
|
Food group consumed (24 hour prior to interview) |
||||
|
Breast milk |
0.86** |
0.83 |
0.92 |
0.81** |
|
|
(0.76, 0.98) |
(0.61, 1.13) |
(0.74, 1.15) |
(0.67, 0.97) |
|
Infant formula |
0.80*** |
0.67*** |
0.91 |
0.82 |
|
|
(0.69, 0.93) |
(0.53, 0.86) |
(0.71, 1.18) |
(0.62, 1.08) |
|
Fortified baby food |
0.87** |
0.96 |
0.73*** |
0.87 |
|
|
(0.77, 0.99) |
(0.77, 1.19) |
(0.59, 0.91) |
(0.69, 1.11) |
|
Fruit and vegetables |
0.91* |
1.05 |
0.93 |
0.80*** |
|
|
(0.83, 1.00) |
(0.87, 1.26) |
(0.79, 1.08) |
(0.67, 0.95) |
|
Meats, poultry, fish, eggs |
0.94 |
0.84 |
1.11 |
0.91 |
|
|
(0.82, 1.07) |
(0.62, 1.14) |
(0.90, 1.37) |
(0.74, 1.11) |
|
Potatoes & other tubers |
0.91* |
0.93 |
0.89 |
0.92 |
|
|
(0.82, 1.01) |
(0.72, 1.21) |
(0.75, 1.06) |
(0.77, 1.09) |
|
Porridge or gruel |
1.24*** |
1.23** |
1.21** |
1.24** |
|
|
(1.11, 1.38) |
(1.02, 1.50) |
(1.01, 1.45) |
(1.02, 1.49) |
|
Bread, rice, noodles |
1.11* |
1.11 |
1.02 |
1.18 |
|
|
(1.00, 1.24) |
(0.94, 1.30) |
(0.84, 1.25) |
(0.93, 1.49) |
|
Milk and dairy products |
1.03 |
1.03 |
1.05 |
0.97 |
|
|
(0.94, 1.13) |
(0.88, 1.21) |
(0.90, 1.23) |
(0.82, 1.15) |
|
Tea or coffee |
1.03 |
1.06 |
1.02 |
1.06 |
|
|
(0.94, 1.14) |
(0.87, 1.28) |
(0.87, 1.19) |
(0.89, 1.24) |
|
Dried beans, peas, lentils & nuts |
1.17** |
1.16 |
1.11 |
1.22* |
|
|
(1.02, 1.34) |
(0.85, 1.60) |
(0.88, 1.39) |
(0.98, 1.52) |
|
Oil and fats |
1.08 |
0.90 |
1.07 |
1.19* |
|
|
(0.95, 1.23) |
(0.67, 1.21) |
(0.87, 1.31) |
(0.97, 1.46) |
|
Control variables |
|
|
|
|
|
Infant characteristics |
||||
|
Low birth weight |
1.17*** |
1.17** |
1.24*** |
1.11 |
|
|
(1.07, 1.28) |
(1.00, 1.37) |
(1.06, 1.44) |
(0.94, 1.31) |
|
Female child |
0.75*** |
0.76*** |
0.73*** |
0.74*** |
|
|
(0.69, 0.81) |
(0.66, 0.88) |
(0.63, 0.84) |
(0.64, 0.86) |
|
Age of child (6-11 months as reference) |
||||
|
12-17 months |
1.22*** |
|
|
|
|
|
(1.10, 1.36) |
|
|
|
|
18-23 months |
1.04 |
|
|
|
|
|
(0.92, 1.17) |
|
|
|
|
Iron supplementation during |
1.08 |
0.94 |
1.03 |
1.34* |
|
pregnancy |
(0.90, 1.29) |
(0.67, 1.31) |
(0.77, 1.37) |
(0.97, 1.85) |
|
Deworming medication use |
0.92 |
1.59** |
0.86 |
0.94 |
|
|
(0.79, 1.07) |
(1.01, 2.50) |
(0.67, 1.10) |
(0.75, 1.18) |
|
Maternal characteristics |
||||
|
Young mother (age <18 years) |
1.08 |
1.06 |
1.18* |
1.02 |
|
|
(0.98, 1.20) |
(0.88, 1.27) |
(0.98, 1.41) |
(0.85, 1.22) |
|
Primary education |
0.98 |
0.82* |
1.24* |
0.91 |
|
|
(0.85, 1.12) |
(0.64, 1.03) |
(0.98, 1.57) |
(0.72, 1.16) |
|
Secondary or higher education |
0.84*** |
0.79** |
0.87 |
0.83 |
|
|
(0.74, 0.94) |
(0.64, 0.98) |
(0.71, 1.06) |
(0.67, 1.04) |
|
Currently working |
0.91* |
0.90 |
0.86* |
0.99 |
|
|
(0.83, 1.01) |
(0.75, 1.08) |
(0.72, 1.02) |
(0.83, 1.18) |
|
Wanted pregnancy |
0.90** |
0.83** |
1.04 |
0.82** |
|
|
(0.81, 1.00) |
(0.69, 0.99) |
(0.88, 1.24) |
(0.68, 0.99) |
|
Iron during pregnancy |
1.09* |
1.16 |
1.13 |
0.99 |
|
|
(0.98, 1.20) |
(0.97, 1.38) |
(0.95, 1.34) |
(0.83, 1.18) |
|
Anemic mother |
1.80*** |
1.67*** |
1.86*** |
1.98*** |
|
|
(1.65, 1.96) |
(1.43, 1.94) |
(1.61, 2.15) |
(1.70, 2.31) |
|
Ever smoked |
1.10 |
1.08 |
1.29** |
0.93 |
|
|
(0.95, 1.27) |
(0.84, 1.40) |
(1.01, 1.66) |
(0.72, 1.21) |
|
Household characteristics |
||||
|
Wealth percentile |
0.99*** |
1.00 |
0.99*** |
0.99*** |
|
|
(0.99, 1.00) |
(0.99, 1.00) |
(0.99, 1.00) |
(0.98, 0.99) |
|
Urban household |
0.96 |
0.82** |
0.90 |
1.25** |
|
|
(0.86, 1.07) |
(0.68, 1.00) |
(0.75, 1.08) |
(1.02, 1.54) |
|
Flush toilet |
0.98 |
1.04 |
0.95 |
0.97 |
|
|
(0.87, 1.11) |
(0.84, 1.29) |
(0.77, 1.18) |
(0.77, 1.22) |
|
*** p<0.01, ** p<0.05, * p<0.1 |
||||
|
Most infants in the National Family Health Survey (2005-06) in India were moderately anemic (hemoglobin <100g/l), therefore we show here results of the logistic regression for this group for the various food groups consumed and the maternal, infant and household control variables. |
||||
The 12 categories of foods included in our analysis are similar to those used by Patel et al. [16]. However, we did not pool iron-rich food categories with the equivalent food categories that were not iron-rich. We divided the foods into the following 12 categories: “breast milk,” “infant formula,” “milk and dairy products,” “tea or coffee,” “fortified baby food,” “porridge or gruel,” “bread, rice, noodles,” “potatoes & other tubers,” “fruits & vegetables,” “meat, poultry, fish, eggs,” “dried beans, peas, lentils, nuts” and “oil and fats.” These categories follow the NFHS3 categorization, but a few similar food items were grouped into related categories in order to obtain a more substantial and meaningful number of observations (Table 1). Data on the food categories were directly available from the food consumption survey of the NFHS-3 and the questionnaires used are available in the report [6].
Table 1: Classification of food groups for the current analysis based on the 2005-06 National Family and Health Survey (NFHS-3)
|
Q471: Are you still breastfeeding (baby name)? |
Breast milk |
|
Q479: Now I would like to ask you about liquids (baby) drank yesterday during the day or at night |
|
|
a. Plain water? |
Not used |
|
b. Commercially produced infant formula? |
Infant formula |
|
c. Any other milk such as tinned, powdered, or fresh animal milk? |
Milk and dairy products |
|
d. Fruit juice? |
Fruits and vegetables |
|
e. Tea or coffee? |
Tea or coffee |
|
Q480 …ate yesterday during the day or at night, either separately or combined with other foods. |
|
|
a. Any porridge or gruel? |
Porridge or gruel |
|
b. Any commercially fortified baby food such as Cerelac or Farex? |
Fortified baby food |
|
c. Any bread, roti, chapati, rice, noodles, biscuits, idli, or any other foods made from grains? |
Bread, rice, noodles |
|
d. Any pumpkin, carrots, or sweet potatoes that are yellow or orange inside? |
Fruits and vegetables |
|
e. Any white potatoes, white yams, cassava, or any other foods made from roots? |
Potatoes & other tubers |
|
f. Any dark green, leafy vegetables? |
Fruits and vegetables |
|
g. Any ripe mangoes, papayas, cantaloupe, or jackfruit? |
Fruits and vegetables |
|
h. Any other fruits or vegetables? |
Fruits and vegetables |
|
i. Any liver, kidney, heart or other organ meats? |
Meats, poultry, fish, eggs |
|
j. Any chicken, duck or other birds? |
Meats, poultry, fish, eggs |
|
k. Any other meat? |
Meats, poultry, fish, eggs |
|
l. Any eggs? |
Meats, poultry, fish, eggs |
|
m. Any fresh or dried fish or shellfish? |
Meats, poultry, fish, eggs |
|
n. Any foods made from beans, peas, or lentils? |
Dried beans, peas, lentils & nuts |
|
o. Any nuts? |
Dried beans, peas, lentils & nuts |
|
p. Any cheese, yogurt or other milk products? |
Milk and dairy products |
|
q. Any food made with oil, fat, ghee or butter? |
Oil and fats |
|
r. Any other solid or semi-solid food? |
Not used |
|
Question in NFHS-3 |
Food category for reporting results |
In addition to food categories, the control variables used in the multivariate linear regression analysis were related to infant, maternal and household characteristics. The rationale behind the choice of these variables was that the high prevalence of IDA among children can be attributed to numerous factors, such as limited iron stores at birth (which is itself associated with the length of the gestational period and the birth weight), timing of umbilical cord clamping, complementary foods and frequency of infections [23].
With respect to the infant, we included variables controlling for low birth weight, gender, age (divided into three groups: 6-11, 12-17, 18-23 months), and as a proxy for the access to health care services, the use of iron supplementation and de worming medication. Low birth weight is a good indicator of child health at birth and frequently exhibits a highly significant association with hemoglobin status in the first years of life [24]. However, data on this variable were not available for the entire sample. Missing data was imputed (for approximately 60% of the sample) using the mother’s description of the size of the baby at birth. In order to evaluate the effect of the imputations on findings, we also ran the analysis using only the non-imputed sample (results of this are not reported here separately as they were affirmative).
Regarding maternal variables, we included 8 dichotomous variables: “young mother,” “primary education,” “secondary or higher education,” “currently working,” “wanted pregnancy,” “iron taken during pregnancy,” “anemic mother” and “ever smoked.” The “young mother” variable was assigned a value of 1 if the woman became a mother for the first time before the age of 18 years. We did not take into account marital status, as more than 95% of the mothers were married and therefore this variable was not statistically relevant. The reason we included the first five variables was to control for the capacity of the mother to offer better conditions for her child. The “iron taken during pregnancy” and “anemic mother” variables were included to assess to what extent the mother’s iron status affects the infant’s anemia status. Smoking as a variable was considered as it can affect the overall health of the baby [25].
The household characteristics that were taken into consideration were: wealth index, urban household and the availability of a flush toilet. In addition, we considered geographical heterogeneity by using geographic dummy variables.
RESULTS
The primary focus of our analysis was to identify which food categories were associated with hemoglobin measures, if any, and whether the association was positive or negative. The multivariate analysis equally considered infant, maternal and household variables, their association with the hemoglobin levels and to what extent, if any, they influenced the association observed with the food groups.
Table (2) summarizes descriptive variables for the population of infants included in our study (6-23 months).
Table 2: Descriptive statistics for the study sample
|
Age |
6-23 months |
6-11 months |
12-17 months |
18-23 months |
|
||||
|
Variable |
N=9,968 |
N=3,254 |
N=3,499 |
N=3,215 |
|
||||
|
Hemoglobin concentration |
g/L, weighted mean* |
|
|
|
|
||||
|
Hemoglobin |
96.42 |
98.15 |
95.06 |
96.15 |
|
||||
|
Infant characteristics |
%, weighted mean* |
|
|
|
|||||
|
Low birth weight |
28.9 |
|
|
|
|||||
|
Female child |
46.8 |
|
|
|
|||||
|
12 to 17 months |
34.8 |
|
|
|
|||||
|
18 to 23 months |
32.8 |
|
|
|
|||||
|
Iron supplementation |
4.7 |
|
|
|
|||||
|
Deworming medication |
7.8 |
|
|
|
|||||
|
Maternal characteristics |
%, weighted mean* |
|
|
|
|||||
|
Young mother (<18 years) |
30.8 |
|
|
|
|||||
|
Primary education |
13.9 |
|
|
|
|||||
|
Secondary or higher education |
38.2 |
|
|
|
|||||
|
Currently working |
27.9 |
|
|
|
|||||
|
Wanted pregnancy |
78.8 |
|
|
|
|||||
|
Iron taken during pregnancy |
65.4 |
|
|
|
|||||
|
Anemic mother |
61.7 |
|
|
|
|||||
|
Ever smoked |
8.9 |
|
|
|
|||||
|
Household characteristics** |
%, weighted mean* |
|
|
|
|||||
|
Urban household |
23.7 |
|
|
|
|||||
|
Flush toilet |
30.6 |
|
|
|
|||||
|
Food group consumed (24 hour food consumption) |
|
||||||||
|
|
% weighted mean* |
|
|
|
|
||||
|
Breast milk |
87.5 |
95.0 |
88.6 |
78.9 |
|
||||
|
Infant formula |
9.8 |
12.1 |
8.9 |
8.4 |
|
||||
|
Milk and dairy products |
52.0 |
44.5 |
53.6 |
57.4 |
|
||||
|
Tea or coffee |
38.7 |
20.8 |
44.1 |
50.8 |
|
||||
|
Fortified baby food |
15.3 |
17.5 |
14.5 |
14.0 |
|
||||
|
Porridge or gruel |
22.1 |
17.3 |
23.8 |
24.9 |
|
||||
|
Meat, poultry, fish, eggs |
19.3 |
9.2 |
22.1 |
26.2 |
|
||||
|
Bread, rice, noodles |
75.8 |
55.2 |
84.2 |
87.4 |
|
||||
|
Fruits and vegetables |
44.9 |
22.5 |
51.3 |
60.1 |
|
||||
|
Potatoes and other tubers |
23.9 |
9.5 |
28.0 |
33.8 |
|
||||
|
Dried beans, peas, lentils, nuts |
14.6 |
7.8 |
16.5 |
19.1 |
|
||||
|
Oil and fats |
13.9 |
6.2 |
17.3 |
17.9 |
|
||||
|
* Weighted average is computed using the survey sample weights to reflect better the national average. **Wealth was also considered as a household variable in the analysis. The wealth percentile is based on the wealth index provided in the survey. It is estimated based on household assets, and valued 1 for the poorest 1%, and 99 for the richest 1%. Reporting the weighted mean is not applicable to the wealth percentile, hence it is not reported in the table. |
|
||||||||
Abbreviations: N: Number of Cases
Note that the data on food consumption are also presented by 6-month age-groups to demonstrate how the consumption of different categories changes with age. Furthermore, to better understand the dynamics of the consumption of different food categories, we depicted how their prevalence changes from month to month with increasing age (Figure 1).
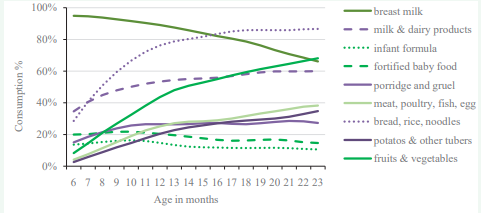
Figure 1: The consumption of different food categories according to age among Indian infants (6-23 months). The figure shows what percentage of infants consumed a food group in the 24 hours prior to the data collection of the third National Family Health Survey in 2005-06 in India according to the age of the infant expressed in months.
The majority of Indian infants (95%) are breast fed at age 6 months, and at age 18 months, 4 out of 5 infants (79%) still receive breast milk. The most prominent complementary food categories entering the infants’ diet at 6-12 months are “bread, rice, noodles” and “milk and dairy products,” followed by “fruits and vegetables.” By age 9 months the proportion of those eating “porridge and gruel” overtakes “fortified baby food” consumers and remains more or less at the same level up to 23 months, while the proportion of “fortified baby food” consumers somewhat decreases by that age. The diversification of the diet with “meat, poultry, fish and eggs” starts gradually, but most prominently after 12 months of age. Overall, food consumption data underline the low diversity of the diet among 6-23 month-old infants [26].
The association between food categories and hemoglobin levels
Table (3) shows the estimated coefficients from the OLS regressions on the hemoglobin concentrations corrected for altitude.
|
Variables |
Age 6-23 months OLS coefficient (95% confidence interval ) N = 9,968 |
Age 6-11 months OLS coefficient (95% confidence interval) N=3,254 |
Age 12-17 months OLS coefficient (95% confidence interval) N=3,499 |
Age 18-23 months OLS coefficient (95% confidence interval) N=3,215 |
|
Infant characteristics |
|
|
|
|
|
Low birth weight |
-1.79*** |
-1.24** |
-2.43*** |
-1.65*** |
|
|
(-2.40, -1.18) |
(-2.25, -0.23) |
(-3.49, -1.37) |
(-2.74, -0.56) |
|
Gender: female child |
2.40*** |
2.18*** |
3.11*** |
1.88*** |
|
(male gender as reference) |
(1.85, 2.96) |
(1.26, 3.11) |
(2.13, 4.09) |
(0.89, 2.88) |
|
Age of infant (6-11 months as reference) |
|
|
|
|
|
12 to 17 months |
-2.12*** |
|
|
|
|
|
(-2.85, -1.39) |
|
|
|
|
18 to 23 months |
-0.77* |
|
|
|
|
|
(-1.55, 0.02) |
|
|
|
|
Iron supplementation |
-0.33 |
0.08 |
-0.43 |
-0.86 |
|
|
(-1.53, 0.88) |
(-2.04, 2.20) |
(-2.42, 1.56) |
(-3.04, 1.33) |
|
Deworming medication |
0.67 |
-3.08** |
0.55 |
0.74 |
|
|
(-0.36, 1.69) |
(-5.96, -0.20) |
(-1.14, 2.23) |
(-0.78, 2.26) |
|
Maternal characteristics |
|
|
|
|
|
Young mother (age <18 years) |
-0.44 |
-0.64 |
-0.16 |
-0.43 |
|
|
(-1.14, 0.25) |
(-1.80, 0.52) |
(-1.38, 1.06) |
(-1.66, 0.79) |
|
Primary education |
0.32 |
1.12 |
-1.49* |
1.21 |
|
|
(-0.67, 1.15) |
(-0.42, 2.65) |
(-3.07, 0.09) |
(-0.40, 2.82) |
|
Secondary or higher education |
1.25*** |
1.61** |
0.48 |
1.69** |
|
|
(0.44, 2.06) |
(0.26, 2.96) |
(-0.91, 1.87) |
(0.22, 3.15) |
|
Currently working |
0.69** |
0.80 |
1.21** |
0.05 |
|
|
(0.03, 1.36) |
(-0.36, 1.95) |
(0.05, 2.38) |
(-1.10, 1.19) |
|
Wanted pregnancy |
0.62** |
1.00* |
-0.25 |
1.29** |
|
|
(-0.07, 1.32) |
(-0.16, 2.16) |
(-1.44, 0.95) |
(0.04, 2.55) |
|
Iron supplementation |
-0.40 |
-1.03* |
-0.26 |
0.11 |
|
during pregnancy |
(-1.08, 0.27) |
(-2.16, 0.09) |
(-1.44, 0.92) |
(-1.07, 1.29) |
|
Anemic mother |
-4.85*** |
-3.88*** |
-5.35*** |
-5.42*** |
|
|
(-5.42, -4.27) |
(-4.84, -2.91) |
(-6.35, -4.34) |
(-6.44, -4.40) |
|
Ever smoked |
-0.75 |
-0.29 |
-1.71** |
-0.21 |
|
|
(-1.72, 0.22) |
(-1.93, 1.35) |
(-3.40, -0.02) |
(-1.91, 1.49) |
|
Household characteristics |
|
|
|
|
|
Wealth index |
0.05*** |
0.02 |
0.06*** |
0.08*** |
|
|
(0.04, 0.07) |
(-0.01, 0.05) |
(0.03, 0.09) |
(0.05, 0.11) |
|
Urban household |
-0-03 |
1.76*** |
-0.070 |
-1.83*** |
|
|
(-0.77, 0.71) |
(0.52, 3.00) |
(-1.35, 1.21) |
(-3.17, -0.49) |
|
Flush toilet |
0.23 |
-0.48 |
1.09** |
0.03 |
|
|
(-0.61, 1.07) |
(-1.86, 0.91) |
(-0.38, 2.55) |
(-1.48, 1.54) |
|
Food group consumed (24 hour prior to interview) |
||||
|
Breast milk |
1.48*** |
2.11*** |
1.32* |
1.45** |
|
|
(0.64, 2.32) |
(0.13, 4.08) |
(-0.18, 2.81) |
(0.21, 2.68) |
|
Infant formula |
1.65*** |
2.37*** |
1.31 |
1.55* |
|
|
(0.67, 2.63) |
(0.82, 3.92) |
(-0.47, 3.09) |
(-0.23, 3.34) |
|
Fortified baby food |
1.21*** |
0.05 |
2.85*** |
1.43* |
|
|
(0.37, 2.05) |
(-1.33, 1.43) |
(1.34, 4.35) |
(-0.12, 2.98) |
|
Fruits & vegetables |
0.96*** |
-0.06 |
1.38** |
1.19** |
|
|
(0.31, 1.60) |
(-1.24, 1.12) |
(0.32, 2.45) |
(0.07, 2.32) |
|
Meat, poultry, fish, eggs |
0.67 |
1.43 |
0.18 |
0.06 |
|
|
(-0.19, 1.53) |
(-0.48, 3.34) |
(-1.26, 1.61) |
(-1.30, 1.42) |
|
Potatoes & other tubers |
0.30 |
-0.47 |
0.53 |
0.30 |
|
|
(-0.43, 1.03) |
(-2.11, 1.18) |
(-0.67, 1.73) |
(-0.83, 1.43) |
|
Porridge or gruel |
-1.24*** |
-1.45*** |
-1.66*** |
-2.22** |
|
|
(-1.94, -0.53) |
(-2.88, -0.45)(- |
(-2.88, -0.45) |
(-1.84, 0.63) |
|
Bread, rice, noodles |
-0.89** |
-0.70 |
-0.42 |
-0.86 |
|
|
(-1.62, -0.16) |
(-1.73, 0.33) |
(-1.81, 0.98) |
(-2.43, 0.72) |
|
Milk and dairy products |
-0.63** |
-0.81 |
-0.49 |
-0.41 |
|
|
(-1.25, -0.00) |
(-1.84, 0.23) |
(-1.59, 0.61) |
(-1.54, 0.72) |
|
Tea or coffee |
-0.23 |
-0.63 |
-0.06 |
-0.34 |
|
|
(-0.88, 0.41) |
(-1.86, 0.59) |
(-1.15, 1.02) |
(-1.43, 0.75) |
|
Dried beans, peas, lentils &and nuts |
-1.24*** |
-0.97 |
-1.12 |
-1.34* |
|
|
(-2.17, -0.31) |
(-2.98, 1.04) |
(-2.71, 0.47) |
(-2.79, 0.10) |
|
Oil and fats |
-0.25 |
0-85 |
-0.36 |
-0.60 |
|
|
(-1.10, 0.60) |
(-1.05, 2.76) |
(-1.76, 1.05) |
(-1.94, 0.74) |
|
***p<0.01, **p<0.05, *p<0.1 |
||||
|
The table shows the estimated coefficients from the ordinary least square regressions on the hemoglobin concentrations (corrected for altitude). Column 1 reports the coefficients on the full sample of infants aged 6-23 months, including those without a precise entry on their birth weight for whom this variable was imputed. Columns 2, 3 and 4 display the coefficients and their 95% confidence intervals for the sub-groups of infants aged 6-11, 12-17 and 18-23 months, respectively. For the analysis by age-group only those entries were used where hemoglobin data were available in the third National Family and Health Survey (2005-06) of India. Note that the wealth index is unlike other variables, not dichotomous, it refers to wealth percentile of the distribution. |
||||
N: number of cases
OLS: ordinary least square
The regression coefficients for the full sample (aged 6-23 months) show that the consumption of “infant formula” (1.65, p0.1) even weaker and less significant. The negative association of “porridge and gruel” with hemoglobin was stronger than in the total population and remained significant (-1.66, p<0.01).
To determine whether the observed positive associations with the OLS regression have a consistent effect across different severity of anemia, we ran a quantile regression analysis. We found that the positive association persists across different hemoglobin quantiles for all food groups, but breast milk. Figure (2A) shows that the quantile coefficient is similar across the hemoglobin distribution quintiles for “fortified baby food.” “Breast milk,” however, did not appear to have a significant association with hemoglobin concentration beyond the 100 g/L threshold (moderate anemia), but below 86 g/L the statistical significance and magnitude of the coefficient was high (2.97 g/L: p<0.01; Figure 2B). This suggests that the two food categories have distinct associations with hemoglobin. Whereas “fortified baby food” seems to have a similar effect across different hemoglobin statuses, breastfeeding has a stronger effect for more severely anemic infants. Results of the quantile regression analysis are similar to those of the OLS estimations shown in Table (3) for other food groups, therefore detailed results for all the variables are not presented in separate figures.
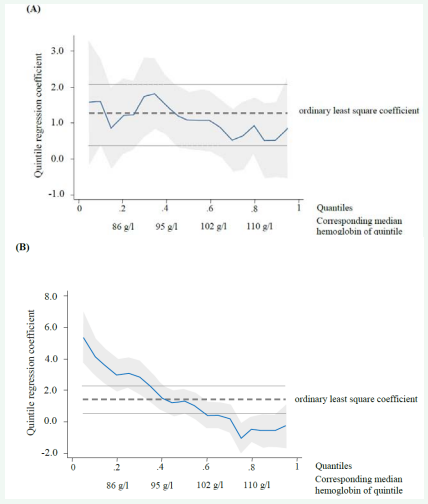
Figure 2: Quantile coefficients for different food categories by population distribution of hemoglobin levels split into quintiles: (A) Fortified baby food; (B) Breast milk.
The vertical axis shows the quantile coefficient for consuming fortified baby food (A) and breast milk (B). The horizontal axis shows the population distribution of hemoglobin levels split into quintiles with 0.2, 0.4, 0.6 and 0.8 point estimates corresponding to 86, 95, 102 and 110 g/L hemoglobin levels, respectively. The dashed line refers to the coefficient defined with the ordinary least square regression for (A) fortified baby food 1.21, and (B) breast milk 1.48. The dotted lines refer to the 95% confidence interval of the ordinary least square coefficient. In case of fortified baby food (A) the quantile coefficient is within the confidence interval of the ordinary least square coefficient which suggests that the observed association is persistent across different levels of hemoglobin. In case of breast milk the quantile coefficient is higher than the confidence interval of the ordinary least square coefficient at the lowest hemoglobin quintile, and lower at the higher two hemoglobin quintiles, which suggests that the breastfeeding has a protective effect among more severely anemic infants.
The association between infant, maternal and household variables and hemoglobin levels
As expected, low birth weight had a negative and statistically significant association with hemoglobin level both in the entire 6-23 month group (-1.79 g/L: p<0.01) and across all 6-month age-groups. Low birth weight was most negative in the most anemic 12-17 month subgroup (-2.12 g/L: p<0.01, Table 3). The magnitude and significance of this association remained similar in the sub-group with available birth weight data, suggesting that imputing the birth weight does not affect considerably the results of the OLS regression.
Female infants had significantly higher hemoglobin levels than males both in the entire group of 6-23 month olds and across all the subgroups (Table 3).
For the variables indicative of the use of health care services, the use of “iron supplementation” and “deworming medication” showed no significant association with hemoglobin levels for the entire age-group, although “deworming medication” showed a strong significantly negative association at age 6-11 months (-3.08, p<0.05).
Our results indicated that infant hemoglobin status was affected by household wealth. The regression analysis showed a strong positive association between household wealth index and hemoglobin concentration (0.05 g/L for 6-23 month; p<0.01; here the 0.05 coefficient means that a 10% transition among wealth percentile translates to a change of 0.5 g/L in average hemoglobin level) (Table 3). It is well documented that lower income households are more likely to bear the health burden, compared to households with higher income [27,28], therefore we wanted to examine further if there was any difference between different wealth groups. Figure (3A) shows a U-shaped relationship between age and hemoglobin concentration in infants from all three wealth tertiles. Not only did infants from the low- and middle-income groups exhibit lower hemoglobin levels, but the difference in average hemoglobin levels between the wealthiest group and the two poorer groups widened after 12 months of age. At around 18 months, the average hemoglobin levels in infants from the wealthy tertile increased beyond the 100 g/L threshold, whereas hemoglobin levels in infants from the two lower tertiles remained below this threshold for the remainder of the age groups analyzed. Another reason for controlling for household wealth status was its association with food choices. Not controlling for wealth would have overestimated the association of certain food groups on hemoglobin.
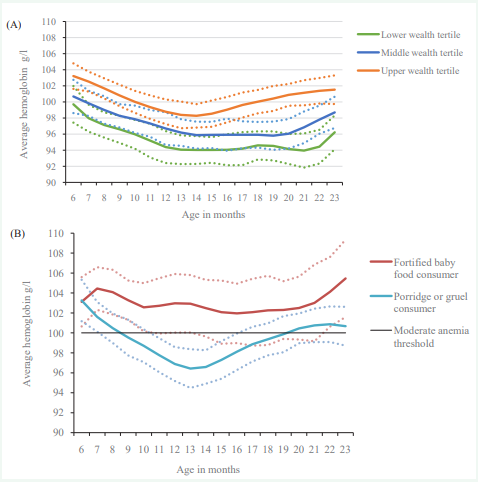
Figure 3: (A) Hemoglobin levels (g/L) according to age and wealth tertiles; (B) Average hemoglobin levels (g/L) according to age and consumption of fortified baby foods, for infants in the highest wealth tertile.
Figure 3: (A) depicts the average hemoglobin concentrations according to age and wealth tertiles, divided into low, middle and high income groups, and (B) the average hemoglobin by age among fortified baby food consumers, and those who reported consuming porridge or gruel in the 2005- 2006 National Family Health Survey in India. The moderate anemia threshold refers to 100g/l hemoglobin. The dotted lines around the solid lines show the corresponding 95% confidence intervals.
In addition to wealth tertiles, several other variables affected hemoglobin concentrations in our study population (Table 3). If the mother was anemic it had a significant negative association (-4.85; p<0.001) with hemoglobin concentration and this association was equally significant and strongly negative in all 6-month age-groups, in line with other studies [29,30]. We ran regressions with additional control variables for additional maternal characteristics such as height (mother stunted), weight for height (two dummy variables) or religious affiliation (Hindu) to take in account dietary preference such as vegetarianism. Once we included maternal anemia, that group of variables (maternal height, weight and religious affiliation) became non-significant probably because we were already controlling for the channel on how those variables could be related such as maternal anemia, low birth weight, household wealth and community fixed effects. For the interest of the publication, we decided to focus on the group of variables that had statistical significance.
“Maternal secondary education” (1.25 g/L; p <0.01), “currently working” (0.69, p <0.05) and a “wanted pregnancy” (0.62 g/L; p <0.05) showed a statistically significant positive association with the infant’s hemoglobin concentration in the 6-23 month age-group, although these were not consistently significant across the different 6-month age-groups. Altogether, these three variables “maternal secondary education,” “currently working” and “wanted pregnancy” are proxies for the family’s capacity to offer the child a healthier environment, including maternal pre-natal care and child health care such as hygiene or de worming. However, the presence of these variables may also affect feeding choices, raising the possibility that these factors could affect the relationship between feeding types and hemoglobin concentrations.
Infants’ age group and hemoglobin levels
We observed from the data that there was a remarkable variation in hemoglobin levels according to the infant’s agegroup (Table 3). In particular, the 12-17 month age group had a significantly lower hemoglobin level (Hb -2.12 g/L: p <0.01) compared to the 6-11 month group, and it remained under the 6-11 month level also at age 18-23 months (Hb -0.77 g/L: p <0.1). These results indicate that the 12-17 month period is the most strongly associated with the lowest hemoglobin concentrations and that this subgroup suffers from the most severe forms of anemia.
Because of the relatively uniform association of “fortified baby food” across different levels of anemia observed in the quantile regression (Figure 2), we analyzed the average hemoglobin concentration (by age) against the consumption of fortified baby food and compared consumers and non-consumers (Figure 3B). For this analysis, we selected the subgroup of infants in the highest wealth tertile, since this is the subgroup with the most even distribution of consumers versus non-consumers. At 6 months of age, consumers and non-consumers had similar average hemoglobin concentrations. Beyond this age, infants who were consumers of fortified baby food showed average hemoglobin levels that were consistently above the 100g/L threshold. In contrast, the average hemoglobin levels fell below the 100 g/L threshold between 9-19 months of age amongst the non-consumers.
DISCUSSION
A key finding from our study was that associating hemoglobin levels with the type of complementary feeding recorded in the survey, we identified “fortified baby food” as having a positive and statistically significant association with hemoglobin concentrations in infants aged 6-23 months and in particular the most anemic 12-17 month age group. In addition, “infant formula,” “breast milk” and “fruits and vegetables” (listed in order of significance) showed positive and statistically significant association with hemoglobin status.
These could arise from several sources. First, the particular food category is a rich source of bioavailable iron. Second, although some food categories may not be iron-rich per se, they may enhance the absorption of metabolized iron from other foods, as is the case for fruits and vegetables rich in vitamin C [31].
Our findings among Indian infants are in line with the large body of evidence supporting the beneficial effects of commercial fortified complementary foods on hemoglobin status [2,15,19,29,32-36]. Other studies have shown that even in developed countries, meeting the micronutrient requirements of infants and young children could not have been so widely achieved without the fortification of infant complementary foods [37]. The methodology used in this paper is also applied in other studies which explore if the consumption of certain fortified foods is reflected in hemoglobin levels. Such an approach was used for example by Rohner et al., who found a significant association between the consumption of fortified flour and hemoglobin in children and women of reproductive age in the Ivory Coast underscoring the role of the national fortification program [38].
Another variable that was positively associated with hemoglobin concentrations was (partial) breastfeeding. However, no significant association was seen for infants with hemoglobin concentrations higher than 95g/L. This finding is in line with other studies which suggest that the iron content of breast milk is insufficient for infants beyond the initial months of their life [13,39]. On the other hand, the available iron in breast milk would confer a benefit to those infants with low iron status. Breast milk is also known to have beneficial effects on infants’ immunity and reduce the negative consequences of infections (such as diarrhea), and thus indirectly ameliorate hemoglobin status [40].
The categories “porridge or gruel,” “dried beans, peas, lentils and nuts,” “bread, rice, noodles” and “milk and dairy products” showed a significantly negative association with hemoglobin concentrations. This association remained strong even after controlling for different confounders, health at birth, socioeconomic factors, and indicators of geography and residence type. The negative association could arise because these foods could replace other iron-rich foods in the diet. Furthermore, these items may also be high in phytic acids, which can reduce the absorption of iron [31].
In keeping with the findings from published literature [4], our analysis identified that Indian infants between 12-17 months of age had the highest risk (odds 1.24; p<0.01) of suffering from moderate or severe anemia. After the initial 6-month period of exclusive breastfeeding, we observed a downward trend in average hemoglobin concentrations with age. The findings from our study support previously published reports indicating the slow depletion of micronutrient stores (including iron), as well as the relatively late introduction of iron-rich complementary foods [12, 41]. The insufficient iron stores in Indian children of this age may be further exacerbated not only by the type and quality of complementary foods used, but also by their late introduction in the average infant’s diet [42,43].
Several intrinsic biological, maternal and household factors also affect infant hemoglobin status. Similar to findings of others, low birth weight had a statistically significant negative association with hemoglobin level (Hb -1.79g/L: p<0.01) [44]. This is consistent with Anand et al., who emphasized the important role of premature birth or a birth weight below 2.5 kg on the predisposition towards anemia [23]. In addition, we found that female infants had significantly higher hemoglobin levels than males (Hb 2.27g/L: p <0.01). However, this is likely to be related to intrinsic gender differences affecting baseline iron status [45]. Several maternal factors were positively associated with infant hemoglobin concentration, namely mothers who had a wanted pregnancy, higher education level and age above 18 years at the birth of their first child. Again, these findings corroborate previously published work on maternal risk factors that influence infant iron status [46,47]. We also observed that household wealth index had a significant positive association with the infants’ hemoglobin concentrations, as did other authors [27-30].
Indicators of public health care interventions using ‘iron supplementation’ have shown no effect on hemoglobin levels suggesting the lack of effectiveness of such programs. Indeed a recent survey in India showed that only 13% of young children benefit from supplementation programs [48]. Supplementation programs are hampered by low compliance rates, the need for an effective supply chain and the difficulty in sustaining such programs covering populations of considerable sizes, such as India [49,50]. In fact under the nationwide Integrated Child Development Scheme supplementation program, the majority of the participating states reported less than 50% coverage of children less than 6 years of age [51]. Supplementation appears to be insufficient as a mass coverage strategy in India, although it can be effective as a targeted short-term solution to treat well defined iron deficiency, for example in clinical practice settings. There are several limitations to this study. First, cross-sectional databases, such as the NFHS-3 only capture the feeding trends based on a food consumption questionnaire referring to the prior 24 hour period, but not those used in the more distant past. Therefore the study relies on the persistent feeding assumption, i.e. the existence of a strong association between how infants were fed in the 24 hours before the interview and how they were fed during the previous two to four months. The strength of this correlation would greatly affect the strength of the findings. Second, the NFHS-3 does not provide information on the quantity of food consumed; therefore the estimation made is based on an average portion consumed and not on actual amounts. Finally, reverse causality could be an issue if the mothers of infants diagnosed with anemia gave iron-rich food to infants. However, we do not believe that reverse causality could be a serious factor that confounds our analysis. Not only is there a low awareness of IDA in India, but any monitoring mechanisms to check hemoglobin status and thereby identify anemia are effectively non-existent [51].
As discussed OLS regression explores association, not causation. Nevertheless the research team wanted to explore that in case results of the systematic review of Eichler 8.1., et al.[19], were applied to the NFHS-3 survey population the OLS estimate would be similar to the OLS found in this study or not. Therefore we created a synthetic population cohort mimicking the Indian population [52]. This synthetic cohort was built using (1) previous day food consumption as reported in the NFHS-3 cross-sectional survey, (2) the frequency, quantity and duration of consumption based on a market survey conducted in India (unpublished data), and (3) a Hb increase linked to fortified baby food consumption based on the systematic review. Once this synthetic population cohort was created we assumed a data collection identical to that used in the NFHS-3 (report of prior 24 hour consumption of various food groups). Then we run the OLS regression model on this synthetic cohort (as if data were collected from this cohort in the survey). The OLS regression result was very similar to that of the OLS regression found based on the NFHS-3 data (reported in this paper). The synthetic cohort used the following assumptions (based on the market survey): (1) the frequency of consumption of fortified baby food on five out of seven days a week, (2) that 95% of the mothers give fortified baby food to their children consistently from one week to the other, and (3) a consumption pattern that peaks at nine months of age and decreases gradually until the age of 23 months to less than one third of the peak amount.
Our analysis adds to the current knowledge to understand not only which are the influencing factors of complimentary feeding practices in India [16,53], but also how specific food groups used daily as complimentary feeding for 6-23 months old infants are associated with hemoglobin levels based on a large crosssectional national survey. Given the above mentioned limitations of this analysis the food categories that are positively associated with hemoglobin status should not be regarded as mutually exclusive or competing alternatives, but rather as a group of foods whose intake could enhance hemoglobin concentrations. Our findings could serve as an additional source of information to guide dietary recommendations for infants in India and other emerging economies, where the costs associated with IDA are substantial and could jeopardize future economic growth and convergence amongst socioeconomic groups.
CONCLUSION
The results from our study demonstrate that the type of complementary foods infants aged 6-23 months in India consume is associated with their hemoglobin levels. In addition, our results also show that infants between 12-17 months of age have a high risk of moderate or severe anemia. Nutrition interventions targeting children from 6 months onwards could consider including the use of fortified complementary foods and foods with high nutrient density to improve hemoglobin status and prevent iron deficiency.
ACKNOWLEDGEMENTS
This research was funded by the Nestlé Research Center.
CONFLICT OF INTEREST
Dr. Alberto Prieto, Dr. Patrick Detzel, Dr. Zsuzsa V. Hutton and Dr. Alison L. Eldridgeare employees of Nestec SA, Nestlé Research Center. Dr. Shashidhar Rao is an employee of Nestlé India. Dr. Pankaj Garg is working in the Department of Neonatology, Sir Ganga Ram Hospital, New Delhi as Honorary Visiting Senior Consultant and contributed as a scientific expert to the paper. He has not received any remuneration for this work neither from Nestlé or any other party.
Researchers used the publicly available 2005-06 National Family Health Survey-3 data for the analysis, which was free of charge. This study used de-identified data from the 2005- 06 National Family Health Survey (NFHS-3) of India, therefore ethical committee approval was not requested.


