Evaluation of the Relationship between Obestatin and Malnutrition in Hemodialysis Patients
- 1. Department of Internal Medicine, University of Healthy Science, Turkey
- 2. Koru Ankara Hospital Clinic of Nephrology, Turkey
Abstract
Objective: The aim of this study was to examine the relationship between obestatin and malnutrition in patients with chronic renal failure (CRF).
Method: The study included 43 hemodialysis patients with chronic renal failure aged >18 years and 43 healthy matched controls.
Results: CRF patients and healthy controls were not significantly different in terms of obestatin levels. For all subjects, obestatin was positively correlated with body fat, waist circumference, Mini Nutritional Assessment score, body mass index, triglycerides, and low-density lipoprotein levels. Regression analysis showed that body fat was a determinant of obestatin.
Conclusion: In reference to our results, we conclude that obestatin is a marker associated with obesity and was not significantly different between patients with CRF and healthy controls.
Keywords
• Obestatin
• Malnutrition
• Hemodialysis
Citation
Sahiner ES, Akcay A (2021) Evaluation of the Relationship between Obestatin and Malnutrition in Hemodialysis Patients. J Pharmacol Clin Toxicol 9(1):1150.
INTRODUCTION
It is estimated that more than 500 million people have chronic renal disease worldwide and that 1 in every 9 to 10 adults has some degree of kidney disease. According to the 2012 Chronic Kidney Disease Evaluation and Management guidelines, chronic kidney disease is defined as renal structural and functional abnormalities with health consequences that have lasted for more than 3 months.
Patients with end-stage renal disease require dialysis or a kidney transplant to survive. Hemodialysis is the most commonly used dialysis method worldwide, accounting for approximately 90% of all dialysis therapies, albeit with some differences between countries.
Nutritional problems are common in patients undergoing hemodialysis. Protein-energy malnutrition is a clinical and measurable state of malnutrition that occurs due to insufficient and/or unbalanced protein intake, loss of fat and somatic protein stores in the body, and decreased serum protein levels, resulting in an overall impairment of bodily functions [1]. Malnutrition increases the risk of cardiovascular death by 27%; in cases of severe malnutrition, the risk increases by 33% [2]. In contrast to the normal population, however, a higher body mass index (BMI) is associated with a better one-year survival outcome in hemodialysis patients [3].
Obestatin is a 23-amino-acid peptide produced by the posttranslational modification of the 117-amino-acid preproghrelin peptide coded by the ghrelin gene; it decreases in cases of malnutrition and increases with weight gain [4,5]. Studies have demonstrated that obestatin affects food intake, gastrointestinal motility, energy balance, obesity, insulin resistance, and diabetes mellitus. Obestatin and ghrelin are located in the same gene locus and act as physiological antagonists.
Although there are studies on obestatin, this study is the first to investigate the relationship between obestatin and nutritional problems, bioimpedance analysis, and the Mini Nutritional Assessment (MNA), scale among patients with chronic renal failure (CRF)
The aim of this study was to examine the relationship between obestatin and malnutrition in patients with CRF.
MATERIALS AND METHODS
This cross-sectional study was performed in the Turgut Özal University Internal Diseases Clinic. The study included 43 hemodialysis patients with CRF aged >18 years and 43 healthy matched controls. Exclusion criteria were a change of more than 10% in BMI in the last 3 months, malignancy, connective tissue disease, and chronic infection.
We recorded participants’ age, gender, height, weight, waist, and hip circumference. Anthropometric measurements of all subjects without shoes or heavy clothing were made by the same investigator after participants had fasted overnight. These measurements were used to calculate BMI.
Body fat composition was assessed by the same investigator using bioimpedance analysis, and the Subjective Global Nutritional Assessment questionnaire was administered to all participants.
All subjects’ complete blood count, sodium (Na), potassium (K), urea, creatinine, albumin, and lipid profile (high-density lipoprotein [HDL], low-density lipoprotein [LDL], triglycerides) results were recorded from patient files. Obestatin was measured in peripheral venous blood drawn from an antecubital vein after 12 hours of fasting. All samples were centrifuged and kept at –80 °C until analysis. Obestatin levels were measured using a commercial ELISA kit (EASTBIOPHARM Human Obestatin (OB) ELISA Kit, Number: Hu-270), and are presented in ng/ mL. Body mass index (BMI) was used as an indicator of obesity and calculated using the following formula: BMI = Weight (kg) / Height (m)2
Patients were evaluated according to the World Health Organization obesity classification. Subjects with a BMI of >30 kg/m2 were classified as obese.
Subjective global assessment (SGA)
The SGA was based on two components: medical history and physical examination. Medical history included weight loss over the last 6 months, gastrointestinal symptoms (anorexia, nausea, vomiting, diarrhea), dietary intake, functional capacity, and concomitant systemic diseases. Physical examination included loss of subcutaneous fat measured in the triceps region and the mid-axillary line at the level of the lower ribs, muscle wasting in the quadriceps and deltoids, presence of edema in the ankles, and presence of ascites. On the basis of medical history and physical examination, we categorized each subject as (A) well nourished, (B) mildly or moderately malnourished, or (C) severely malnourished depending on SGA scores.
Statistical analysis
Data were analyzed using the SPSS for Windows 20.0 software package (IBM Corp, Armonk, NY, USA). Participants’ demographic characteristics were analyzed using descriptive statistics. The normality of data distribution was tested with the Kolmogorov–Smirnov test. Intra- and intergroup comparisons were performed using paired samples or independent samples t-tests and chi-square or Fisher exact tests. Correlation between variables was assessed using Pearson correlation analysis. The correlation coefficient (r) was described using the following criteria: 0.00–0.24, weak; 0.25–0.49, moderate; 0.50–0.74, strong; 0.75–1.00, very strong. Multiple linear logistic regression analysis was performed to investigate determinants of obestatin. Receiver operator characteristic (ROC) curve analysis was performed to determine the predictive value of serum obestatin in predicting obesity. The best cut-off point was determined by the Youden index. Values of p<0.05 were considered statistically significant.
RESULTS
Clinical and demographic characteristics of the study population are summarized in Table 1.
Table 1: Clinical and Laboratory Characteristics of Hemodialysis Patients and Controls.
| Variables | Hemodialysis Patients (n=43) |
Controls (n=43) |
p |
| Age | 61±12.83 | 62.65±17.17 | 0.615 |
| Body fat, kg | 25.59±8.85 | 27.73±9.51 | 0.281 |
| HDL, mg/dL | 43.97±17.6 | 46.24±16.3 | 0.537 |
| LDL, mg/dL | 138.02±56.05 | 180.11±88.66 | 0.01 |
| Triglycerides, mg/dL | 77.93±26.52 | 195.47±127.1 | <0.001 |
| Waist circumference, cm | 96±19.24 | 104.55±16.74 | 0.031 |
| Body weight, kg | 69.13±15.75 | 76.3±12.23 | 0.021 |
| Height, cm | 162.51±9.28 | 165.02±9 | 0.206 |
| BMI, kg/m2 | 26.01±4.45 | 28.05±4.1 | 0.030 |
| Muscle mass, kg | 23.88±4.94 | 29.31±6.29 | <0.001 |
| Water, kg | 34.63±9.36 | 35.46±6.62 | 0.636 |
| Albumin, g/dL | 3.93±0.34 | 4.14±0.51 | 0.030 |
| Urea, mg/dL | 152.46±41.5 | 40.48±29.25 | <0.001 |
| Creatinine, mg/dL | 7.61±3.29 | 0.91±0.32 | <0.001 |
| Na, mmol/L | 138.04±2.89 | 138,39±3.74 | 0.630 |
| K, mmol/L | 5.19±0.97 | 4.47±0.52 | <0.001 |
| URR | 0.69±0.09 | --- | 0.617 |
| MNA | 12.54±1.40 | 12.70±1.59 | 0.617 |
| Obestatin, ng/mL | 5.46±4.28 | 5.76±4.44 | 0.748 |
In the hemodialysis and control groups, 18 and 26 participants were female, respectively. The two groups were similar in terms of sex distribution. In our study, the CRF group had lower LDL, triglycerides, waist circumference, weight, BMI, muscle, and albumin levels and higher urea, creatinine, and K levels compared to the control group. Obestatin levels were not significantly different between the two groups. For all subjects, obestatin was positively correlated with body fat, waist circumference, MNA score, BMI, triglycerides, and LDL levels (Table 2).
Table 2: Determinants of Obestatin Levels for All Subjects.
| Variables | Obestatin | |
| r | p | |
| Body fat | 0.550 | 0.000 |
| Triglycerides | 0.398 | 0.000 |
| LDL | 0.322 | 0.002 |
| Waist circumference | 0.400 | 0.000 |
| BMI | 0.374 | 0.000 |
| MNA | 0.346 | 0.001 |
Multiple linear regression analysis was performed with obestatin as the dependent variable and body fat, waist circumference, MNA, BMI, triglycerides, and LDL as independent variables. Accordingly, we found that body fat was the major determinant of obestatin (p=0.011, Nagelkerke R2 =0.546).
In the study population, the 20 patients with BMI of >30 kg/ m2 had elevated serum obestatin levels (8.52 ± 3.88).
ROC analysis revealed a cut-off obestatin level of 6.62 ng/ mL (AUC: 0.760, sensitivity: 75%, specificity: 71.2%), for obesity defined as BMI of >30 kg/m2 (Figure 1).
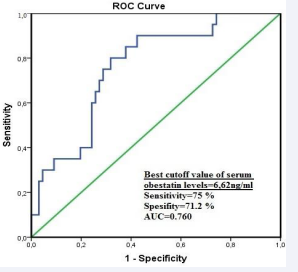
Figure 1 Predictive value of obestatin levels in determining obesity according to ROC analysis.
DISCUSSION
The CRF group and the healthy controls were not significantly different in terms of obestatin levels. For all subjects, obestatin was positively correlated with body fat, waist circumference, MNA score, BMI, triglycerides, and LDL levels. Regression analysis showed that body fat was a determinant of obestatin.
Borges et al., compared serum obestatin and acyl-ghrelin levels between hemodialysis patients (n=29), nondialysis patients with chronic kidney disease (n=19), and healthy controls (n=16). They reported the highest obestatin levels and the lowest acyl-ghrelin/obestatin ratios in hemodialysis patients. Despite investigating similar variables, the study by Borges et al., was limited by not having evaluated their subjects’ lipid profiles, nutritional statuses (with SGA), or body fat, muscle, and water compositions (with bioimpedance). Therefore, the elevated obestatin levels in their hemodialysis group may be associated with body fat, which may have been overlooked due to the lack of anthropometric measurements and bioimpedance analysis.
Beberashvili et al. studied the associations between obestatin, leptin, and proinflammatory cytokines and mortality and particularly cardiovascular mortality among 94 hemodialysis patients. They reported a correlation between low obestatin and mortality and suggested that reduced obestatin may be an independent predictor of mortality in hemodialysis patients.
Another study by Mafra et al., investigated the relationships between serum acyl and des-acyl ghrelin, leptin, obestatin levels, and nutritional disorders in 28 female and 22 male hemodialysis patients. In these hemodialysis patients, leptin and des-acyl ghrelin levels were higher and obestatin levels were lower than those of healthy adults, while acyl ghrelin was normal. In hemodialysis patients with BMI of >23 kg/m2 , obestatin levels were significantly lower. In our study, we did not find obestatin to be statistically associated with waist circumference or BMI [4- 10].
Beberashvili et al., reported that obestatin was associated with cardiovascular death among hemodialysis patients aged >71 years but did not perform SGA or anthropometric measurements.
One study measured serum and saliva obestatin levels in hemodialysis patients and found significantly elevated obestatin levels in both, but more prominently in saliva. They suggested that the kidneys may take part in the metabolism of obestatin and that obestatin may contribute to nutritional disorders in hemodialysis patients.
In our study, we utilized total body fat measurements and did not discriminate between visceral and subcutaneous adipose tissue. Further studies are required that quantitatively measure visceral fat, which is a costly and impractical assessment. However, since waist circumference is considered to partially represent visceral adipose tissue, we utilized waist circumference measurements to establish a relationship between obestatin and visceral adiposity.
To the best of our knowledge, our study is the first study to investigate the relationship between obestatin and nutritional status in patients with CRF. Our study has several limitations. First, it is a single-center cross-sectional study. Further prospective studies that include serial obestatin measurements at periodic intervals and assess changes in weight and obestatin are needed to confirm our results. Another limitation is not having investigated exercise participation and basal metabolic rate.
The reported results regarding obestatin in hemodialysis patients vary. An increasing number of studies have been investigating obestatin in hemodialysis patients, a population characterized by poor energy intake, multiple concomitant systemic diseases, and eating disorders, and who are at risk of malnutrition. That said, the available literature is inadequate to reach a conclusion. Further prospective randomized studies with larger samples are needed for a more comprehensive understanding.


