Integration of Existing Data on the Utility of Beta-2-Microglobulin during Human Pregnancy as a Biomarker of Fetal Renal Function Development
- 1. Certara Predictive Technologies Division, Certara UK, United Kingdom
Citation
Abduljalil K (2025) Integration of Existing Data on the Utility of Beta-2-Microglobulin during Human Pregnancy as a Biomarker of Fetal Renal Function Development. J Pharmacol Clin Toxicol 13(1):1190.
ABBREVIATIONS
B2MG: Beta-2-microglobulin; GW: Gestational week.
INTRODUCTION
Beta-2-microglobulin (B2MG) is a low molecular weight protein (11.8 kDa), that associates with the major histocompatibility complex I on the surface of all nucleated cells [1]. It is synthesized by all nucleated cells in different tissues and released into the circulation, with a synthesis rate of 0.13 mg/h/kg body weight in healthy adults [2]. In vitro studies showed that tumor cells and lymphocytes are high B2MG producers [3]. B2MG is eliminated almost exclusively through renal filtration. More than 99.9% of the filtered B2MG is subsequently actively reabsorbed in the renal proximal tubule cells with only trace amounts are recovered in the final urine, especially in acidic urinary pH [2,4]. The renal proximal tubule cells are densely packed with mitochondria to supply energy to the active transport in the proximal tubules. This active process, usually in one direction, involves the uptake of molecules from the tubule lumen back into the cell against their concentration or electrochemical gradients.
Due to its link to the immune response, B2MG serum level has been found to be elevated in cases of infections, inflammations, and various malignant diseases [1,2,5]. In patients with impaired renal function (creatinine clearance < 30 mL/min), both serum and urinary B2MG levels rise own to approximately 50% decrease in tubular reabsorption compared with individuals with normal renal function [1,2,4]. These data suggest the utility of this biomarker in several renal and non-renal diseases.
In normal pregnancy, both maternal serum and urinary B2MG levels remain at the non-pregnant level during 1st and 2nd trimesters with slight increase in the third trimesters, secondary to a reduced renal filtration [6,7]. In pre-eclamptic patients, where renal function is impaired, characterized by proteinuria, reduced glomerular filtration, and decreased renal blood perfusion [8],maternal plasma level of B2MG is significantly elevated compared to those of healthy pregnant women [9,10]. Fetal tissues, including liver, kidney, thymus, testis, lung, skin, are capable of autonomous synthesis of B2MG [11]. However, the development of the utero-placental unit does not contribute significantly to the maternal serum B2MG levels and is unlikely to cross the placenta barrier [9,12].
Various studies investigated the role of B2MG as a renal filtration marker to infer the morphological and functional development of the fetal kidneys [12-18]. Due to immaturity of fetal kidney filtration, fetal serum B2MG was reported to be two times higher than the normal adult serum level (1.6 mg/L in 1514 healthy young adults [19], versus 2.93 mg/L in 123 normal fetuses aged between 17 and 37 gestational weeks (GWs) [20]). Because of ethical and clinical restriction, direct access to the fetal urine via renal puncture has been performed only in limited studies in fetuses with obstructive uropathy, hydronephrosis, and nephropathies [16,17,21,22]. The amniotic B2MG level, however, has also been evaluated as an alternative sampling site to infer the development of fetal renal reabsorption and catabolism mechanism [18,23]. So that any observed reduction in the fetal urinary and amniotic B2MG levels can be attributed to the ontogeny of the fetal tubular reabsorption and catabolism.
Integrating published data on B2MG that are scattered in different studies to develop algorithms that describe the protein changes in different maternal and fetal matrices and their trajectories can improve our understanding of the time and magnitude of underlying physiological changes. Better description of B2MG changes during pregnancy is not only clinically relevant to provide reference intervals for normal fetal development, but also to better understand the ontogeny profile of the active reabsorption in the fetal renal tubules. The later goal can unlock the path for approaches to attenuate or avoid any possible adverse effects to the fetal kidney when maternal exposure to xenobiotics cannot be avoided.
The aims of this work are therefore (a) to compile and integrate existing studies on B2MG in the fetal serum, fetal urine, amniotic fluid, and maternal serum; and (b) to derive a mathematical relationship quantifying the ontogeny of B2MG during pregnancy, where data allow.
MATERIALS AND METHODS
Literature Search
Searches for published literature articles relating to B2GM level in fetal and maternal plasma, umbilical, urinary and amniotic fluid was carried out using PubMed (https://pubmed.ncbi.nlm.nih.gov/) and Google Scholar (https:// scholar.google.com/) for clinical data until February 2025. Examples of key words used in the searches include B2MG, or beta-2 microglobulin in addition to other key words such as pregnancy, maternal, fetal, urine, urinary, and amniotic. References within the individual search results were also checked to identify any additional articles that may have been missed in the initial search.
One of the initial selection criteria was to only include studies carried out in the Caucasian population. Data from individuals with diseases that are known to affect the B2MG level were excluded. Where data were given in figures, they were extracted using GetData Graph Digitizer V2.26.0.20 (http://getdata-graph-digitizer.com). Data were recorded from different studies and converted to a standard unit of mg/L, when reported in a different unit. If the gestational ages or B2MG values of the studied individuals were given as a range, the middle value was used in the analysis. Finally, data analyses were performed using the Microsoft Excel (https://office.microsoft.com/excel)
Data Analysis
From each individual study, mean and standard deviation (SD) for B2MG in the amniotic fluid, in fetal urine and fetal serum as well as in the maternal serum at the different gestational ages in weeks (GW) were calculated. The fetal age in weeks (FA) was calculated from the GW (FA= GW-2). The weighted mean (µ) from the different studies was then calculated using Eq. 1.
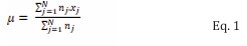
where nj is the number of observations in the jth study, x j is the mean value from the jth study and N is the total number of studies for the current fetal age. Weighted standard deviation (σ*) was calculated using Eq. 2.
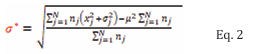
Where nj is the number of observations in the jth study; N is the number of studies for the current fetal age; xj and σj is the mean and standard deviation of the B2MG respectively in the jth study, and µ is the weighted average across all N studies for the current fetal age (as given by Equation 1). To quantify the fit to data of the regression analyses, a weighted mean squared error (MSE) was used, given by Eq. 3.
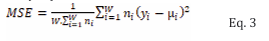
Where W is the total number of sampling times for the different fetal ages; ni is the total number of observations across all studies in the ith week; yi is the predicted B2MG in the ith week, and µi is the weighted mean of the B2MG of all subjects in the ith week across all studies. Weighted regression analyses were carried out for potential functions, namely Weibull and Gaussian functions. Each function’s parameters were optimized using Microsoft built-in Excel’s solver functionalities. The function with lowest weighted mean squared error value was then selected.
RESULTS
Maternal plasma B2MG: Maternal plasma B2MG levels during pregnancy were retrieved from 11 studies (1240 observations) between 6 and 40 GWs as well as in non pregnant women (Table 1).
Table 1: Collected studies reported B2MG level during pregnancy*
|
Study |
Population details |
Assay |
Data available |
|||
|
Maternal serum |
Fetal serum |
Fetal urine |
Amniotic fluid |
|||
|
Juraschek et al., 2013 [19] |
825 healthy non-pregnant women at productive age (20-39 years) |
Immunonephelometric assays |
Yes (N=825) |
|
|
|
|
Swanson et al., 1982 [41] |
21 healthy non-pregnant women aged 20 - 59 years |
Radioimmunoassay with Monoclonal Antibody |
Yes (N=21) |
|
|
|
|
Kristensen et al., 2007a [6] |
healthy women (398 pregnant (6 - 42 GWs) women divided into 4 groups and 58 non-pregnant) |
Immunoturbidimetric |
Yes (N= 456) |
|
|
|
|
Kristensen et al., 2007b [42] |
218 normal and 57 Pre-eclampsia pregnant patients (25 - 41 GWs) |
Immunoturbidimetric assay |
Yes (N=218) |
|
|
|
|
Bischof et al., 1984 [43] |
167 blood samples from 152 normal pregnant women (7 - 40 GWs) |
Radioimmunoassay |
Yes (N=152) |
|
|
|
|
Gulbis et al., 1996 [15] |
37 healthy women with advanced maternal age |
Radioimmunoassay |
Yes (N=50) |
|
|
Yes (N=59) |
|
Jauniaux et al., 1998 [44] |
Pregnant women (11 - 16 GWs) opted for surgical termination of pregnancy due to fetal polysomy. |
Radioimmunoassay |
Yes (n=32) |
Yes (n=13) |
|
Yes (N=32) |
|
Nolte et al., 1991 [12] |
133 pregnant women between 25 and 42 GWs |
Radioimmunoassay |
Yes (N=133) |
Yes (N=133) |
|
|
|
Kristensen et al., 2008 [9] |
27 heathy pregnant women at term (>= 37 weeks) |
Immunoturbidimetric assay |
Yes (N=27) |
Yes (N=27) |
|
Yes (N=27) |
|
Jonasson et al., 1974 [24] |
Total of 136 normal pregnant women Maternal and amniotic samples obtained (13 - 42 GWs). Urine samples obtained from the first urine of 9 normal neonates (39 - 43 GWs) |
Radioimmunoassay |
Yes (N=73) |
Yes (N=17) |
Yes (N=9) |
Yes (N=73) |
|
Cobet et al., 1996 [20] |
Pregnant women (17 -37 GWs) |
Two-site microparticle enzyme immunoassay |
|
Yes (n=123) |
|
|
|
Spaggiari et al., 2017 [40] |
A total of 116 pregnancy (19 - 40 GWs) |
Immunoturbidimetry |
|
Yes (n=116) |
|
|
|
Tassis et al., 1997 [45] |
53 normal pregnancies (18 - 38 GWs) |
Chemiluminescent immunometric assay |
|
Yes (N=53) |
|
|
|
Berry et al., 1995 [46] |
64 healthy pregnant women (18 - 38 GWs) |
Radioimmunoassay |
|
Yes (N=64) |
|
|
|
Bokenkamp et al., 2001 [38] |
Pregnant women (19 - 36 GWs) |
Particle-enhanced immunoturbidimetry |
|
Yes (N= |
|
|
|
Nguyen et al., 2013 [39] |
Pregnant women (22 - 40 GWs) 36 fetal with postnatal normal renal function |
Immunoturbidimetry |
|
Yes (N= 36) |
|
|
|
Cejka et al., 1974 [11] |
Pregnant women (16 - 36 GWs) had spontaneous or Cesarean abortions |
Radioactive single radialimmuno-diffusion |
|
Yes (N= 12) |
|
|
|
Abdennadher et al., 2015 [22] |
Pregnant women (39 - 43 GWs). A total of 9 fetuses with normal renal structure appearance or function |
Immunoturbidimetry |
|
|
Yes (N=9) |
|
|
Muller et al., 1996 [16] |
Pregnant women (20 - 37 GWs). Fetuses (n=41) with normal renal structure appearance or function |
Radioimmunoassay |
|
|
Yes (N=41) |
|
|
Spaggiari et al., 2018 [17] |
A total of 16 fetuses (19-35 GWs) with favourable outcomes. |
Immunoturbidimetry |
|
|
Yes (N=16) |
|
|
Burghard et al., 1987, Burghard et al., 1988 [14, 26] |
Urine samples were collected from the first urine of 31 healthy infants (28 - 38 GWs). Additional data from pregnancies (16 - 27 GWs), without any further details. |
Enzyme immunoassay |
|
|
Yes (N=31) |
|
|
Takieddine et al., 1983 [18] |
Urine samples were collected from the first urine of 9 preterm and 16 full-term neonates (32 - 40 GWs) |
Modified radial immunodiffusion method. |
|
|
Yes (N=25) |
|
|
Cagdas et al., 2000 [23] |
Data from first postnatal urine of 28 normal neonates aged 26 - 40 GWs. Total of 69 amniotic fluid samples from pregnant women (16 - 40 GWs) |
Photo-densitometry |
|
|
Yes (N=28) |
Yes (N=69) |
|
Hadnagy et al., 1985 [47] |
Total of 85 normal pregnancy (16 - 42 GWs) |
Enzyme immunoassay |
|
|
|
Yes (N= 85) |
|
Mussap et al., 1996 [48] |
total of 141 normal pregnant women (15 - 36 GWs) |
Immunoturbidimetric |
|
|
|
Yes (N= 141) |
|
Burghard et al., 1987b [49] |
total of 171 normal pregnant women (16 - 38 GWs) |
Enzyme immunoassay |
|
|
|
Yes (N= 171) |
|
Ayd?n et al., 2015 [50] |
total of 97 normal pregnant women (15 - 20 GWs) |
Radioimmunoassay |
|
|
|
Yes (N=97) |
|
Puolakka et al., 1982 [51] |
total of 58 normal pregnant women (32 - 42 GWs) |
Radioimmunoassay |
|
|
|
Yes (N=58) |
Retrieved measurements from these studies are given in Table S1 of the supplementary materials. Pooling observed data indicated that maternal B2MG level slightly decreased from the non-pregnant value of 1.53±0.34 mg/L to 1.35±0.32 mg/L at 15 GWs, then gradually increased to 1.40±0.33, 1.62±0.38, and 2.03±0.48 mg/L at 20, 30, and 40 GWs, respectively. These observations were best described using equation 4 with a constant coefficient of variation (CV) of 30% (Figure 1).
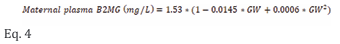
where GW represents the gestational week.
Fetal plasma B2MG: Fetal plasma B2MG levels were retrieved from 10 studies (653 observations) between 12 and 40 GWs (Table 1). Retrieved B2MG concentrations in the fetal serum are given in Table S2 of the supplementary materials. Individual data were available from five independent studies that allowed data to be pooled together to derive the following equation (Eq. 5) that can be used to predict fetal serum B2MG with a constant CV of 30% (Figure 2a).
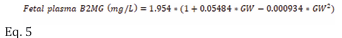
where GW is the gestational week. The adequacy of the derived model can be observed in Figure 2b as the summary data from different studies were well-overlayed on the predicted profiles from the individual data.
Fetal urinary B2MG: Three studies provided data on fetal urinary B2MG levels [16,17,22]. Because these data show distinct trends and significant variability (Table 1 and Figure 3), when converted to a standard unit of mg/L (1 µmol/L = 11.8 mg/L), they were not fitted to any model.
Additionally, B2MG measurements in the first neonatal urine collected within 4 - 6 hours after delivery of healthy preterm and term neonates were reported in 4 studies [14,18,23,24] were used as a proxy of fetal urinary levels and were described using equation 6 with 30% CV (Figure 3).
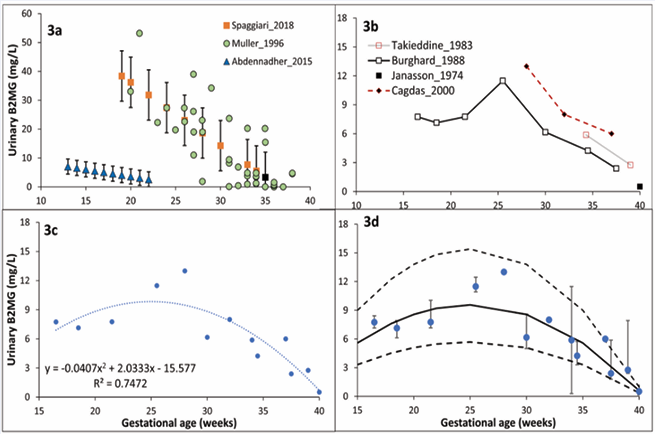
Figure 3 Urinary B2MG level during pregnancy. Plot 3a shows published individual [16], and reference [17,22], values in “normal” fetal urine. Plot 3b shows published mean values in the first preterm and term neonate urine [18,26]. Plot 3c represents model fit for neonatal values in plot 3b. Plot 3d is the prediction space for urinary B2MG assuming a 30% constant CV for the model fit in plot 3c. Different markers represent observations (bars represent observed variability), overlaid on the predicted median and 5th & 95th percentile intervals (solid and dashed lines).
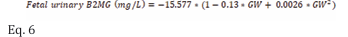
.where GW represents the gestational week. Table S3 of the supplementary materials provides retrieved B2MG measurements in the fetal and neonatal urine at various GWs.
Amniotic B2MG: Retrieved data on amniotic B2MG levels in normal pregnancies were available from 13 studies (Table 4), and their detailed measurements are given in Table S4 of the supplementary materials. The collected data indicated that the mean amniotic B2MG concentration increased during the first half of pregnancy from 1.46±0.42 mg/L at 10 GW reaching a peak of 9.28±2.65 mg/L at 23 GW then gradually decreased to 1.23±0.35 mg/L at term (Figure 4). The changes in amniotic B2MG levels during pregnancy were best described by a Weibull function with 30% CV (Eq. 7):
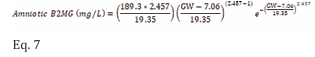
where GW represents the gestational week.
Predicted maternal, fetal and amniotic B2MG concentrations during normal pregnancy using the derived equations are given in Table 2.
Table 2: Predicted B2MG values (mg/L) in maternal serum, fetal serum, fetal urine, and amniotic level at different gestational weeks.
|
|
|
10 GW |
15 GW |
20 GW |
25 GW |
30 GW |
35 GW |
40 GW |
|
Maternal serum |
Median |
1.33 (0.92-1.91) |
1.34 (0.93-1.92) |
1.39 (0.96-1.99) |
1.48 (1.02-2.12) |
1.61 (1.12-2.31) |
1.79 (1.24-2.56) |
2.01 (1.39-2.88) |
|
Mean±SD |
1.35±0.32 |
1.35±0.32 |
1.40±0.33 |
1.49±0.35 |
1.62±0.38 |
1.81±0.43 |
2.03±0.48 |
|
|
Fetal serum |
Median |
NA |
2.96 (1.84-4.98) |
3.16 (1.96-5.33) |
3.28 (2.04-5.52) |
3.31 (2.06-5.58) |
3.26 (2.02-5.49) |
3.12 (1.94-5.25) |
|
Mean±SD |
NA |
3.09±0.95 |
3.31±1.02 |
3.43±1.06 |
3.46±1.07 |
3.41±1.05 |
3.26±1.01 |
|
|
Amniotic* |
Median |
1.43 (0.92-2.20) |
5.50 (3.55-8.45) |
8.65 (5.58 - 13.28) |
8.80 (5.67-13.51) |
6.32 (4.08-9.71) |
3.27 (2.11-5.02) |
1.21 (0.78-1.86) |
|
Mean±SD |
1.46±0.42 |
5.59±1.60 |
8.79±2.51 |
8.94±2.55 |
6.42±1.83 |
3.32±0.95 |
1.23±0.35 |
|
|
Fetal urine** |
Median |
NA |
5.34 (3.32-8.99) |
8.19 (5.09-13.8) |
9.14 (5.68-15.4) |
8.19 (5.09-13.8) |
5.34 (3.32-8.99) |
0.58 (0.36-0.99) |
|
Mean±SD |
NA |
5.59±1.72 |
8.57±2.64 |
9.56±2.95 |
8.57±2.64 |
5.59±1.72 |
0.61±0.19 |
DISCUSSION
Published measured B2MG concentrations during pregnancy were compiled from various existence resources to draw a conclusion on the maturation of fetal renal active reabsorption process. The work was carried out to supplement previous analysis that describes the maturation of the fetal passive glomerular filtration using creatinine [25]. Combining available B2MG data from various studies provides a better picture on the change of this protein during pregnancy. In the light of the existing data, maternal serum B2MG stays about the same as the non-pregnant level until the end of the second trimester, after which it modestly rises as the gestation progresses and reaches its maximum level at term (Figure 1).
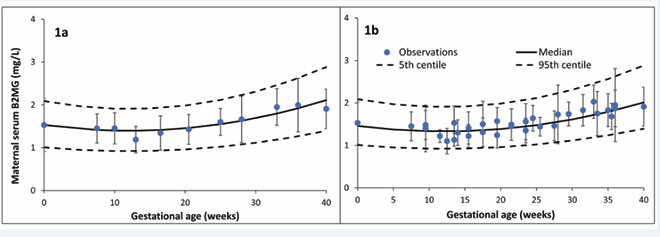
Figure 1 Maternal plasma B2MG level during pregnancy. Plot 1a shows combined data used to derive the relationship (model fit), while Plot 1b shows means and standard deviations from each individual study (squares with error bars) overlaid on the predicted median and 5th & 95th percentile intervals (solid and dashed lines).
Fetal serum B2MG level is higher than maternal level and almost stable during healthy pregnancy (Figure 2).
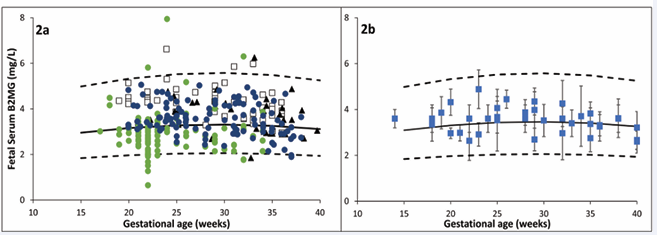
Figure 2 Fetal serum B2MG level during pregnancy. Plot 2a shows individual data [20, 24, 38-40] used to derive the relationship during pregnancy, while Plot 2b shows means and standard deviations from each individual study (squares with error bars) overlaid on the predicted median and 5th & 95th predictive intervals (solid and dashed lines).
Amniotic B2MG concentration does not mirror B2MG changes in the maternal or fetal serum, rather than showed unique bell shaped pattern. It increases steadily during the first half of pregnancy, reaching its peak between 20 and 25 GWs, then declines again toward term (Figure 4).
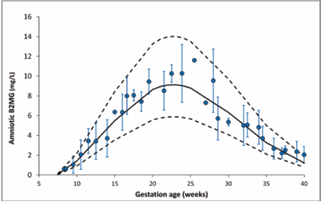
Figure 4 Amniotic fluid B2MG level during pregnancy. Circles represent collected clinical data, error bars represent SD, solid and dashed lines represent the predicted median and 5th-95th percentile intervals for the derived equation assuming a constant CV of 30%.
It is likely that the initial increase in the amniotic B2MG reflects the normal fetal glomerulus development (numbers and function) as well as the development of the urination process, while the reduction in the second half of pregnancy reflects mainly the maturation of B2MG reabsorption and metabolism in the normal renal proximal tubules [26,27].
An earlier work estimated that 25% of amniotic B2MG at term comes from fetal urine based on a turnover of B2MG 800-900 µg/day in amniotic fluid and an inflow of 200 µg/ day from fetal urine [24]. Because of the discrepancy in the measured fetal urinary B2GM data (Figure 3) [16,17,22], no attempts were made to fit them to any model. Instead, measured B2MG from the first urine of preterm and term neonates with normal renal function were collected and analyzed assuming that these data reflect the fetal renal function. Retrieved data [14,18,23,24] indicated a continuous decrease of urinary B2MG in the second half of pregnancy mimicking the amniotic B2MG trend. By the 10th GWs, fetal urine begins to enter the amniotic space, and by the 20th GWs, fetal urine makes up roughly 90% of the amniotic fluid (see [28] and references therein). A previous analysis showed that the fetal urine production rate increases steadily throughout the second half of pregnancy [25]. The delayed maturation of tubular reabsorption in contrast to glomerular function can account for the difference between serum and urine levels. The equilibrium between these two processes is thought to occur at roughly 35 GWs [21].
The proximal tubule uptake for B2MG is believed to be mediated by megalin, a multiligand endocytic receptor that is expressed on the apical membrane of proximal tubules [27,29,30]. The aberrant shedding of this protein, as in diabetes type 1 patients, increases the urinary concentration of megalin-ligands, including B2MG [29,30]. Low expression of renal membrane-bound megalin in preterm neonates resulted in an increase in megalin ligands in urine [31]. Once B2MG is reabsorbed from the renal tubule lumen via megalin-mediated endocytosis pathway [27,32], it undergoes endocytic internalization and degradation within the renal proximal tubules [1,2]. The pharmacological and toxicological clinical relevance of understanding this process has been demonstrated when tubular cell injury was significantly attenuated after blocking the megalin function [32]. Similarly, the renal accumulation and toxicity of gentamicin was prevented by cytochrome c, an aminoglycoside binding receptor antagonist [33]. Understanding the maturation of this endocytic pathway will help to avoid any potential nephrotoxic effect of chemicals on the maternal and fetal kidney. It can also explain any observed teratogenicity to the fetal kidney upon inevitable or unintended maternal exposure to such molecules. The growing kidney of the fetus is more vulnerable to renal toxicity, teratogenicity, or even disruption of normal development caused by xenobiotics, which can have postnatal health consequences, such as hypertension [34]. Sinc megalin is known to be expressed in cytotrophoblasts, the highly proliferative cells in the placenta [35], understanding this mechanism can help to prevent and avoid any possible adverse effects to the placenta. To achieve these goals, the expression of B2MG in the placenta and renal tubules at different gestation weeks must be quantified.
Description of the normal level of B2MG is useful to describe the impact of renal disorders. Different renal disfunction can affect the level of B2MG in certain aspects. For example, elevated fetal serum levels can indicate dysfunction of the glomerulus filtration, while increasing urinary (and amniotic) B2MG levels is a sign of reduction in the renal tubular reabsorption (Figure 5).
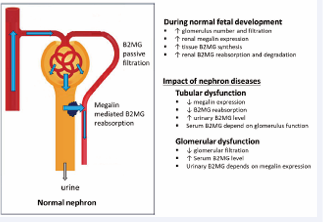
Figure 5 Example of pathophysiological changes that can affect fetal B2MG level.
It should be noted that, during this analysis, different limitations were encountered. Available urinary B2MG data were of low quality with limited observations at different weeks of pregnancy. Further studies are required for better characterization of urinary B2MG maturation in utero. Longitudinal data were limited, and hence cross sectional studies were integrated at different gestational weeks to derive longitudinal functions and embark on overall conclusions. Longitudinal quantification of the impact of different fetal disorders that affect the formation and disposition of B2MG as well as the dynamics of the amniotic fluid are required for better understanding the kinetics of B2MG and its diagnostic value for the assessment of disturbed fetal kidney function. Different studies reported their results in different statistical terms and units. This required additional data preparation steps to bring them to a standard format before the analysis step. Individuals’ data were not reported across the different studies to enable quantification of the influencing (maternal and fetal) covariates and how their impact is affected by the presence of co-morbidity. Despite these limitations, functions have been derived to describe changes in B2MG during human pregnancy. Integrating this knowledge within physiologically based feto-maternal quantitative system pharmacology platforms [36-40], can help in assessing scenarios that are otherwise difficult or impossible to investigate due to ethical and clinical constraints
CONCLUSION
Maternal, fetal and amniotic fetal B2MG levels during normal pregnancy have been described mathematically based on the available data. These algorithms can be used to predict the level of B2MG at any gestational age and serve as references. They can be integrated within quantitative pharmacology platforms to understand the impact of comorbidity and other fetal and maternal factors as well as in designing future clinical studies. Future work is required to understand the molecular mechanism of renal reabsorption maturation for prevention of nephrotoxicity in the developing kidney of the fetus as well as in the maternal kidney.
REFERENCES
- Argyropoulos CP, Chen SS, Ng YH, Roumelioti ME, Shaffi K, Singh PP, et al. Rediscovering Beta-2 Microglobulin as a Biomarker across the Spectrum of Kidney Diseases. Front Med (Lausanne). 2017; 4: 73.
- Karlsson FA, Wibell L, Evrin PE. beta 2-Microglobulin in clinical medicine. Scand J Clin Lab Invest Suppl. 1980; 154: 27-37.
- Nilsson K, Evrin PE, Welsh KI. Production of beta 2-microglobulin by normal and malignant human cell lines and peripheral lymphocytes. Transplant Rev. 1974; 21: 53-84.
- Vree TB, Guelen PJ, Jongman-Nix B, Walenkamp GH. The relationship between the renal clearance of creatinine and the apparent renal clearance of beta-2-microglobulin in patients with normal and impaired kidney function. Clin Chim Acta. 1981; 114: 93-99.
- Martinez-Bru C, Cortes M, Planella T, Barrio J, Cadafalch J, Domingo P, et al. Beta 2-microglobulin and immunoglobulins are more useful markers of disease progression in HIV than neopterin and adenosine deaminase. Ann Clin Biochem. 1999; 36: 601-608.
- Kristensen K, Lindstrom V, Schmidt C, Blirup-Jensen S, Grubb A, Wide-Swensson D, et al. Temporal changes of the plasma levels of cystatin C, beta-trace protein, beta2-microglobulin, urate and creatinine during pregnancy indicate continuous alterations in the renal filtration process. Scand J Clin Lab Invest. 2007; 67: 612-618.
- Kelly AM, McNay MB, McEwan HP. Renal tubular function in normal pregnancy. Br J Obstet Gynaecol. 1978; 85: 190-196.
- Moghaddas Sani H, Zununi Vahed S, Ardalan M. Preeclampsia: A close look at renal dysfunction. Biomed Pharmacother. 2019; 109: 408-416.
- Kristensen K, Strevens H, Lindstrom V, Grubb A, Wide-Swensson D. Increased plasma levels of beta2-microglobulin, cystatin C and beta-trace protein in term pregnancy are not due to utero-placental production. Scand J Clin Lab Invest. 2008; 68: 649-653.
- Saudan PJ, Farrell TJ, Brown MA. Beta2-microglobulin in hypertensive pregnancies. Am J Kidney Dis. 1998; 31: 308-312.
- Cejka J, Kithier K, Belamaric J, al-Sarraf M. Feto-specific features of human beta2-microglobulin. Experientia. 1974; 30: 458-459.
- Nolte S, Mueller B, Pringsheim W. Serum alpha 1-microglobulin and beta 2-microglobulin for the estimation of fetal glomerular renal function. Pediatr Nephrol. 1991; 5: 573-577.
- Grangé G, Leguy MC, Tsatsaris V, Guibourdenche J. Fetal Beta2- Microglobulin as a Biomarker of Kidney Disease. In: Patel VB, Preedy VR, editors. Biomarkers in Kidney Disease. Dordrecht: Springer Netherlands. 2016; 491-514.
- Burghard R, Leititis JU, Etzold S, Gordjani N. Proteins in amniotic fluid as an index of kidney function and dysfunction in the fetus. Contrib Nephrol. 1988; 68: 250-258.
- Gulbis B, Jauniaux E, Jurkovic D, Gervy C, Ooms HA. Biochemical investigation of fetal renal maturation in early pregnancy. Pediatr Res. 1996; 39: 731-735.
- Muller F, Dommergues M, Bussieres L, Lortat-Jacob S, Loirat C, Oury JF,Argyropoulos CP, Chen SS, Ng YH, Roumelioti ME, Shaffi K, Singh PP, et al. Rediscovering Beta-2 Microglobulin as a Biomarker across the Spectrum of Kidney Diseases. Front Med (Lausanne). 2017; 4: 73.
- Karlsson FA, Wibell L, Evrin PE. beta 2-Microglobulin in clinical medicine. Scand J Clin Lab Invest Suppl. 1980; 154: 27-37.
- Nilsson K, Evrin PE, Welsh KI. Production of beta 2-microglobulin by normal and malignant human cell lines and peripheral lymphocytes. Transplant Rev. 1974; 21: 53-84.
- Vree TB, Guelen PJ, Jongman-Nix B, Walenkamp GH. The relationship between the renal clearance of creatinine and the apparent renal clearance of beta-2-microglobulin in patients with normal and impaired kidney function. Clin Chim Acta. 1981; 114: 93-99.
- Martinez-Bru C, Cortes M, Planella T, Barrio J, Cadafalch J, Domingo P, et al. Beta 2-microglobulin and immunoglobulins are more useful markers of disease progression in HIV than neopterin and adenosine deaminase. Ann Clin Biochem. 1999; 36: 601-608.
- Kristensen K, Lindstrom V, Schmidt C, Blirup-Jensen S, Grubb A, Wide-Swensson D, et al. Temporal changes of the plasma levels of cystatin C, beta-trace protein, beta2-microglobulin, urate and creatinine during pregnancy indicate continuous alterations in the renal filtration process. Scand J Clin Lab Invest. 2007; 67: 612-618.
- Kelly AM, McNay MB, McEwan HP. Renal tubular function in normal pregnancy. Br J Obstet Gynaecol. 1978; 85: 190-196.
- Moghaddas Sani H, Zununi Vahed S, Ardalan M. Preeclampsia: A close look at renal dysfunction. Biomed Pharmacother. 2019; 109: 408-416.
- Kristensen K, Strevens H, Lindstrom V, Grubb A, Wide-SwenssonD. Increased plasma levels of beta2-microglobulin, cystatin C and beta-trace protein in term pregnancy are not due to utero-placental production. Scand J Clin Lab Invest. 2008; 68: 649-653.
- Saudan PJ, Farrell TJ, Brown MA. Beta2-microglobulin in hypertensive pregnancies. Am J Kidney Dis. 1998; 31: 308-312.
- Cejka J, Kithier K, Belamaric J, al-Sarraf M. Feto-specific features of human beta2-microglobulin. Experientia. 1974; 30: 458-459.
- Nolte S, Mueller B, Pringsheim W. Serum alpha 1-microglobulin and beta 2-microglobulin for the estimation of fetal glomerular renal function. Pediatr Nephrol. 1991; 5: 573-577.
- Grangé G, Leguy MC, Tsatsaris V, Guibourdenche J. Fetal Beta2- Microglobulin as a Biomarker of Kidney Disease. In: Patel VB, Preedy VR, editors. Biomarkers in Kidney Disease. Dordrecht: Springer Netherlands. 2016; 491-514.
- Burghard R, Leititis JU, Etzold S, Gordjani N. Proteins in amniotic fluid as an index of kidney function and dysfunction in the fetus. Contrib Nephrol. 1988; 68: 250-258.
- Gulbis B, Jauniaux E, Jurkovic D, Gervy C, Ooms HA. Biochemical investigation of fetal renal maturation in early pregnancy. Pediatr Res. 1996; 39: 731-735.
- Muller F, Dommergues M, Bussieres L, Lortat-Jacob S, Loirat C, Oury JF,
- Mahadevappa R, Nielsen R, Christensen EI, Birn H. Megalin in acute kidney injury: foe and friend. Am J Physiol Renal Physiol. 2014; 306: F147-154.
- Watanabe A, Nagai J, Adachi Y, Katsube T, Kitahara Y, Murakami T, et al. Targeted prevention of renal accumulation and toxicity of gentamicin by aminoglycoside binding receptor antagonists. J Control Release. 2004; 95: 423-433.
- Morgan TM, Jones DP, Cooper WO. Renal teratogens. Clin Perinatol. 2014; 41: 619-632.
- Storm T, Christensen EI, Christensen JN, Kjaergaard T, Uldbjerg N, Larsen A, et al. Megalin Is Predominantly Observed in Vesicular Structures in First and Third Trimester Cytotrophoblasts of the Human Placenta. J Histochem Cytochem. 2016; 64: 769-784.
- Abduljalil K, Badhan RKS. Drug dosing during pregnancy- opportunities for physiologically based pharmacokinetic models. J Pharmacokinet Pharmacodyn. 2020; 47: 319-340.
- Abduljalil K, Ning J, Pansari A, Pan X, Jamei M. Prediction of Maternal and Fetoplacental Concentrations of Cefazolin, Cefuroxime, and Amoxicillin during Pregnancy Using Bottom-Up Physiologically Based Pharmacokinetic Models. Drug Metab Dispos. 2022; 50: 386-400.
- Bokenkamp A, Dieterich C, Dressler F, Muhlhaus K, Gembruch U, Bald R, et al. Fetal serum concentrations of cystatin C and beta2- microglobulin as predictors of postnatal kidney function. Am J Obstet Gynecol. 2001; 185: 468-475.
- Nguyen C, Dreux S, Heidet L, Czerkiewicz I, Salomon LJ, Guimiot F, et al. Fetal serum alpha-1 microglobulin for renal function assessment: comparison with beta2-microglobulin and cystatin C. Prenat Diagn. 2013; 33: 775-781.
- Spaggiari E, Faure G, Dreux S, Czerkiewicz I, Stirnemann JJ, Guimiot F, et al. Sequential fetal serum beta2-microglobulin to predict postnatal renal function in bilateral or low urinary tract obstruction. Ultrasound Obstet Gynecol. 2017; 49: 617-622.
- Swanson RA, Tracy RP, Katzmann JA, Wilson DM, Young DS. Beta 2-microglobulin determined by radioimmunoassay with monoclonal antibody. Clin Chem. 1982; 28: 2033-2039.
- Kristensen K, Wide-Swensson D, Schmidt C, Blirup-Jensen S, Lindstrom V, Strevens H, et al. Cystatin C, beta-2-microglobulin and beta-trace protein in pre-eclampsia. Acta Obstet Gynecol Scand. 2007; 86: 921-926.
- Bischof P, Gruffat C, Jeannet M, Hoffmeyer D, Herrmann WL, Beguin F, et al. Circulating beta-2-microglobulin levels during pregnancy and their possible relationship with feto-maternal histocompatibility. J Perinat Med. 1984; 12: 13-17.
- Jauniaux E, Gulbis B, Hyett J, Nicolaides KH. Biochemical analyses of mesenchymal fluid in early pregnancy. Am J Obstet Gynecol. 1998; 178: 765-769.
- Tassis BM, Trespidi L, Tirelli AS, Pace E, Boschetto C, Nicolini U. Serum beta 2-microglobulin in fetuses with urinary tract anomalies. Am J Obstet Gynecol. 1997; 176: 54-57.
- Berry SM, Lecolier B, Smith RS, Bercau G, Dombrowski MP, Puder KS, et al. Predictive value of fetal serum beta 2-microglobulin for neonatal renal function. Lancet. 1995; 345: 1277-1278.
- Hadnagy J, Pacsa S, Pejtsik B, Csaba IF. Amniotic fluid beta-2 microglobulin in normal and complicated pregnancies. Acta Physiol Hung. 1985; 65: 507-510.
- Mussap M, Fanos V, Piccoli A, Zaninotto M, Padovani EM, Plebani M. Low molecular mass proteins and urinary enzymes in amniotic fluid of healthy pregnant women at progressive stages of gestation. Clin Biochem. 1996; 29: 51-56.
- Burghard R, Pallacks R, Gordjani N, Leititis JU, Hackeloer BJ, BrandisM. Microproteins in amniotic fluid as an index of changes in fetal renal function during development. Pediatr Nephrol. 1987; 1: 574-580.
- Ayd?n E, Beksaç AT, Karaa?ao?lu E, Beksaç M. Amniotic Fluid β2- Microglobulin Measurements. Gynecol Obstet Reprod Med. 2015; 21: 1-3.
- Puolakka J, Ylostalo P, Tuimala R, Haapalahti J, Jarvinen PA. Amniotic fluid beta-2-microglobulin in normal and complicated pregnancies. Correlation with gestational age, creatinine concentration and L/S ratio. Gynecol Obstet Invest. 1982; 13: 129-134.


