The Effect of Atmospheric Precookers and Vacuum Precookers on Tuna Cooking Weight Losses
- 1. International Tuna Consultant, Bangkok, Thailand
- 2. Retired, Encinitas, California
- 3. GraphPad Software, San Diego, California
- 4. International Tuna Consultant, Galicia, Spain
Abstract
Total weight losses produced during the industrial precooking of skipjack (Katsuwonus pelamis) and yellowfin (Thunnus albacares) tuna in the two most commonly used commercial precookers, atmospheric (APC) and vacuum precookers (VPCs) were studied. The purpose of precooking is to stabilize the fish flesh for cleaning. The tuna were precooked to a target backbone temperature of 60°C to balance the prevention of histamine formation and weight loss from heating. The weight losses were significantly different for fish of various sizes between precooking the tuna in an APC and the VPCs. We postulate that the difference is due to the venting phase preceding the heating and cooling phases. The overall difference in weight loss for skipjack was 1.1% and for yellowfin was 1.5% and fish of the same size that were precooked in the APC lost more weight than fish precooked in the VPCs.
Keywords
• Precooking
• Tuna processing
• Vacuum precookers
• Venting
• Tuna precookers
Citation
Lord CW, DeBeer J, Colton J, Espiñeira BD (2021) The Effect of Atmospheric Precookers and Vacuum Precookers on Tuna Cooking Weight Losses. Ann Food Process Preserv 5(1): 1031.
INTRODUCTION
Study objective
The primary objective of this study is to compare the precooking weight losses that result from using different types of tuna precookers (cookers) in a factory in Ecuador. In this paper, the terms precookers and cookers will be used interchangeably. The tuna precooking process uses saturated steam (steam under pressure) to heat the fish until the core or backbone reaches 60°C [1]. After heating, the fish are cooled as quickly as possible prior to cleaning. Cleaning separates the edible meat from the inedible meat. The edible meat is then “canned,” i.e. packed either into cans, pouches, or jars for retorting, or packed into plastic and sealed bags for freezing as tuna loins and shipped to other facilities for canning.
The process of precooking and its effect on tuna meat has been described many times [2-7]. This study further evaluates critical factors of different precooking systems. The primary objective of the precooking process is to produce edible meat for canning (tuna recovery) with the least amount of weight loss from the whole tuna purchased. All seafood processed for and consumed in the United States must comply with the Seafood Hazard Analysis and Critical Control Point (HACCP) processing food safety system regulations and guidelines, detailed in 21CFR§123 [8,9]. An important potential hazard during the harvest and processing of tuna is the formation of histamine either in raw [10,11] or precooked fish [9]. This potential for histamine formation in tuna or similar species has been reviewed by Hungerford [12]. In recent years, controlling histamine formation during precooking as a CCP using CLs has been validated [1,13]. A CL of a minimum of 60°C at the backbone for every fish has been validated to prevent histamine formation during precooking [1].
Tuna canning description
The process of tuna canning usually involves two heating steps: precooking and then retorting. First, there are distinct processing steps or procedures for precooking the raw fish and cooling it, cleaning and reducing the cooked edible meat in piece size, and then filling this meat into containers. Second, these containers are then heated under pressure in various types of retorts (e.g., pure steam, water spray, etc.) to achieve commercial sterility. A flow chart for the complete tuna canning process is provided in DeBeer et al. [14].
Changes in the weight of the tuna during the overall processing primarily occur during the butchering, precooking, side spray cooling, and cleaning processes. The chill room staging step may also have a minor effect. As the raw tuna is processed into edible meat suitable for canning, various components are lost, discarded, or used in other products. The weight change or loss during precooking results as various juices (water, soluble proteins, and fish oils) are released from the tuna body as it is heated [2]. By-products other than edible meat are produced at multiple process steps. For example, viscera, skin, and bones from the butchering and cleaning steps are processed into fish meal. The red meat or dark muscle is separated from the white or edible meat during cleaning and is processed into pet food products [15].
The weight of the cleaned tuna meat in retorted cans compared to the weight of the frozen whole fish weight is called recovery. This recovery number (the weight of the recovered meat after cleaning divided by the weight of the frozen raw tuna) is expressed as a percentage and is a critical measure of cannery operations [16]. Recovery rates increase by fish size, thus larger tuna provide more usable meat than smaller tuna do, and thus canneries will pay more for larger whole round tuna than they do for smaller tuna [16]. The economic importance of saving 1% recovery or precooking weight losses from the 2.5 million mt tuna of tuna harvested annually for canning is huge [17]. For example, in a cannery processing 50,000 mt annually, a 1% increase in precooked meat recovery results in a savings of 500 mt, either by having extra fish meat after cleaning to pack and sell or by reducing the quantity of fish to purchase. At a price of $1,200/mt, this 500 mt represents a possible savings of $600,000 in raw fish purchases.
Tuna precooker types
There are two primary types of tuna precookers in common use in 2021: atmospheric precookers (APCs) and vacuum precookers (VPCs) [3,4]. The difference lies in the way they execute their functions. Briefly, a precooker cycle has three phases: venting, heating, and cooling. Venting removes the air and replaces it with saturated steam, and then the heating and cooking of the tuna is accomplished with more saturated steam. After the heating phase is completed, the steam is stopped, and the cooling phase begins using circulating air, water with a spray system, or a combination of both to stop the residual internal heating and cool the fish [3,4,6,7]. A more complete description follows.
Venting
The main operational differences between the VPCs and the APC in this factory occur during the venting phase. The venting phase in the APC is accomplished by pushing the air out of the chamber using saturated steam until only the fish and steam remain, then the heating phase begins using saturated steam at atmospheric pressure. For venting in the VPCs, the air is removed from the chamber by creating a vacuum, after most of the air is removed, steam is introduced, and the heating phase begins as the temperature and pressure of the steam are increased to the operator’s desired set point. Various electro-mechanical valves and pumps are controlled by electronic software and are opened and closed to provide saturated steam to heat the tuna. This system then provides air and water to cool the fish. Precooking in a vacuum chamber was patented in the early 1960s [18,19], but was not commercially used until the pressures and temperatures in the precookers could be controlled by sophisticated automated control systems [20,21].
For proper venting of an APC, the steam must first replace air in every part of the precooker. The densities of dry air and steam at 100°C are 0.947 kg/m3 and 0.597 kg/m3 , respectively [22]. At the beginning of precooking, the ambient air is even heavier, with a density at 25°C of 1.184 kg/m3 . Since the air is denser than steam, the air will naturally sink to the bottom of the precooker during venting. The removal of the air by steam from a precooker has not been well described; however, another application of venting a closed chamber prior to heating is quite well described and regulated. This process is the retorting of canned tuna (pressure cooking to commercial sterility), where saturated steam is used to preserve the tuna which is in sealed cans, cups, or pouches [23]. Large volumes of steam are required for this operation, similar to venting in a retort [23,24]. In retorts, air is swept out by steam feed lines or inlets at the opposite end of the retort from the exhaust valve. This venting process requires up to 50% of the total steam usage of the retort process [24, 25]. The minimum retort steam header line pressure is 90 psi (166°C), as mandated by the USFDA [26]. Since air is almost twice as heavy as saturated steam, the steam enters from the bottom of the retort and forces the air out of the top to avoid and remove air pockets [23]. This process is the same desired effect in standard tuna cookers (APCs). During the retort process, the venting occurs with the main header line pressure, but, when the venting stops, the steam reduction valve is closed, and heating is accomplished with the reduced line pressure. A reduction valve reduces the pressure to 15 to 30 psi for the use of steam in ordinary retort heating. Venting to remove the air from the closed chamber is a critical step of the retort process and, hence, to achieve commercial sterility of canned tuna. Venting and retorting of any low-acid canned product are regulated by 21CFR§113 [27]. Since precooking requires a similar exchange of air to steam, we can assume that up to 50% of the steam usage is required to vent the precooker.
At sea-level and at atmospheric pressure, steam condenses at 100°C. During venting of the air out of an APC, the chamber is not pressurized, and saturated steam fills the precooker and pushes the air out through the exit vent. During venting to remove the air, the 100°C saturated steam also condenses on the lower temperature fish in the precooker. This venting phase, which may take 10s of minutes to completely remove the air, is also the initial part of the fish heating (cooking) phase. As steam is forced past the fish at high-speed to remove the air, the steam is also condensing on the fish surfaces and begins the cooking of the fish.
For a VPC, the air removal is completed by first drawing a vacuum in the precooker. Only then is steam introduced into the chamber. The pressure increases until it reaches the set point operating pressure for the steam which controls the temperature in the VPC. The vacuum removal of the air during venting prior to the cooking cycle prevents the heating of the fish that occurs with an APC by excess steam sweeping past the fish.
Heating
The heating (precooking) phase used the same procedure in each of the cooker types. Saturated steam at 100°C is piped into the precooker using control valves. The saturated steam condenses on the fish surfaces which have lower temperatures, and the condensed water falls to the floor of the precooker. The steam control valve is controlled by temperature, and, as the ambient temperature inside the precooker drops slightly, the control valve is opened to allow more steam to enter the chamber. No water spray was used to cool the chamber walls or the fish during precooking. Precooking was stopped when the minimum backbone temperature reached the HACCP Critical Limit temperature of 60°C [1]. This temperature was measured by backbone probes.
Cooling
The cooling phase after precooking was completed followed the same procedure for all the precookers. This cooling process is conducted using a streamlined version of the standard sidespray, within the cooking chamber, with both doors open, timed water sprays onto the fish, and a large fan blowing ambient air across the fish to provide an evaporative cooling effect. The precooked fish were cooled to reach the desired backbone temperature of about 40°C before the fish were transferred to the chill room.
Impact of surface coefficient of heat transfer
The convective heat transfer coefficient or surface coefficient of heat transfer, hc − is greatly affected by the heating medium (steam, in the tuna precooker) and by movement of the medium, i.e., not moving, moving by gravity, or moving by forced convection. According to Kreith and Bohn [28], “the numerical value of hc − in a system depends on the geometry of the surface, the velocity as well as the physical properties of the fluid, and the delta T.” For condensing steam, hc − can vary from 6,000 to 120,000 W/ m2 k, where W = watts, m2 = square meter, and k = degrees Kelvin. Singh and Heldman [29] reported values of 5,000 to 100,000 W/m2 k for condensing water vapor. Zhang et al. [30] reported values of 1,400 to 2,000 W/m2 k in a numerical simulation of tuna heating with steam using reduced steam pressure in a laboratory setting. The rate of heating during the venting in an APC is high because of the speed of the high-pressure steam moving past the fish as the air is being driven out of the precooker.
Heat must penetrate into the fish flesh to cook the fish. The BIOT number is an index of the ratio of the heat transfer resistance at the surface versus the interior of an item (the tuna) [28]. Bell et al. [2] reported a BIOT number of greater than 40 for steam cooking of tuna. Bell et al. [2] concluded that this cooking process produced negligible surface resistance to heat transfer, and surface temperatures on the tuna were similar to the ambient steam temperatures. The rate at which the heat can penetrate the tuna flesh is determined by the thermal conductivity of the raw or cooked fish flesh [2,3].
During venting and heating process in an APC, with saturated steam condensing at 100°C on the surface of the fish, the surface coefficient of heat transfer, hc − is large. As the fish is heated, water and oils are driven out [2]. Condensing steam, because of the phase change, has some of the highest surface coefficients of heat transfer possible at the temperatures at which heating or precooking normally operates [31]. In a VPC, the steam is introduced under vacuum into the VPC and, thus, at lower-thannormal atmospheric pressure. This difference suggests that the fish may be heated more quickly with an APC than a VPC. In a VPC, operating at this lower pressure, the steam condenses at a lower temperature, and the fish starts to heat more slowly. These conditions provide gentler venting and cooking phases causing less moisture loss, meaning increased recovery [4].
The heating rate (thermal conductivity) into the center of the fish is the same for the APC and VPC at the temperatures being tested [3]. The rate of heating is the same, but the amount of heat available on the outside of the fish will be different depending on whether it is the vent cycle of the APC or a VPC. The fish being heated in the APC is subjected to higher heat for longer time than in the VPC due to the longer venting phase of the APC. This difference results in the outer sections of the fish being heated longer for the APC to heat the inner (core) to the target temperature. The outer layers of the tuna are subjected higher heat longer in the APC than the VPCs.
METHODS AND MATERIALS
Tuna Factory and Species
The species of fish precooked and weighed were skipjack (Katsuwonus pelamis) (SJ) and yellowfin (Thunnus albacares) (YF). The weights of the tuna were collected before and after precooking during business operations at a tuna cannery over a 3-month period (Jan-Mar 2020). The cannery is a multi-faceted operation, manufacturing and selling shelf-stable tuna in cans and pouches and also selling sealed bags of frozen tuna loin meat to both domestic and foreign canneries.
Precookers Tested
Multiple precookers were tested, five individual VPCs and one APC. The VPCs were numbered 1 through 5, and the APC was number 6. These precookers are cylindrical chambers, with round doors at each end. The venting, heating, and cooling phases of the precookers were controlled by proprietary software. The VPCs and the APC have the same length and diameter and hold up to 14 precooker racks, each rack holding 21 baskets. The precooker racks are interchangeable. Each precooker holds 4 to 5 mt of tuna per cook cycle, depending on the fish size.
Sample Preparation and Collection
The steam was introduced at the same temperature (100°C) for each heating phase, and the cooling phases or treatments were equivalent. The spatial temperature distribution was verified as uniform within 1°C in the precookers so the heating end-to-end was uniform. The venting phase was the main difference between the APC and the VPCs as mentioned previously.
Every rack of fish was weighed on floor scales before and after precooking. This record of weights and their differences is routinely used to verify that all the fish were cooked and determine whether they were overcooked (too much weight loss).
Statistical Treatments
The original data set had over 22,000 observations with many combinations. Each observation consists of a single rack of fish used in a single precooking cycle. Each observation contained the vessel name, the precooker number, the rack number, the species, size, and pre-and-post precooking rack weights. This data was collected in an industrial setting and certainly includes some errors in recording the data. The data was first sorted and analyzed to determine obvious outliers. These outliers were eliminated by removing those that varied by more than 3.29 standard deviations from the grand mean of each species group thus covering 99.9% of the z-distribution of values [32,33]. Some of the observations from the very largest fish sizes for each species were also removed from the data set for lack of sufficient observations in an ANOVA cell (see below).
Preparation of Data for Analysis by ANOVA
Not every cell for the planned ANOVA analysis had data in the original data set. Each cell consisted of the Cooker Type, Machine, Species, and Size. For these occurrences, the data set was modified by combining two adjoining fish sizes, so 1 lb and 2 lb became a single size category of < 2 lb, and 2 lb and 3 lb were combined to became 2-3 lb, and so forth. The ANOVA analysis by Species was separated into two data sets because the largest SJ precooked was only 20 lbs., while the largest YF was 120 lbs. In the cannery, the largest YF were split in half with a split saw to reduce the fish size for racking and precooking purposes. These fish and cooking losses could not be compared whole fish of the same weight. Splitting the very large YF created a large, exposed surface and different cook losses compared to whole fish that is covered with protective skin. A third data set had the larger YF removed and combined similar sized SJ and YF and, so, the number of fish size categories were equal. This allowed the ANOVA analysis to show data in every cell of the ANOVA matrix for each analysis. Thus, three data sets were tested by ANOVA: SJ, YF, and a combined dataset of SJ and YF of equivalent sized fish from each species.
STATISTICAL METHODS
Nested ANOVA
The analysis of precooking weight losses involves comparing the weight losses between precooking cycles from multiple precookers and precooker types. An analysis of variance (ANOVA) compares the means (averages) of multiple groups to determine potential significant differences between the groups and is an extension of a t-test comparison of two means [35, 36]. The ANOVAs in this paper were analyzed as nested according to the hierarchical nature of the design regarding Cooker Type, Machine, and Rack. Machine (1-6) means a specific precooker with an individual number. The Rack (1-14) holds the fish in baskets in the precooker. Machine is nested within Cooker Type, and Rack is nested within Machine. In a nested ANOVA, there are several different error terms reflecting each level of the hierarchy. Because Machine is nested within Cooker Type, when testing for differences between VPC and APC, the error term is based on the variation between the Machines. Likewise, when testing for differences between Machines, the error term is based on the variation between Racks [36-38].
The ANOVA test was first performed for species of SJ and YF separated into two data sets thus isolating Cooker Types and Fish Sizes by Species. The precookers (cookers) were grouped together by type for the data analysis. A nested ANOVA was performed comparing Cooker Types of VPC to APC for each Fish Size using Minitab statistical software [34]. Cooker Type is the main factor in the nested ANOVA. Nested within the Cooker Type is a second factor: Machine (precooker number). Minitab’s nested ANOVA fits a mixed effects model treating the main factor, Cooker Type, as a fixed factor and the nested factor, Machine, as a random factor. If there are equal sample sizes for each Machine, the p-value from the nested ANOVA test is identical to a simple unpaired t-test where only the mean of each Machine is presented to the analysis.
The results of the ANOVA are reported as an F-statistic for each variable. The significance of the F-statistic is evaluated and reported as a p-value, the significance of which depends on the magnitude of the difference between the means, the sample size, and the error or noise in the data. If the p-value is greater than 0.01, the differences between the means under evaluation are not considered significant at the 0.01 alpha level, and the difference observed between the means can be attributed to random variation. If the p-value is less than 0.01, the difference between the observations is considered to be significant. The significance of the ANOVA tests depends on sample size (number of observations). An ANOVA analysis on a large dataset with many observations, can produce a p-value that is extremely small so that even a small effect with no practical importance can be found to be statistically significant [39].
Effect size statistics
To evaluate for practical significance, there is another statistic called the Effect Size (ES). One measure of effect size is Cohen’s d [40-43]. The Cohen’s d effect size is calculated as the difference of the two means divided by the “pooled” standard deviation [40, 42]. Cohen assigned descriptors for the values for Cohen’s d which are: d of 0 = no effect (NA), d of 0.2 = small effect (Sm), d of 0.5 = medium effect (Md), d of 0.8 = large effect (Lg), and d of 1.3 = very large effect (XL) [44]. Sawilowsky [45] modified and added to the d values and called them “Rule of Thumb,” with, d of 1.2 = very large effect (XL) and d of 2.0 = huge effect. These values are not strict cutoffs but more as guidelines for discussion or evaluation of the real effect and impact of the analysis results [41].
Test Hypothesis
As stated previously, the primary purpose of this study is the evaluation of the difference in precooking weight losses between types of precookers. Additionally, there is a large variability in how the fish is purchased, sorted, and processed by size and species, and these relationships and impacts can be tested as well. The amount of data collected, and number of independent variables allows us to test the following hypothesis with some caveats for sample size:
Are there differences in precooking weight losses by Cooker Type, by Fish Size, and by Fish Species?
i. The null hypothesis: All means are equal for each variable. There is no difference in precooker losses by Cooker Type, Machine, and/or Fish Size.
a. The alternative hypothesis: Not all means are equal for each variable.
b. Equal variances and normality were assumed for the analysis.
c. The p-values will be reported but will be analyzed with caution because of the large data set and variation in the number of observations per cell [42, 46]. The p-value threshold will be 0.01. The practical significance between groups will be reported and analyzed using the effect size measurement of modified Cohen’s d [41,45].
RESULTS
Observations
There were 18 species and fish size combinations tested. The SJ dataset had 17,607 usable observations and 7 sizes, the YF dataset had 4,384 usable observations and 11 sizes, and the combined dataset had 19,975 usable observations and 7 sizes.
ANOVA analysis
The ANOVA results (Table 1) of the precooking weight losses for all sizes of SJ indicate that there is a significant difference between types of precookers and also fish sizes. The top 2 lines of data show that the null hypothesis of “no difference between the means” for both Cooker Type and Fish Size can be rejected because the p-values (0.00000) are very significant. The difference between individual precookers (Machines, nested within Cooker Type) is not significant when tested at the level of p < 0.01. The p-value for the difference between Racks is also significant but controlling for individual racks in different precookers is not practical in modern tuna canneries; thus, this is not a useful statistic.
The ANOVA results for precooking weight losses for YF (Table 2) by Cooker Type are similar to those for SJ. The null hypothesis of “no difference between the means” for precooker losses by Cooker Type and Fish Size category can be rejected because the p-values are highly significant. The difference between precookers (Machines nested within Cooker Type) is not significant when tested at the level of p < 0.01. Again, Rack is very significant, but controlling for individual racks in different precookers is not practical for any species.
The ANOVA results for the combined SJ and YF data set for the same sizes are shown in Table 3. The null hypothesis of “no difference between means” of precooker weight losses can be again rejected because significant differences between Cooker Type and Fish Size are reflected in the highly significant p-values, 0.00000. There is no difference between the individual precookers (Machines nested under Cooker Type). The difference in precooker weight losses between Species of the same Fish Size is also significant at p ~ 0.003. However, the calculation of Cohen’s d was 0.16 (Sm) (not shown), indicating little to no practical impact of precooking losses for different species of fish of the same size.
Figure 1 shows the precooker weight losses for SJ and YF by Cooker Type by Fish Size category. The ANOVA tables show that there is a significant difference between the means for this category, but these calculations do not indicate the size of an effect. Cohen’s d effect sizes [41] and Sawilowsky’s [45] Rules of Thumb are shown in Table 4 to indicate the effect of these differences in precooker weight losses by Cooker Type by Fish Size category. Most of these effect sizes have d values interpreted as large, very-large, or huge.
The precooking weight losses of SJ and YF by Fish Size by cooker Machine are shown in Figure 2. In every case, there were fewer cooker losses by fish size in the five VPCs (numbered 1 through 5) than in the APC, the precooker number 6.
The precooking weight losses by size for SJ and YF are shown in Figure 3. These results indicate that the larger fish generally have lower precooker losses than the smaller fish, which is an acceptable industry outcome [16]. However, the weight losses of two of the larger sizes of yellowfin do not show this pattern.
Table 1: Precooking weight losses - Nested ANOVA results – Skipjack only.
| Source | DF | Adj SS | Adj MS | F-Value | P-Value | |
| Cooker Type | 1 | 1510.7 | 1510.69 | 166.78 | 0.00014 | x |
| Size Category | 6 | 3496.8 | 582.80 | 40.96 | 0.00000 | x |
| Machine (Cooker type) | 4 | 42.8 | 10.70 | 1.26 | 0.29068 | x |
| Cooker type * Size Category | 6 | 206.0 | 34.33 | 2.41 | 0.05749 | x |
| Rack (Cooker type, Machine) | 228 | 4969.4 | 21.80 | 11.74 | 0.00000 | |
| Machine (Cooker Type) | 24 | 339.7 | 14.16 | 7.63 | 0.00000 | |
| Error | 17337 | 32185.7 | 1.86 | |||
| Total | 17606 | 52828.4 | ||||
| x - Not an exact F-test |
Table 2: Precooking weight losses - Nested ANOVA results – Yellowfin only.
| Source | DF | Adj SS | Adj MS | F-Value | P-Value | |
| Cooker Type | 1 | 378.9 | 378.92 | 129.93 | 0.00000 | x |
| Size Category | 10 | 1628.2 | 162.82 | 7.39 | 0.00000 | x |
| Machine (Cooker type) | 4 | 14.6 | 3.65 | 0.17 | 0.95439 | x |
| Cooker type * Size Category | 10 | 200 | 20 | 0.91 | 0.53494 | x |
| Rack (Cooker type, Machine) | 176 | 6392.4 | 36.32 | 14.27 | 0.00000 | |
| Machine (Cooker Type) | 40 | 1098.1 | 27.45 | 10.78 | 0.00000 | |
| Error | 4142 | 10544.8 | 2.55 | |||
| Total | 4383 | 24404.2 | ||||
| x - Not an exact F-test |
DISCUSSION AND CONCLUSION
In summary, the nested ANOVA rejects the null hypothesis of equal precooking weight losses for Cooker Type, Size, and Species as indicated by the p-values below 0.01. The effect size measurement (Cohen’s d) also indicates a large difference between the VPCs and the APC. This study involved a large set of data collected in an industrial setting. The precooker weight losses are shown to be significantly different between the VPC and APC types of precooker by fish size. In the co-authors’ experience, interpreting precooker data is complex and can be difficult. There is a wide variation between data pairs, but the uncertainty introduced by this variability has been reduced because of the large amount of usable data created and thus some conclusions can be made from the data. The different precooker losses between fish sizes also helps in setting internal recovery standards for processing operations.
Each precooking cycle has three phases: venting, cooking, and cooling. The primary difference between the operation and usage in this factory between these two types of precooker is in the venting. The APCs use full steam venting, using large amounts of steam, with the accompanying heat, to remove the air. The VPCs remove the air by drawing a vacuum before adding the steam in a controlled manner. This difference in venting and the accompanying heating of the tuna is causing the weight loss difference observed.
These results may help improve cooking efficiencies for canneries using VPCs to improve cook recoveries. Since the reality of the canned tuna business model relies on the need to process whatever species and size mix of the tuna delivered to the cannery, changing equipment such as precookers (from APCs to VPCs) or controllers may be the only options to improve precooking efficiencies [4].
A key question for tuna cannery efficiencies and production is: does the retention and increased cook recovery (reduced cook loss) in a VPC translate into improved recovery of edible meat throughout the canning process? Once the tuna canning process is complete, are more cans produced from the same amount of whole tuna purchased and processed? Although the data for these process steps is proprietary, the authors can confirm that the increased recovery is maintained throughout the rest of the process.
Table 3: Precooking weight losses - Nested ANOVA results – Yellowfin and Skipjack combined.
| Source | DF | Adj SS | Adj MS | F-Value | P-Value | |
| Cooker Type | 1 | 2403.5 | 2403.54 | 505.07 | 0.00001 | x |
| Machine (Cooker type) | 4 | 22.7 | 5.67 | 0.25 | 0.90527 | x |
| Rack (Cooker type, Machine) | 237 | 5700.2 | 24.05 | 11.7 | 0.00000 | |
| Species 1 446.9 446.89 31.22 0.00341 | 1 | 446.9 | 446.89 | 31.22 | 0.00341 | x |
| Cooker type * Species | 1 | 142.7 | 142.75 | 6.64 | 0.06033 | x |
| Machine (Cooker type) * Species | 4 | 94.8 | 23.69 | 11.53 | 0.00000 | |
| Size Category | 6 | 1917.9 | 319.65 | 34.97 | 0.00000 | x |
| Cooker type * Size Category | 6 | 222.9 | 37.15 | 2.32 | 0.06595 | x |
| Machine (Cooker Type) | 24 | 385.7 | 16.07 | 7.82 | 0.00000 | |
| Species * Size Category | 6 | 270.2 | 45.03 | 21.91 | 0.00000 | |
| Error | 19684 | 40461.8 | 2.06 | |||
| Total | 19974 | 65635.9 | ||||
| x - Not an exact F-test |
Table 4: Cohen’s d and Sawilowsky’s rule of thumb (R of T).
| Precookers | Size (lb) | Cohen's d SJ | R of T | Cohen's d YF | R of T |
| VPC - APC | <2 | 2.3 | Huge | 2.3 | Huge |
| 02-Mar | 1.6 | Very Lg | 1.4 | Very Lg | |
| 03-Apr | 1.3 | Very Lg | 1.7 | Very Lg | |
| 4-7.5 | 1.2 | Very Lg | 1 | Large | |
| 7.5-9 | 1.3 | Very Lg | 1.1 | Large | |
| Sep-16 | 1.3 | Very Lg | 1.5 | Very Lg | |
| 16-20 | 0.6 | Medium | 1.4 | Very Lg |
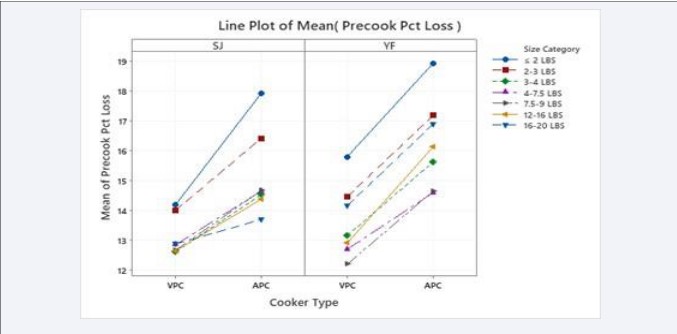
Figure 1: Precooker losses by Cooker Type, Species and Size Category
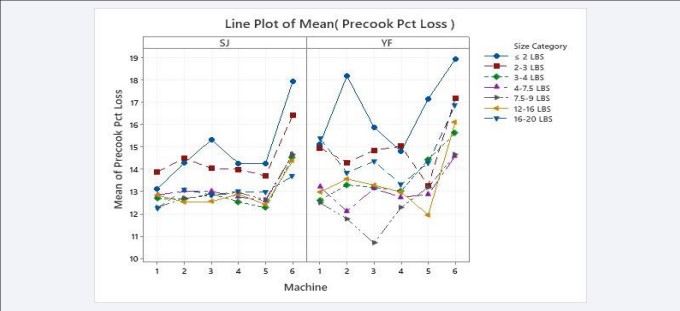
Figure 2: Precooker losses by Species and Size Category, and Machine (Machines 1 – 5 are VPCs and Machine 6 is the APC).
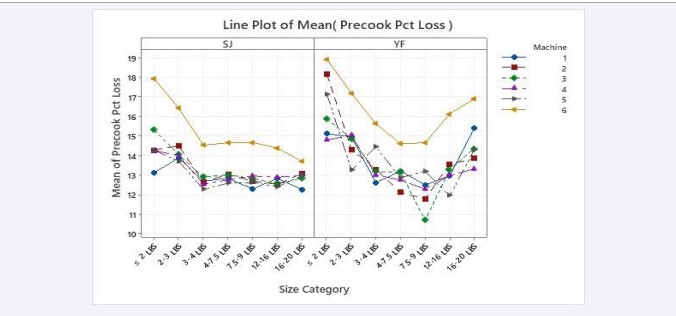
Figure 3: Precooker losses by Species by Size Category
EPILOGUE
The cannery has continued to collect this data on a routine basis for every precooker load of tuna for the remainder of 2020 and 2021. Analysis of the data concludes that the results are the same: there is a notable difference in precooking weight losses by species and size between the APC and the VPCs. The final result of this study is that the factory management replaced the existing APC with another VPC.
Credit Authorship Contribution Statement
Christopher W. Lord: Experimental design and write up.
John DeBeer: Experimental design and write up.
James Colton: Experimental and statistical design, and modeling, data analysis and write up.
Brais Darriba Espiñeira: Original observations and hypothesis, conceptualization, data collection and verification.
ACKNOWLEDGMENTS
The authors thank Dr. D. Mona Baumgartel and Dr. Jon W. Bell for editorial help. The authors thank Luis Garcia Fernando for collecting all the data. The authors thank the reviewers for their suggestions to improve the manuscript.
Declaration of Interest Statement
The authors declare that they have no known competing financial interests or personal relationships that could have appeared to influence the work reported in this paper. Any mention of any commercial brands of equipment is incidental. No endorsements are given or implied. The authors received no external funds for this work.
REFERENCES
6. Peterson EW. Multipurpose precooker method. United States patent US 3,594,196: 20 July 1971.
7. Peterson EW. Multipurpose precooker. United States patent US 3,709,142: 9 January 1973.
9. U.S. Food and Drug Administration. Fish and fishery products hazards and controls guidance; 2020.
12. Hungerford JM. Scombroid poisoning: a review. Toxicon. 2010; 56: 231-243.
16. DeBeer J. personal communication [jdebeer2005@gmail.com]
22. Engineering Toolbox. 2019.
25. Bichier J. Email dated Oct 15, 2020. [Email: Jacques.Bichier@JBTC. COM]
26. U.S. Food and Drug Administration. Steam distribution for retort venting in food canneries. 2014.
28. Kreith F, Bohn MS. Principles of Heat Transfer. 2001.
29. Singh RP, Helman DR. Introduction to Food Engineering, 2009. Fourth ed, Academic Press.
31. Kurganov VA. Heat transfer coefficient. 2011.
32. Anonymous. Odd One Out: Understanding Outliers. 2020.
33. Tabachnick BG, Fidell LS. Using Multivariate Statistics, 2013. 6th ed. Boston: Allyn and Bacon.
34. Minitab. State College, PA 16801-3210.
36. Snedecor GW, Cochran WG. Statistical methods, 1967. 6th edition. The Iowa State University.
41. Cohen J. A power primer. Psychol Bull. 1992; 112: 155-159.
44. Ellis PD. Thresholds for interpreting effect sizes. 2009.
45. Sawilowsky SS. New effect size rules of thumb. J Mod Appl Stat Method 2009; 8: 26.
46. Bakan D. The test of significance in psychological research. Psychol Bull. 1966; 66: 423.


