Do We Over - Or Underestimate the Overall Cost Burden of Infectious Diseases in Aging Adults?
- 1. Department of Care & Ethics, Faculty of Medicine & Life Sciences, University of Hasselt, Diepenbeek, Belgium
- 2. HEBO bv, Antwerpen, Belgium
- 3. Department of Geriatrics and Department of Primary and Interdisciplinary Care (ELIZA), University of Antwerp, Hospital Network Antwerp (ZNA), Antwerpen, Belgium
Abstract
Background: Arithmetic average values about disease burden across aging adults are often used in the absence of having reliable access to real life data. Those values however assume group homogeneity in characteristics such as age, sex, disease incidence rates, or costs. The question arises about how much the overall outcome results, like total disease management costs, obtained under those homogeneity assumptions may deviate from real-world population data that may manifest non-homogeneous distributions. Without being able to have easily access to those real-world data and for getting a good approximation of the deviations in outcome results, a calculation method is proposed that should also indicate which factor may have a dominant influence on the cost difference between homogeneous and non-homogeneous results. The method should help focus the research for obtaining more accurate information from real-world data in subsequent steps that better estimate control gain of infectious diseases through new interventions.
Methods: The method explores, as the outcome measure to assess, the relative deviation in overall infection management costs measured with homogeneity versus non-homogeneity design in the datasets of aging adults. Population modelling is used with an Extended Sensitivity Analysis Plan (ESAP) that simulates non-homogeneous, but realistic, approximates of age-specific distributional spread in demography, infectious disease, and its severity in people aged > 65 years old over a 1-year period in univariant and multivariant assessments. Disease management costs are adjusted for 3 infection severity levels with increased differences between them using multiplication factors up to 20 times the initial unit cost.
Results: The assumed full homogenous dataset systematically overestimates up to 10% the overall disease management cost in aging adults when compared with a group simulated with non-homogeneous, but realistic distributions for age, infection, severity, and cost, mainly due to the difference in the demographic age composition. However, overall costs of a proposed homogeneous condition tend to underestimate the spending of non-homogeneous conditions when the reference case has a partially homogeneous setup instead of a full condition or when the demographic age-change in the non-homogeneous condition evolves towards age-demographic homogeneity (same number of people at each age with increasing age), a likely evolution in the coming 15 to 30 years.
Conclusion: Assessing the current cost burden of infectious diseases in aging adults must consider exact age-composition of the demography, the type of infection spread with severity levels in function of age and their cost differences between severity levels to avoid unrealistic cost estimates when assuming unreal homogeneous group conditions that could currently overestimate the real costs.
Keywords
• (Non)-Homogeneity
• Aging Adults
• Infection
• Costs
• Extended Sensitivity Analysis Plan
CITATION
Standaert B, De Cock AM (2024) Do We Over - Or Underestimate the Overall Cost Burden of Infectious Diseases in Aging Adults?. Ann Public Health Res 11(1): 1129.
BACKGROUND
When assessing disease burden in children or young adults, the structural and distributional composition of the group is often considered to be homogeneous for age, sex, and health conditions related to the presence of co-morbidities [1]. This assumption of homogeneity facilitates the evaluation of summary estimates for the group. Calculating arithmetic average values is sufficient for obtaining credible overall results. However, homogeneity is not always present in all population groups studied [2,3]. Ageing adult people above 65 years (y) old for instance, are not homogeneous in many ways, differing in composition by their distributions in age, sex, health condition, and place of living [4].
Moreover, these characteristics evolve over time as dynamic population features, such as living a longer life, which may lead to smaller differences in sex numbers and more healthy years overall [5]. Meanwhile, non-homogeneity in the distribution of variables could have consequences in economic analyses when expressing summary outcome measures, such as the overall management cost of the disease burden, with arithmetic average values, assuming therefore homogeneity in the data spread [6,7]. It may wrongly estimate cost gains when new interventions are introduced to control specific disease types. When reviewing the literature on assessing the burden of infectious disease in aging adults, concerns about non-homogeneity in the data are often raised, but no clear answers are given on how to adequately address that issue [8]. It leaves researchers with questions about the size of the problem caused by non-homogeneity and how to adjust following which approach [9]. For instance, data on the infection spread of aging adults in hospital care illustrate that the stay and duration are strongly non-homogeneously distributed by age, sex, co-morbidities, and ward selection [10]. Consequently, the overall real management cost of infectious diseases could be heavily skewed.
Due to the multiplication of treatment decision processes followed and the specific disease evolution patterns seen, such as more nosocomial infections in certain subgroups, it leads to longer hospital stays that could heavily impact the assumption of cost homogeneity in hospital care. However, the issue remains that today it is very difficult to get real-live population data of the ageing adults because the information is not regularly and systematically measured nor are the data appropriately collected and reported. Under such circumstances, it is difficult to claim the importance of suspected deviation in cost results between homogeneity and non-homogeneity for that age-group. The search for getting more appropriate estimates becomes therefore a critical undertaking that could help explore the elucidation of the problem. Consequently, an appropriate evaluation method of data analysis from aging adults, is proposed that better investigates the duality of homogeneous versus non-homogenous datasets. It helps to determine how large the difference in summary outcome measures could be. The approach should improve our understanding and knowledge about indicating the variable distributions in the target population that result in most marked differences when compared with the assumption of homogeneity. It may also inform the approach to be taken in the research performed by the European consortium group that evaluates the whole burden of infectious disease in ageing adults, presented as an Innovative Medicines Initiatives (IMI)-project called VITAL (Vaccines and Infectious Diseases in the Ageing Population) [11].
METHODS & AIM
The objective is to demonstrate that, in the absence of having easy access to good real-life data, it is possible to explore the amount of outcome difference in the infectious disease cost burden, influenced by variables that have known non- homogeneous spreads, when compared to the assumption of homogeneity in the same group, using an Extended Sensitivity Analysis Plan (ESAP).
Baseline Reference Model
The analysis uses a simple, hypothetical population structured model to start with, evaluated over one year, called the homogeneous X1 model. It estimates the overall disease management cost for the group exposed to infectious diseases with standard treatment. The data input for this basic homogeneous model is reported in (Table 1), presented as a fully homogeneous condition (X1a) or a partially homogeneous condition (X1b).
Table 1: Data input to populate the basic homogeneous model of X (fully homogeneous and X (partially homogeneous).
|
Variable |
Values for X1a |
Values for X1b |
|
Population number (N) |
1000 |
|
|
Age-range |
65-100 years |
|
|
Age-groups (An) |
10 equal age-groups of 3.5 years each |
|
|
Rate of infection in each age-group (In) |
15% |
|
|
Levels of disease severity (Is) |
low, medium, high (33.33% for each) |
60% low, 30% medium, 10% high |
|
Cost of treatment (CT) |
Average cost for any severity level of 20€ |
Average cost for any severity level of 15€ |
|
33.33%*10€+33.33%*20€ +33.33%*30€ |
60%*10€+30%*20€+10%*30€ |
|
|
Time assessment |
1 year |
|
In X1a, the categories for 3 different disease severity levels by age have the same proportion of 33.33%. In X1b, those categories have an adjusted proportional distribution of 60% for low, 30% for medium, and 10% for high severity. The analysis, using these data, gives the overall cost estimate, equivalent to using arithmetic averages for the population under study. The outcome result is the baseline reference value for the comparison and the calculation of the cost difference with simulated non-homogeneous model conditions. Details of the data calculation of X1a are presented in (Appendix 1).
Extended Sensitivity Analysis Plan (ESAP)
The basic population model (X1) is now progressively adjusted, adding discrete variable spread changes into a new model, called X2, using the technique of sensitivity analysis. By having those changes in the X1 model, X2 is by nature heterogeneous in its composition. Deviations from the overall cost outcome of the homogeneous condition, related to these changes, are quantified, and compared.
The whole sensitivity analysis is developed within a framework of an ESAP (Table 2).
Table 2: Extended sensitivity analysis plan (ESAP) to assess the outcome of overall cost in homogeneous conditions X 1a and X 1b and in non-homogeneous conditions X and X . 2a 2b
|
Type |
Steps |
Model |
Homogeneous/ Non homogenous |
Domain |
Figure# |
|||||||||
|
Demography |
Infection |
|||||||||||||
|
|
|
|
|
Age- distribution |
ccDisease rate distribution |
Severity level |
Cost |
|||||||
|
Multistep Variation |
Step 1 |
X1a |
Full-homogeneous |
Equivalent across age- groups |
Equivalent across age-groups |
Equivalent across age- groups |
Equivalent across age- groups |
Figure 2 |
||||||
|
X2a |
Non-Homogeneous |
Realistic Belgian age- distribution |
Equivalent across age-groups |
Equivalent across age- groups |
Equivalent across age- groups |
|||||||||
|
Step 2 |
X1a |
Full-homogeneous |
Equivalent across age- groups |
Equivalent across age-groups |
Equivalent across age- groups |
Equivalent across age- groups |
Figure 3 |
|||||||
|
X2a |
Non-Homogeneous |
Realistic Belgian age- distribution |
Exponential |
Equivalent across age- groups |
Equivalent across age- groups |
|||||||||
|
Step 3 |
X1a |
Full-homogeneous |
Equivalent across age- groups |
Equivalent across age-groups |
Equivalent across age- groups |
Equivalent across age- groups |
Figure 4 |
|||||||
|
X2a |
Non-Homogeneous |
Realistic Belgian age- distribution |
Exponential |
Low |
Medium |
High |
Equivalent across age- groups |
|||||||
|
Step 4 |
X1a |
Full-homogeneous |
Equivalent across age- groups |
Equivalent across age-groups |
Equivalent across age- groups |
Equivalent across age- groups |
Figure 5 |
|||||||
|
X2a |
Non-Homogeneous |
Realistic Belgian age- distribution |
Exponential |
Adj Low |
Adj Medium |
Adj |
Low |
Medium |
High |
|||||
|
High |
||||||||||||||
|
Step 5 |
X1b |
Partial Homogeneous |
Equivalent across age- groups |
Equivalent across age-groups |
Low (60%) |
Medium (30%) |
High (10%) |
Equivalent across age- groups |
Figure 6 |
|||||
|
X2a |
Non-Homogeneous |
Realistic Belgian age- distribution |
Exponential |
Low |
Medium |
High |
Low |
Medium |
High |
|||||
|
Step 6 |
X1a |
Full Homogeneous |
Equivalent across age- groups |
Equivalent across age-groups |
Equivalent across age- groups |
Equivalent across age- groups |
Figure 7 |
|||||||
|
X2a |
Non-Homogeneous |
Equivalent across age- groups |
Linear |
Exponential |
Extreme |
Low |
Medium |
High |
Low |
Medium |
High |
|||
|
Combination multivariate |
3-way sensitivity analysis 1 |
X1a |
Full Homogeneous |
Equivalent across age- groups |
Equivalent across age-groups |
Equivalent across age- groups |
Equivalent across age- groups |
Figures 8,9 |
||||||
|
X2a |
Non-Homogeneous |
Realistic Belgian age- distribution |
Exponential (Move) |
Low to high (Grade) |
Low |
Medium |
High |
|||||||
|
3-way sensitivity analysis 2 |
X1a |
Full Homogeneous |
Equivalent across age- groups |
Equivalent across age-groups |
Equivalent across age- groups |
Equivalent across age- groups |
Figures 10,11 |
|||||||
|
X2a |
Non-Homogeneous |
Realistic Belgian age- distribution |
Exponential (Move) |
Low to high (Grade) |
Low to high (MF) |
|||||||||
|
3-way sensitivity analysis 3 |
X1a |
Full Homogeneous |
Equivalent across age- groups |
Equivalent across age-groups |
Equivalent across age- groups |
Equivalent across age- groups |
Figures 12,13 |
|||||||
|
X2b |
Non-Homogeneous |
Proportional demographic increase |
Exponential (Move) |
Low to high (Grade) |
Low to high (MF) |
|||||||||
The plan encloses a list of basic, known explanatory variables for the outcome measure of overall cost about demography and infection tested with different levels of uncertainties. This is happening in a multistep approach with links present between the different steps. Subsequent analyses combine some of the variable changes together (two- and three-way sensitivity analysis). The following assumptions are introduced in model X2 [12]:
- The total number of individuals in the population and the total number of disease episodes assessed are the same as in model X1 except in the demographic change of the combination analysis of X2b;
- Disease incidence rate (In) exponentially increases with older age groups (An) based on the observed exponential increase of frailty with age and the observed correlation between frailty scores and infection rates [13-16];
- Increasing age has a higher proportion of severe disease episodes (Isn) compared with younger ages [17];
- The cost of managing a disease episode (CT) depends on its severity level: severe disease episodes have a higher cost than medium severity episodes, and medium severity cases have a higher treatment cost than low severity cases.
The values used for disease incidence rates by age group and for the severity levels by age group in model X2 are presented with the cost for each severity level (CTm) in (Appendix 2).
Multistep Analysis
In the multistep analysis, extreme frontiers in variable spread for age and infection incidence rate distribution are explored. The relevance of their values related to the outcome result of overall costs is evaluated and tested at their minimally and maximally allowed levels. The multistep analysis plan at start comprises six steps, comparing the 2 models of X1a or X1b with X2a in separate changes of baseline values (see Table 2). In Step 1, condition X2a assesses the effect of applying the current age distribution of the aging population in Belgium [18] (see Appendix 2). Step 2 has only the variation changed in the numbers in each age group (A ) and the disease incidence rate changes (I ) by age group for X2. That distributional incidence change follows the exponential increase marked by boundaries of 7% in the lowest age group up to 59% in the oldest age group. Step 3 adds in the analysis the 3 severity levels (Isn) proportionally equivalent by age, but Step 4 includes variability in the severity level by age and a change in cost (CTm) by severity level for X2a.
In Step 5 the full homogeneity condition of X1 is challenged and instead uses a partial homogeneity condition as a reference situation (see the previous paragraph). Finally, Step 6 indicates what may happen with the overall cost if the age-demographic picture in X2a is equivalent to X1a, while the infection rate distribution as a function of age may follow 3 options: linear (around the age midpoint for the group, which is 82.5 years of age (= 65 + (100-65)/2)); exponential (In = 0.0496*e0.1783*An; An = age-group); extreme (I = 6.224E-08*A 5 – 2.8E-05*A 4 + 0.005*A 3 - 0.4378*An 2 + 18.835*An - 319.58). This exercise explores the effect of a non- homogeneous distribution of disease spread (higher disease rates at higher ages) applied to a homogeneous age distribution, which represents the likely further evolution of the population structure at older ages as shown in (Figure 1) (see also age-demographic changes in the combination analysis) [19].
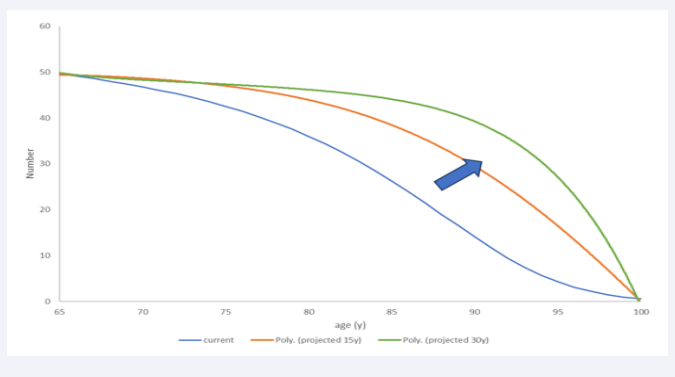
Figure 1: The likely evolution to a more age-homogeneous demographic distribution (from current blue to predicted green).
Combination Analysis
Subsequent evaluations combine different non-homogeneous variable distributions (disease incidence rate (I) with severity level (Is)) in an integrated sensitivity analysis to identify the amount of overall cost change when compared with X1a. In the 3-way sensitivity analysis 1, the changes shift to a higher disease incidence rate (I), called Move, with an increased severity level (Is), called Grade, towards the older age groups. This is the direction expected to be observed in real life with the population getting older and living longer [20-22]. Appendix 3 provides the details of that process. Cost variables (CTm) are assessed in a separate
sensitivity analysis (3-way sensitivity analysis 2) to demonstrate their specific effect on conditions X1a and X2a. Multiplication Factors (MF) are used for the disease management cost of each severity level of Medium and High separately with a different maximum MF range of 10 for Medium and 20 for High. However, it is assumed that unit costs do not individually change by disease severity level when the non-homogeneous distributions of the variables, disease incidence rates and severity levels, change by age.
The final 3-way sensitivity analysis 3 concerns the simulation of age-demographic changes. One analysis is a progressive change in the demographic age curve towards the more homogenous age structure (see Figure 1), as assumed in the full homogeneous data analysis of X1a. It is expected to observe a point in the change of the age-demographic curve where the overall costs are equivalent between the two models compared of full homogeneity with the heterogeneity construction in which all the other variables are maintained in their heterogeneous conditions of X2a. That point is interesting to know as it indicates by when it is expected that the overall costs will be underestimated when using the full homogeneous model. The other demographic analysis is the homogeneous model. The other demographic analysis is the change of moving the demographic curve to the right expressed as model X2b, thereby increasing the number of people in older age groups living longer. The overall costs of that simulation are compared with X1a and X2a when no demographic change is made.
Summary Evaluation
The overall cost results of the different sensitivity analyses performed are presented in a summary table that compares the relative value differences with the reference case (X1a and X1b). This summary table helps to indicate the data that would be most valuable to collect in a formal analysis of the group that is solely composed of aging adults.
RESULTS
Multistep Results
The next graphical presentation of Steps 1 and 2 (Figure 2) visually demonstrates how changes from the reference full homogeneous case (left side, X1a) may occur when adding in two steps,
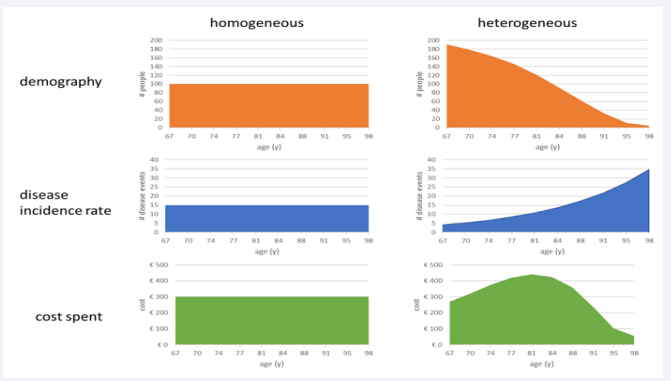
Figure 2: Presentation of the population, infection, and cost spread as a function of age for a fully homogeneous group (left side) versus a heterogeneous group (right side).
the adjustment of the population demography to match the current age distribution in Belgium, and the increased disease incidence rate of infection with age, while keeping the disease severities across the ages and the cost per severity level constant (X2a). The overall number of people (n = 1000), disease events (n= 150), and the overall cost (3,000 €) are the same left and right. The average cost for the group (3000/1000 = 3€) is also the same, left and right, because the population group and the number of events are the same in each constellation. The net difference of the sum of the overall cost between X1a and X2a is zero (0% relative change). The shift of the cost curve in the heterogeneous group (X2a) into a bell shape distribution is the consequence of the demographic population movement decreasing the numbers from high to low with increasing age, combined with the number of events increasing with increasing age from low to high. If there is no increase in the infection rate with increasing age, the shape of the cost results would be similar to the age distribution. These distribution shifts are important to note regarding the expectations about where the bulk of the disease burden is likely to be observed as a function of age in real life.
In Step 3, shifts in severity level distribution by age are added in X2a. Meanwhile, because the cost per severity level remains the same in this step, the overall cost will again be the same as in the reference fully homogeneous group. Figure 3 illustrates the process of adding disease severity levels.
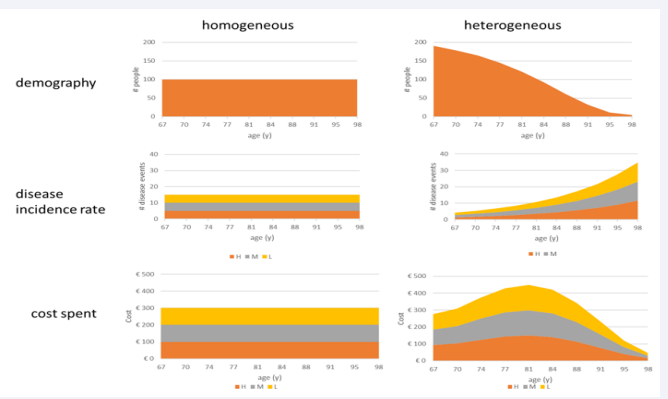
Figure 3: Presentation of the population, infection, and cost spread as a function of age for a fully homogeneous group (left side)
Calculating the overall cost difference between the homogeneous and heterogeneous conditions is obtained through the measurement of the areas between the summary curves, as shown in (Figure 4).
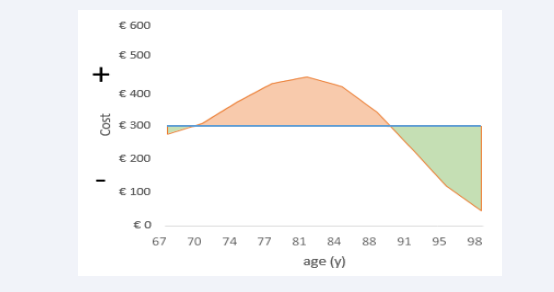
Figure 4: Calculating the areas between the curves of homogeneous versus heterogeneous cost estimates.
The line-up of the accumulated cost area of the homogeneous condition (blue line) splits the figure into a negative side (area under the blue line) and a positive side (area above the blue line). Superimposed on the line of the overall homogeneous costs is the spread of the line figure of the heterogeneous costs (orange line) that has two parts at the extremes (left and right) in the negative area (green colour) and a middle part that is designed in the positive area of the figure (orange colour). The sum of the positive and negative areas between the two curves indicates whether there is a higher (sum is positive) or lower (sum is negative) overall cost for the heterogeneous versus the homogeneous cost spread as a function of age. The result of that exercise, as shown in (Figure 4) for the difference between the two cost graphs of (Figures 2,3), has a zero-sum cost result, as mentioned earlier.
In Step 4, an adjusted specific grade distribution of the severity level by age is added with the cost differentiation by severity level. However, the mean cost calculation of an event, whether it is a low (10€), medium (20€), or high severity (30€) level, is equivalent to the mean cost used in the homogeneous condition ((10€+20€+30€)/3 = 20€). Figure 5 first reports the distribution of the severity levels by age,
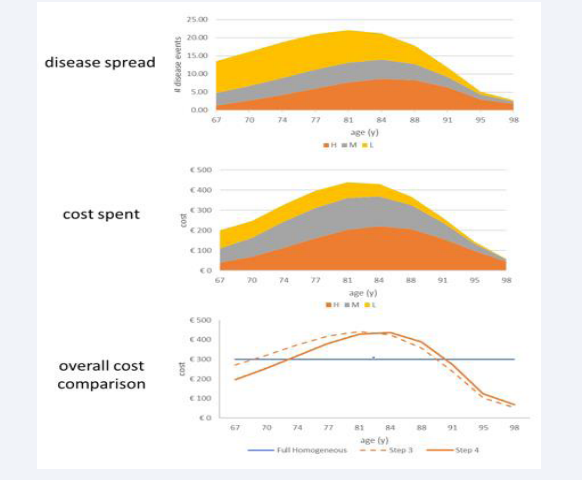
Figure 5: Illustrating first the disease severity spread of low, medium, and high by age, followed by the cost spent, and making the comparison with the homogeneous cost estimate (X1a; blue line)) and with no cost differentiation by severity level (X2a; dotted line).
followed by the cost distribution, and finally the net cost calculation as the areas between the curves. A small cost difference is measured between the X1a and X2a full lines, with a -4.2% lower cost for the non-homogeneous spread (€2,875-€3,000 = -€125; -€125/€3,000 = -4.2%). The dotted line represents the cost line of X2a in (Figure 4).
Step 5, with the introduction of the partial homogeneity distributions in X1, is presented in (Figure 6).
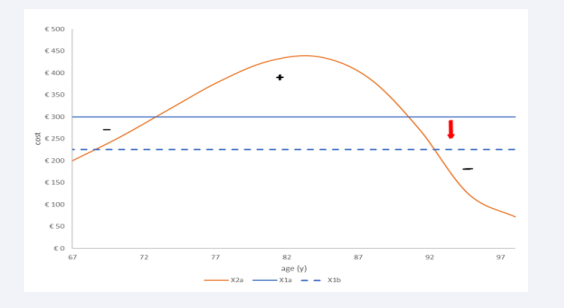
Figure 6: The distribution of overall costs by age group of condition X2a with the changes in severity level and unit cost for treatment under the full homogeneous condition (X1a) or the partial homogeneous condition (dotted line in X1b).
The blue dotted straight line shows the cost result for the partial homogeneous reference case (X1b) with a mean cost per age group that decreases from €300 (X1a) to €225 because of the change in the proportional distributions of the severity levels by age group. When the overall cost of X2a (orange line) is then compared with the overall cost of X1b, the relative cost difference suddenly jumps to an extra cost of + 27.78% (€2,875 - €2,250 = €625). The negative area between the curves is now much smaller, while the positive area has much increased. This analysis indicates the importance of selecting the homogeneous composition of the reference comparator in X1 (full or partial).
Figure 7 presents the results of Step 6, showing the overall cost distribution by age group with the homogeneous condition of the demographic age distribution retained of X1a in X2a, while all the changes in the other variables (disease, severity, cost) occur following the specific constraints of extreme and exponential disease distribution.
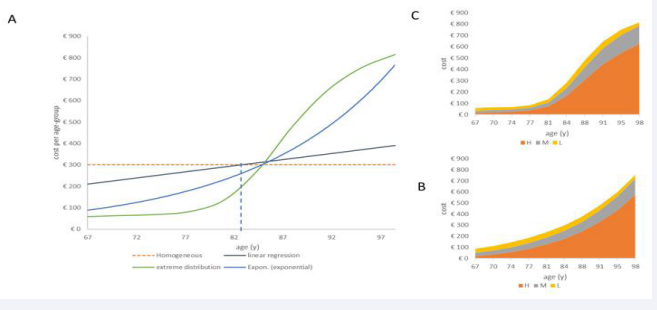
Figure 7: The distribution of overall costs by age group and age condition for a homogeneous age distribution but non-homogeneous spread in disease (A), severity, and treatment costs for exponential increase (B) and extreme condition (C).
The overall cost may increase to +11.73% for the extreme distribution because of the high number of severe cases in the oldest people (€3,352 - €3,000 = €352) (Figure 7 C). The exponential distribution ends at an overall cost increase of 9% (€3,258 - €3,000 = €258) (Figure 7B). The latter is the same type of change as observed in Step 2, but now, the number of ageing adults is equivalent to the younger age groups. The linear regression distribution has an overall cost difference of 0%, equivalent to the base-case analysis in Step 1. The latter is a forced analysis, as it is developed using the fixed population with the fixed number of infections with cost results that are in balance across the age groups around the mean age (82.5 years), which is equivalent to the median age of the group. This is not the case for the other distributions that have an unbalanced distribution of disease cases and their severity level across ages in relation to the age midpoint (Figure 7A), therefore causing a positive net cost difference.
Combination Analysis
Move and Grade: The next analysis combines changes in disease spread (Move) with changes in disease severity level (Grade), shifting more events to the more aged group in condition X2a while keeping the population number and disease events fixed as in the previous multistep analysis. The approach first looks at the results of the move shift of the disease spread using an increased exponential growth, as shown in (Figure 8) (left side, green line) (from 6% at the youngest age to 88% in the oldest age group) and presents the outcome as the overall cost spread as a function of age (€2875 for X2a versus €2934 for X2a+Move). With Move, more diseases shift towards the more aged group, causing an increase in overall cost (+€66). However, it still results in a negative net cost when compared with the full homogeneous condition ((€3000-€2934)/€3000= -2.2%). There is a concentration push of the overall cost in the in-between age group of 75 to 90 years old, as seen in (Figure 8) (right side, green line).
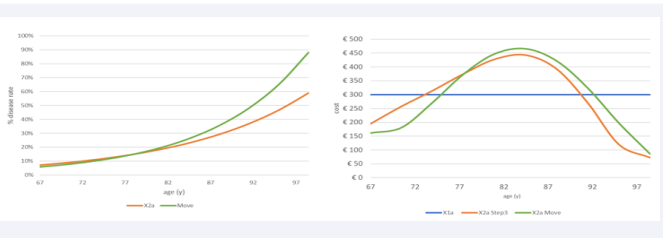
Figure 8: Showing the move overall cost results (right) by increasing the exponential growth of infection by age (left)
Figure 9 now adds to Figure 8 the Grade change that may occur in two different ways. One is an increase in the gradient of the linear function of the low severity level across the ages (gray line in the left graph of (Figure 9),
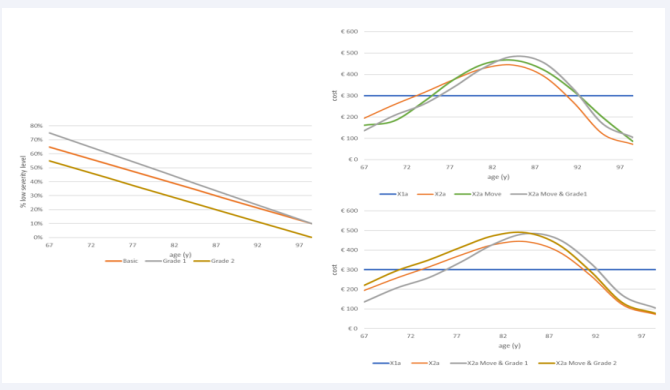
Figure 9: Impact of Grade 1 (right upper graph) and Grade 2 (right lower graph) on the overall cost results by age
called Grade 1). The other change, called Grade 2, induces a parallel decrease in the low severity level function (brown line in the left graph of (Figure 9)), while the high severity function is increased by the same amount. Again, the outcome result is presented as the overall cost spread as a function of age with a separate design for Grade 1 and Grade 2. Both are designed in addition to the Move change presented in (Figure 8).
The results of Grade 1 and Grade 2 have a different profile resulting for Grade 1 in a negative net cost sum between X2a Move & Grade 1 and the full homogeneous cost result (X1a) that is worse than if Move only was considered (€ 2,922-€ 3000 = -€78; -2.6%). Grade 2, in contrast, causes a higher overall cost than X1a, which is caused by the difference in profile between low and high severity levels (€3,167-€3000 = €167; +5.6%).
Unit Cost per Severity Level: The unit cost changes are the next evaluation (3-way sensitivity level 2). They are implemented using Multiplication Factors (MF) of the baseline cost value by the two severity levels, Medium and High (maximum 10 times for Medium and 20 times for High severity). In the reference base- case condition of X1a, a uniform cost for each disease severity level is applied, calculated as the average cost for the three severity levels. Consequently, the mean cost in the full homogeneous model of X1a is adjusted as soon as the unit cost is changed in the non-homogeneous constellation.
Figure 10 shows in the first row the cost difference obtained when the MF for medium severity cost is 1,
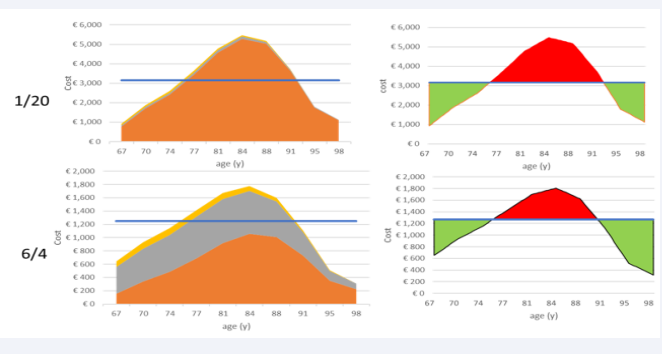
Figure 10: Changing the Multiplication Factor (MF) for cost of medium severity level in the numerator and high severity level in the denominator showing the cost spread by age group and the areas between the curves.
while the MF for high severity cost is at the maximum level of 20. As further shown in Figure 11,
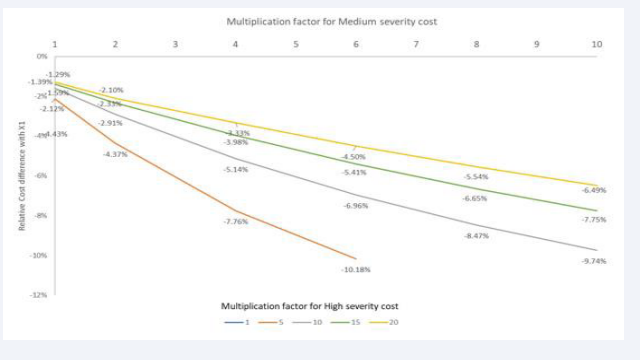
Figure 11: Multiplication factor for medium severity cost (1 to 10) on the X-axis for different multiplication factors of the cost of high severity level (colour index 1 to 20 in legend) expressed as a relative cost difference between X1 and X2 (Y-axis).
the relative overall cost difference between X1a and X2a under those circumstances is 1.29% or -€407 in absolute terms (€31,093-€31,500). The second row in (Figure 10) illustrates the result when the optimal combination is achieved in MFs for medium and high severity costs, resulting in the highest overall relative cost difference between X1a and X2a (11.19% or -€1,419; €11,261-12,630 for MF 6 in medium severity and 4 for high severity). One should be aware of the difference in overall costs by age group (Y-axis) between the first and second rows in (Figure 10). The result of moving to higher cost differences by disease severity level augments the overall negative relative cost difference between X1a and X2a (see Figure 11). The results of this analysis show the importance of investigating the dominance of high severity cost compared with the costs of the other severity levels of low and medium. With very high dominance of high severity cost (MF = 20), it is likely that the relative cost difference between homogeneous and heterogeneous overall cost estimates is marginal, as shown in (Figure 11). Some values in (Figure 11) are not reported because they do not comply with the constraint of having a higher cost for a higher severity level.
Demography
The last combined sensitivity analyses (3-way sensitivity analysis) for the disease burden are the demographic changes. It should be clear from previous evaluations that the current age-demographic composition of aging adults in Belgium induces an overestimation of the cost burden when using the full homogeneous analysis approach. It is therefore interesting to know by which level of age-demographic change the application of the full-homogeneous analysis may result in an underestimation of the cost burden. To make this analysis straightforward, an approximation is applied to the age-demographic change using linear regression lines that calculate the angle score in the age-demographic change to be increased for reaching the zero overall net sum cost (= €3000). The slope numbers of the 2 linear regression lines in (Figure 12),
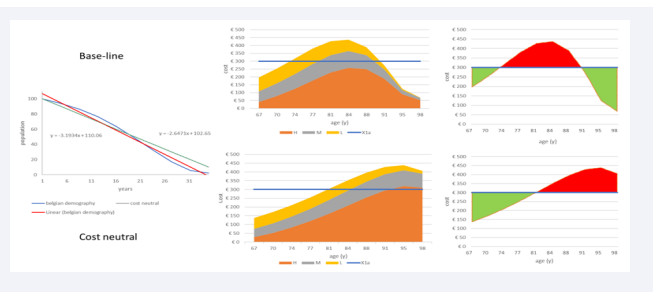
Figure 12: Estimating and visualizing the demographic increase needed to arrive at a cost-neutral estimate between X1a and X2b
left side, help indicate the negative angle increase of the demographic age component between the baseline Figure 5 with an overall cost of €2,875 and the cost neutral estimate at approximately €3,000. That angle increase (red arrow) is approximately 3.3° (110.7°-107.4°), which means that the population increase in the oldest age group of 98 y old must increase from 0.4% to 1.91% or a 4-fold increase in absolute numbers to reach the overall cost-neutral point.
A final disease burden analysis applies a demographic augmentation of the population in X2, which is different from the previous exercise, matching the current demographic age distribution in Belgium. This enlargement is a likely evolution that is compared with X1 with no demographic change. The analysis shifts the overall cost to an increase of 2.26% for a 7% population increase (Figure 13).
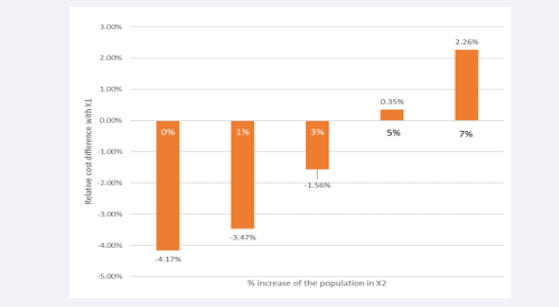
Figure 13: Effect of demographic change on the overall cost result.
It could move to close a 15% cost increase if a 20% population increase in X2 is applied, which may happen over a period of 15 to 30 y from now (data not shown).
Summary Results
Table 3 summarizes the outcome data of all the different simulations conducted based on the ESAP of (Table 2). To obtain estimates that are comparable between the different evaluations, relative cost differences are reported for X2 compared with X1. A large driver in the relative cost difference is the reference case selected and compared with the homogeneous condition (Step 5). The next one is the demographic change that may cause a 15% cost increase if the population augments by 20%. Other changes go into the direction between 2% and 12% cost changes.
Table 3: Absolute and relative change in overall cost by each analysis step of the ESAP.
|
Item |
sease cost burden |
|||||||||||||
|
Homogeneous |
Condition |
Step 1 |
Step 2 |
Step3 |
Step 4 |
Step 5 |
Specific |
Step 6 |
Specific |
3-way 1 |
Specific |
3-way 2 |
Specific |
3-way 3 |
|
X1a |
€ 3,000 |
€ 3,000 |
€ 3,000 |
€ 3,000 |
|
|
€ 3,000 |
|
€ 3,000 |
MFH20, MFM1 |
€ 31,500 |
|
€ 3,000 |
|
|
MFH4, MFM6 |
€ 12,680 |
|||||||||||||
|
X1b |
|
€ 2,250 |
|
|||||||||||
|
Non- homogeneous |
X2a |
€ 3,000 |
€ 3,000 |
€ 3,000 |
€ 2,875 |
€ 2,875 |
linear |
€ 3,000 |
Move |
€ 2,934 |
MFH20, MFM1 |
€ 31,093 |
|
|
|
exponential |
€ 3,262 |
+Grade 1 |
€ 2,922 |
MFH4, MFM6 |
€ 11,261 |
|||||||||
|
extreme |
€ 3,378 |
+Garde 2 |
€ 3,167 |
|
|
|||||||||
|
X2b |
|
|
|
|
|
|
|
|
1% |
€ 2,896 |
||||
|
7% |
€ 3,068 |
|||||||||||||
|
20% |
€ 3,441 |
|||||||||||||
|
Cost difference |
X2a-X1a |
€ 0 |
€ 0 |
€ 0 |
-€ 125 |
|
linear |
€ 0 |
Move |
-€ 66 |
MFH20, MFM1 |
-€ 407 |
|
|
|
exponential |
€ 258 |
+Grade1 |
-€ 78 |
MFH4, MFM6 |
-€ 1,419 |
|||||||||
|
extreme |
€ 352 |
+Grade2 |
€ 167 |
|
|
|||||||||
|
X2a-X1b |
|
€ 625 |
|
|||||||||||
|
X2b-X1a |
|
|
|
|
|
|
|
|
1% |
-€ 104 |
||||
|
7% |
€ 68 |
|||||||||||||
|
20% |
€ 441 |
|||||||||||||
|
Relative Cost Difference |
(X2a-X1a)/ X1a |
0.00% |
0.00% |
0.00% |
-4.17% |
|
linear |
0.00% |
Move |
-2.20% |
MFH20, MFM1 |
-1.29% |
|
|
|
exponential |
8.60% |
+Grade 1 |
-2.60% |
MFH4, MFM6 |
-11.19% |
|||||||||
|
extreme |
11.73% |
+Grade 2 |
5.57% |
|
|
|||||||||
|
(X2a-X1b)/ X1b |
|
|
|
|
27.78% |
|
|
|
|
|
||||
|
(X2b-X1a)/ X1a |
|
|
|
|
|
|
|
|
1% |
-3.47% |
||||
|
7% |
1.27% |
|||||||||||||
|
20% |
14.70% |
|||||||||||||
|
Figures |
|
Figure 2 |
Figure 3 |
Figure 4 |
Figure 5 |
Figure 6 |
Figure 7 |
Figures 8,9 |
Figures 10,11 |
Figure 13 |
||||
DISCUSSION
When there is limited accurate and detailed healthcare data that moreover are not easily available, analyses often rely on more accessible calculations such as arithmetic average values for a group under study. That approach assumes group homogeneity in the characteristics for which average values are applied. If this assumption is invalid, the summary results of cost could then be inaccurate with the reality. Other ways are needed to look for estimates of the uncertainty in the outcome results instead of using those averages. It is, however, often unknown whether non-homogeneity in the data causes substantial differences in the outcome results compared with the assumed homogeneity. To explore the potential size of the difference, this analysis here shows an approach using an extended sensitivity analysis tool, called the ESAP plan, that may help understand what is at stake. The variables selected and studied are known factors causing potential non-homogeneity in the group under study, such as demographic age distribution and infectious disease spread. These points have been mentioned in the literature, but few publications have evaluated the consequences of not assessing non-homogeneity in the data analysis. Non-homogeneity could be of little concern if the variable spread is well balanced in the group or when the numbers to evaluate are fixed, as illustrated in Step 1 and Step 6 (linear regression). However, if some or all the variables may have unequal or unbalanced distributions, the overall summary cost estimate may be heavily skewed, as a non- homogeneous factor may become especially critical if it is linked to other unbalanced variables in the group, such as age linked to infection incidence rate, frailty level, disease severity, and cost.
The summary Table 3 illustrates some interesting features of the ESAP analysis regarding issues that should be further investigated in a real-life setting. First, it is important to be clear about the reference condition of homogeneity selected for the comparison. One should define upfront whether a full (X1a) or partial (X1b) homogeneity condition is chosen. This selection may heavily influence the over- or underestimation level of the overall outcome measured with a non-homogeneous spread, as indicated in Step 4 versus Step 5 in this exercise. Step 4 selects a full homogeneous condition of comparison in X1a, leading to a marginal negative net cost difference (-4%) for the non-homogeneous condition, whereas in Step 5, a partial homogeneous condition is selected for comparison, and suddenly, the net cost difference is largely positive (29%) for the same non-homogeneous condition. The second important influencing factor is to check the age- specific demographic change in the study population linked to the incidence rate of infectious disease increase by age. That combination results in a bell-shaped frequency of the overall cost, as shown in (Figures 2,3). The bell shape will be more pronounced when the age-demographic and disease incidence data are more non-homogeneously spread by age. The third item to consider is the link between the distribution of disease severity levels by age and the cost per severity level. If there is not much of a difference in cost by disease severity level to be expected, then limited effort should be spent to obtain more precise overall costs than the homogeneous dataset.
When the full homogeneity situation has been selected, the results of this study indicate that the range of relative value changes in the overall cost estimates for disease management can reach a maximum of 15% in the context of extreme situations of demographic age distribution, disease incidence rate increase with increasing age, disease severity distribution by age group, and a high multiplication factor for the high cost in severity level (data not shown in the figures). When less pronounced distributions are considered, the relative cost difference between the fully homogeneous assumption of X1 and the non- homogeneous condition of X2 is likely to be between 2.5% and 6% overall. This indicates that the level of deviation in the cost summary results is not as large as often suspected. The difference change is limited because the constraints, defined upfront for this analysis, impose strict boundaries on the evaluation. For instance, non-homogeneity of the numbers by age groups is restricted and auto-correlated in the setting defined by the values in the prior age class and the post-age group using smooth curve design. This seems reasonable unless catastrophic events may temporarily disturb the age distribution, such as war or natural catastrophes, where suddenly many people of a specific age group are lost from the population. Other interesting features, identified through this ESAP, demonstrate the complexity of the problem. Demographic and disease spread alone do not create a cost difference unless linked to disease severity level spread and cost changes by disease severity levels.
An element of concern is the effect of non-homogeneous factors that are unbalanced in the opposite direction across the group, with strange consequences for the summary assessment. For example, with an ageing population, the decline in numbers of individuals in progressively older age groups, due to the increase in mortality with age, is not programmed as a gradual linear decrease with age but instead follows an accelerated course causing a highly unbalanced age distribution in the overall study group. Infection spread moves in the opposite direction, with higher prevalence rates in the older groups because of worsening health conditions with increasing age. There is a perception that aging induces an overall healthcare cost increase [22,23]. The example here, estimating overall healthcare costs of infectious disease management in ageing adults, indicates the opposite. This shows that the overall cost may be lower when adjusted for non-homogeneity compared with the overall cost of a study group when assumed to be fully homogeneous. This happens when the age structure is heavily unbalanced (fewer very old people), which imposes a lower absolute number of highly severe and costly treatments, despite having proportionally much more severe disease present in those older age classes. This lower overall cost estimation may seem counterintuitive, but (Figure 5) shows that it is possible. If, however, the age imbalance gets marginal (Figure 7), which is likely to be the development over time as the whole population lives longer, the problem of infectious diseases with more severe cases in the older groups could increase the overall cost above the homogeneously assumed estimates. Managing infectious disease in ageing people could therefore become a serious threat to tackle to help control healthcare cost increases over time.
Another surprising finding is that higher costs for the treatment of more severe cases may not result in an obvious change in the cost difference between an assumed homogeneous evaluation and an adjusted non-homogeneity evaluation, as indicated in (Figures 10,11). The result could move in the opposite direction, with a higher negative cost difference with higher cost for the more severe cases, because the average cost in the homogeneous situation X1 also increases (Figure 11). Additionally, changes in demographic composition may take time before a substantially higher cost is observed when substantially more people are living longer, as (Figures 12,13) indicate [24].
Having highlighted the issues of non-homogeneity with a hypothetical example using the ESAP, the results indicate the information that would be needed for developing more accurate estimates. Detailed demographic data are usually collected by national institutes of statistics at country level. However, infectious diseases are often neglected and not monitored or registered precisely and systematically across age groups. The recent COVID-19 pandemic highlighted the importance of measuring details of infection spread among different groups in the population.
This analysis did not include all possible factors that could have an unbalanced spread across the population group, as it would have been too complex to model non-homogeneity if all known factors had been considered. However, the following additional elements could be considered that might influence the overall cost results with their unequal distributions across the group: sex; health condition expressed as the level of co-morbidities present in numbers and severity; frailty and disability; place of living (home, nursing homes, service flats); and hospitalisation. Regarding frailty, a recent review has shown the bidirectional movement of infection that influences the frailty condition of the individual and vice versa [13]. This may complicate the correct assessment of the total infectious disease cost burden and the impact estimate of new interventions on that health condition, such as vaccination [17]. It is known and reported that frailty increases exponentially with aging, which may justify the exploration here of exponential graphs for infectious diseases [25]. The better knowledge about frailty that increases with time allows for considering more appropriate and efficient prevention programs in aging adults [14].
Regarding hospitalisation, infectious disease costs for hospitalisation are considerable, and the cost differences by type of infection in hospital care could be large. This could potentially cause a high impact on the estimates of the overall infectious disease cost if these differences are not accounted for, and this was not evaluated in this analysis [26,27]. Finally, another point not considered in this analysis is disease seasonality of the infection. This is particularly relevant for respiratory diseases, the most important type of infection in aging adults [28]. The seasonal effect is an important non-homogeneous factor influencing good management of hospital beds across the year. It can severely impact the quality of care in hospital disease management, as reported for infectious diseases in children [29].
Non-homogeneous analysis of the data, such as that presented here, may indicate a different assessment of the importance of the cost and the need for good management of the healthcare problem of infectious disease in older adults. Infectious diseases may spread beyond the initial cases and may harm many others during a considerable period. They become a serious threat when they accumulate, particularly in costly environments such as hospital settings. It is there that they cause most damage to society through increased treatment resistance while many of those infections could have been avoided through prevention.
Non-homogeneous analysis may capture more accurate and more detailed evaluations that better help to understand the costs of infectious disease and, consequently, the potential benefits of preventive interventions applicable to the VITAL program as indicated earlier [11].
The analysis presented here has some obvious limitations, as the objective of using a simple hypothetical example was to illustrate the use of the ESAP method that may indicate the potential impact on the differences between homogeneous and non-homogeneous data analysis. However, economic evaluations often work with simple models to inform. A check against real- world data may give a more nuanced picture at the end than what has been presented here by this simple evaluation. Future studies may go beyond this analysis form, using more sophisticated models that could also capture the effect of seasonality and other variables not considered in the current framework showing the indirect effects of new interventions such as vaccination [30].
Meanwhile, it is important to choose the most appropriate data analysis to obtain the most accurate estimates of the potential health and cost gains to be obtained from preventive interventions. Ultimately, the big challenge concerns the next steps after evaluating the costs of disease management, which include prevention strategies that support healthy ageing [31]. Understanding how non-homogeneity in variable categories may skew reported results, it could potentially help researchers to provide better modelling and evaluations of healthcare cost data closer to the real-world situation.
AUTHOR CONTRIBUTIONS
Baudouin Standaert conceived and designed the study, developed the model, analyzed the data, and drafted the manuscript.
Anne-Marie De Cock reviewed the different versions of the manuscript and included the clinical perspective of the analysis.
ACKNOWLEDGEMENTS
- Carole Nadin of Fleetwith, Kelso, UK, helped in streamlining the manuscript.
- Amandine Radzijwoski of Business & Decision, Brussels, Belgium, helped manage the submission.
AUTHORS’ INFORMATION
- Anne-Marie De Cock is head of the geriatric department of the biggest hospital in Belgium and has a huge interest in frailty measurement and in better understanding the infection problem amongst ageing adults.
- Baudouin Standaert is a health economist linked to the university of Hasselt and has a huge interest in infection problems, vaccination, and aging adults. They both worked together to investigate the infection problem in hospital care a few years ago.
REFERENCES
- Halloran ME, Longini IM Jr, Struchiner CJ. Design and interpretation of vaccine field studies. Epidemiol Rev. 1999; 21(1): 73-88. doi: 10.1093/oxfordjournals.epirev.a017990. PMID: 10520474.
- Chang AY, Skirbekk VF, Tyrovolas S, Kassebaum NJ, Dieleman JL. Measuring population ageing: an analysis of the Global Burden of Disease Study 2017. Lancet Public Health. 2019; 4(3): e159-e167. doi: 10.1016/S2468-2667(19)30019-2. PMID: 30851869; PMCID: PMC6472541.
- Tenhumberg B. Ignoring population structure can lead to erroneous predictions of future population size. Nature Education Knowledge, 2010; 3(10): 2.
- Bourguignon M, Sanserson JP, Gourbin C. The ageing of populations in Belgium: current situation and perspectives. Revue Quetelet, 2017; 5(2): 69-114.
- National Research Council (US) Panel on Statistics for an Aging Population. The Aging Population in the Twenty-First Century: Statistics for Health Policy. Gilford DM, editor. Washington (DC): National Academies Press (US); 1988. PMID: 25032446.
- Bloom D, Canning D, Lubet A. Global population aging: facts, challenges, solutions & perspectives. Daedalus, the journal of the American Academy of Arts & Sciences, 2015; 144(2): 80-92.
- National Academies of Sciences, Engineering, and Medicine; Division of Behavioral and Social Sciences and Education; Committee on Population. Future Directions for the Demography of Aging: Proceedings of a Workshop. Majmundar MK, Hayward MD, editors. Washington (DC): National Academies Press (US); 2018 Jun 26. PMID: 29989766.
- Zeevat F, van der Schans J, Boersma C, Standaert B, Postma M. PRS27 Incorporating Heterogeneity in Risk for Infection and Disease in Cost- Effectiveness of Preventative Strategies in Older Adults. Value Health. 2020; 23: S721. doi: 10.1016/j.jval.2020.08.1907. Epub 2020 Dec 11. PMCID: PMC8631991.
- Ferrucci L, Kuchel GA. Heterogeneity of Aging: Individual Risk Factors, Mechanisms, Patient Priorities, and Outcomes. J Am Geriatr Soc. 2021; 69(3): 610-612. doi: 10.1111/jgs.17011. Epub 2021 Jan 18. PMID: 33462804; PMCID: PMC9221786.
- De Cock AM, Strens D, Van Osta P, Standaert B. Infections and hospital bed-days among aging adults: A five-year retrospective study in a Belgian general hospital. Front Med Technol. 2022; 4: 912469. doi: 10.3389/fmedt.2022.912469. PMID: 36340588; PMCID: PMC9632861.
- Van Baarle D, Bollaerts K, Del Giudice G, Lockhart S, Luxemburger C, Postma MJ, et al. Vaccines, Infectious Diseases in the Ageing Population (VITAL) consortium. Preventing infectious diseases for healthy ageing: The VITAL public-private partnership project. Vaccine. 2020; 38(37): 5896-5904. doi: 10.1016/j.vaccine.2020.07.005. Epub 2020 Jul 24. PMID: 32713682; PMCID: PMC7378501.
- Cristina ML, Spagnolo AM, Giribone L, Demartini A, Sartini M. Epidemiology and Prevention of Healthcare-Associated Infections in Geriatric Patients: A Narrative Review. Int J Environ Res Public Health. 2021; 18(10): 5333. doi: 10.3390/ijerph18105333. PMID: 34067797; PMCID: PMC8156303.
- Vetrano DL, Triolo F, Maggi S, Malley R, Jackson TA, Poscia A, et al. Fostering healthy aging: The interdependency of infections, immunity and frailty. Ageing Res Rev. 2021; 69: 101351. doi: 10.1016/j. arr.2021.101351. Epub 2021 May 7. PMID: 33971332; PMCID: PMC9588151.
- Collard RM, Boter H, Schoevers RA, Oude Voshaar RC. Prevalence of frailty in community-dwelling older persons: a systematic review. J Am Geriatr Soc. 2012; 60(8): 1487-1492. doi: 10.1111/j.1532-5415.2012.04054.x. Epub 2012 Aug 6. PMID: 22881367.
- Curran D, Andrew MK, Levin MJ, Turriani E, Matthews S, Fogarty C, et al. Evaluation of two frailty indices, with practical application in a vaccine clinical trial. Hum Vaccin Immunother. 2019; 15(12): 2960- 2968. doi: 10.1080/21645515.2019.1622974. Epub 2019 Jun 21. PMID: 31157595; PMCID: PMC6930102.
- Pilotto A, Veronese N, Daragjati J, Cruz-Jentoft AJ, Polidori MC, Mattace- Raso F, et al. Using the Multidimensional Prognostic Index to Predict Clinical Outcomes of Hospitalized Older Persons: A Prospective, Multicenter, International Study. J Gerontol A Biol Sci Med Sci. 2019; 74(10): 1643-1649. doi: 10.1093/gerona/gly239. PMID: 30329033; PMCID: PMC6940980.
- Singh S, Heien HC, Sangaralingham L, Shah ND, Lai JC, Sandborn WJ, et al. Frailty and Risk of Serious Infections in Biologic-treated Patients With Inflammatory Bowel Diseases. Inflamm Bowel Dis. 2021; 27(10): 1626-1633. doi: 10.1093/ibd/izaa327. PMID: 33325507; PMCID: PMC8522787.
- STATBEL. Belgium in figures. 2020.
- Myrskylä M, Kohler HP, Billari FC. Advances in development reverse fertility declines. Nature. 2009; 460(7256): 741-743. doi: 10.1038/ nature08230. PMID: 19661915.
- Fried LP. Epidemiology of aging. Epidemiol Rev. 2000; 22(1): 95-106. doi: 10.1093/oxfordjournals.epirev.a018031. PMID: 10939013.
- Gavazzi G, Krause KH. Ageing and infection. Lancet Infect Dis. 2002;2(11): 659-666. doi: 10.1016/s1473-3099(02)00437-1. PMID:12409046.
- Schoevaerdts D, Sibille FX, Gavazzi G. Infections in the older population: what do we know? Aging Clin Exp Res. 2021; 33(3): 689- 701. doi: 10.1007/s40520-019-01375-4. Epub 2019 Oct 26. PMID:31656032.
- Kristensen M, van Lier A, Eilers R, McDonald SA, Opstelten W, van der Maas N, et al. Burden of four vaccine preventable diseases in older adults. Vaccine. 2016; 34(7): 942-949. doi: 10.1016/j.vaccine.2015.12.052. Epub 2016 Jan 3. PMID: 26752065.
- Cylus J, Roubal T, Ong P, Sagan A, Normand C, Figueras J. Sustainable Health Financing with an Ageing Population: Implications of different revenue raising mechanisms and policy options [Internet]. Copenhagen (Denmark): European Observatory on Health Systems and Policies; 2019.
- Mitnitski A, Rockwood K. The rate of aging: the rate of deficit accumulation does not change over the adult life span. Biogerontology. 2016; 17(1): 199-204. doi: 10.1007/s10522-015-9583-y. Epub 2015 May 14. PMID: 25972341.
- Bail K, Goss J, Draper B, Berry H, Karmel R, Gibson D. The cost of hospital-acquired complications for older people with and without dementia; a retrospective cohort study. BMC Health Serv Res. 2015; 15:91. doi: 10.1186/s12913-015-0743-1. PMID: 25890030; PMCID: PMC4376999.
- Standaert B, Sauboin C, DeAntonio R, Marijam A, Gomez J, Varghese L, et al. How to assess for the full economic value of vaccines? From past to present, drawing lessons for the future. J Mark Access Health Policy. 2020; 8(1): 1719588. doi: 10.1080/20016689.2020.1719588. PMID: 32128075; PMCID: PMC7034472.
- Lambeth. Rise in ‘excess deaths’ for elderly last winter likely due to flu. 2017.
- Standaert B, Alwan A, Strens D, Raes M, Postma MJ. Improvement in hospital Quality of Care (QoC) after the introduction of rotavirus vaccination: An evaluation study in Belgium. Hum Vaccin Immunother. 2015; 11(9): 2266-2273. doi: 10.1080/21645515.2015.1029212. PMID: 25902371; PMCID: PMC4635727.
- Møgelmose S, Neels K, Beutels P, Hens N. Exploring the impact of population ageing on the spread of emerging respiratory infections and the associated burden of mortality. BMC Infect Dis. 2023; 23(1): 767. doi: 10.1186/s12879-023-08657-3. PMID: 37936094; PMCID: PMC10629067.
- Doherty TM, Connolly MP, Del Giudice G, Flamaing J, Goronzy JJ, Grubeck-Loebenstein B, et al. Vaccination programs for older adults in an era of demographic change. Eur Geriatr Med. 2018; 9(3): 289-300. doi: 10.1007/s41999-018-0040-8. Epub 2018 Mar 19. PMID:29887922; PMCID: PMC5972173.


